Observational Study
. 2020 Jul 15;11(1):3546.
doi: 10.1038/s41467-020-17383-2.

ITLN1 modulates invasive potential and metabolic reprogramming of ovarian cancer cells in omental microenvironment

Affiliations
Observational Study

ITLN1 modulates invasive potential and metabolic reprogramming of ovarian cancer cells in omental microenvironment

Chi-Lam Au-Yeung et al. Nat Commun. .

Abstract

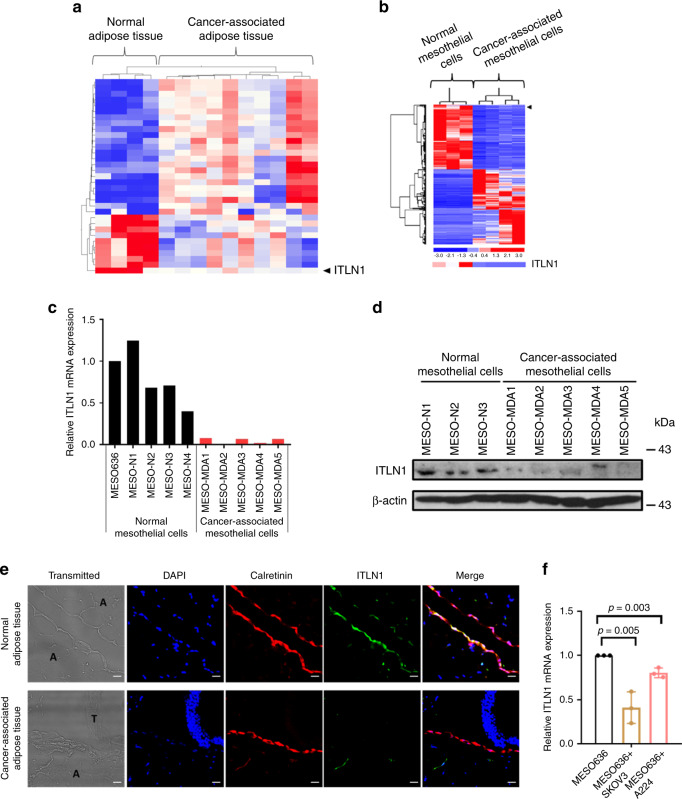
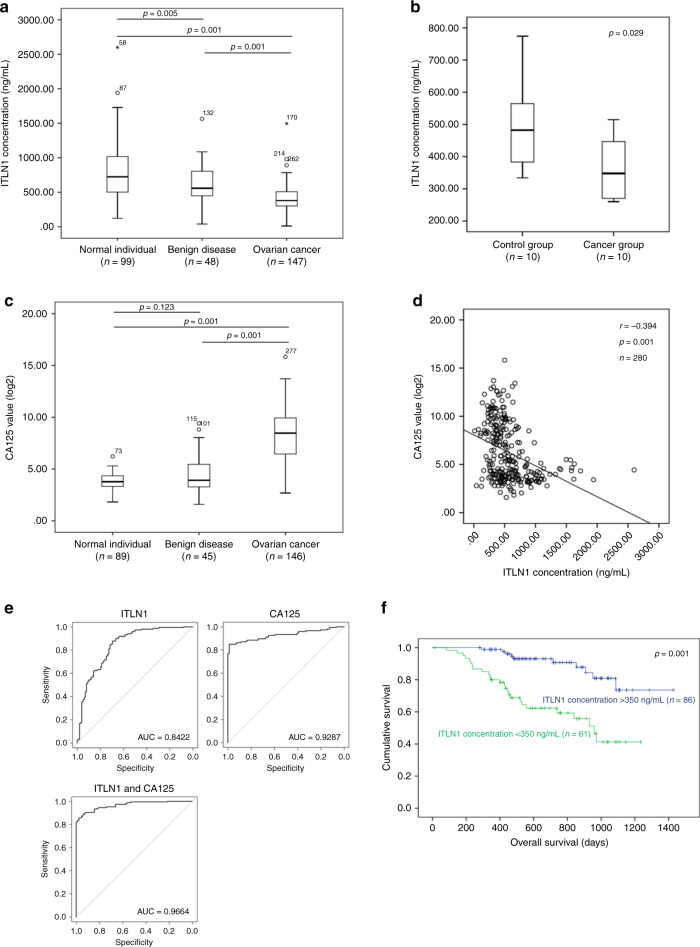
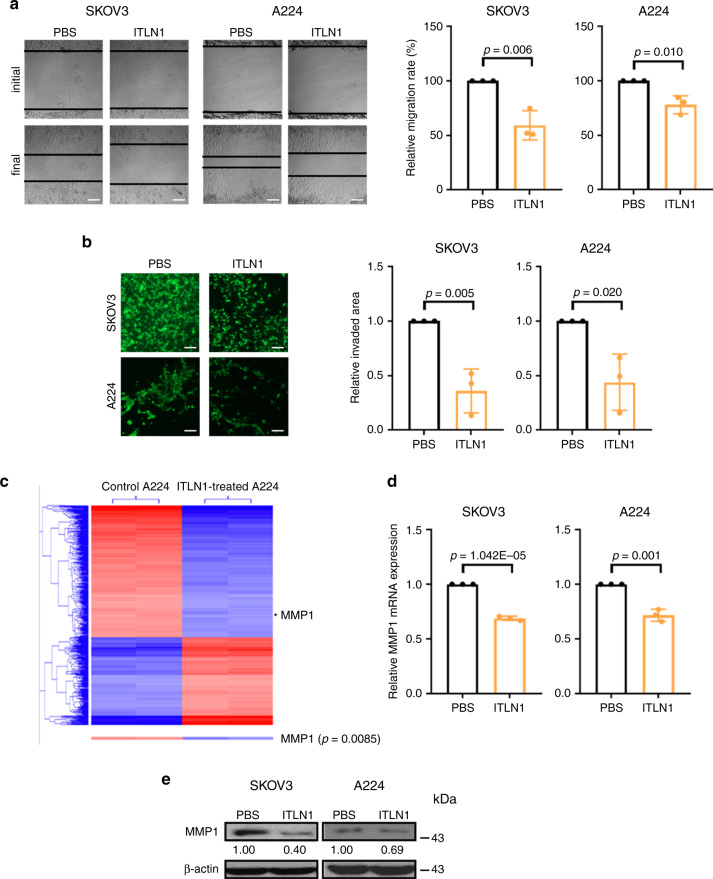
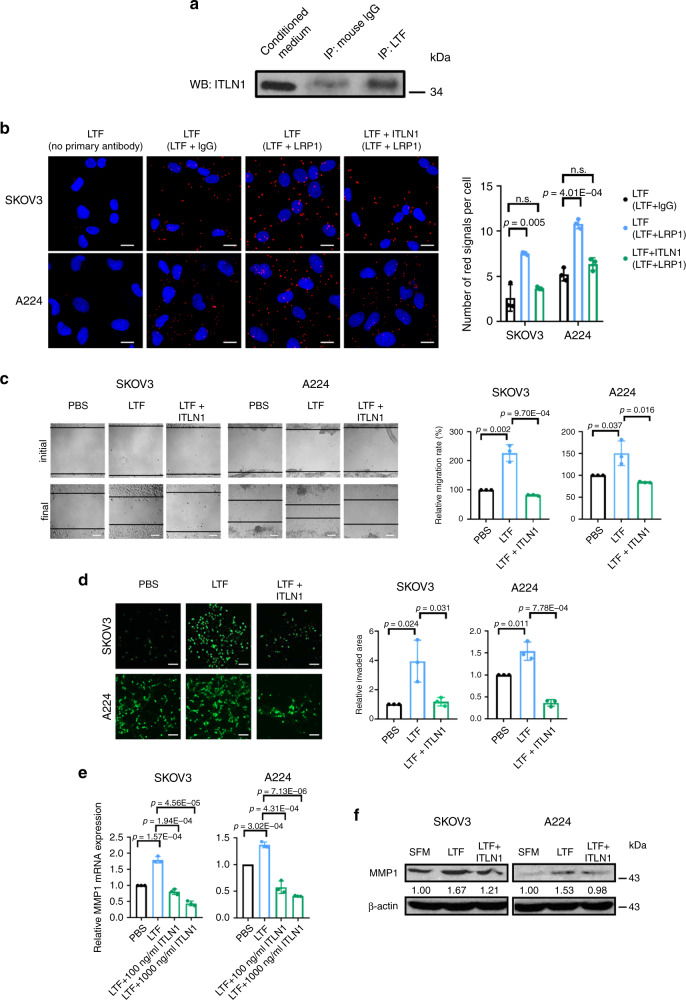
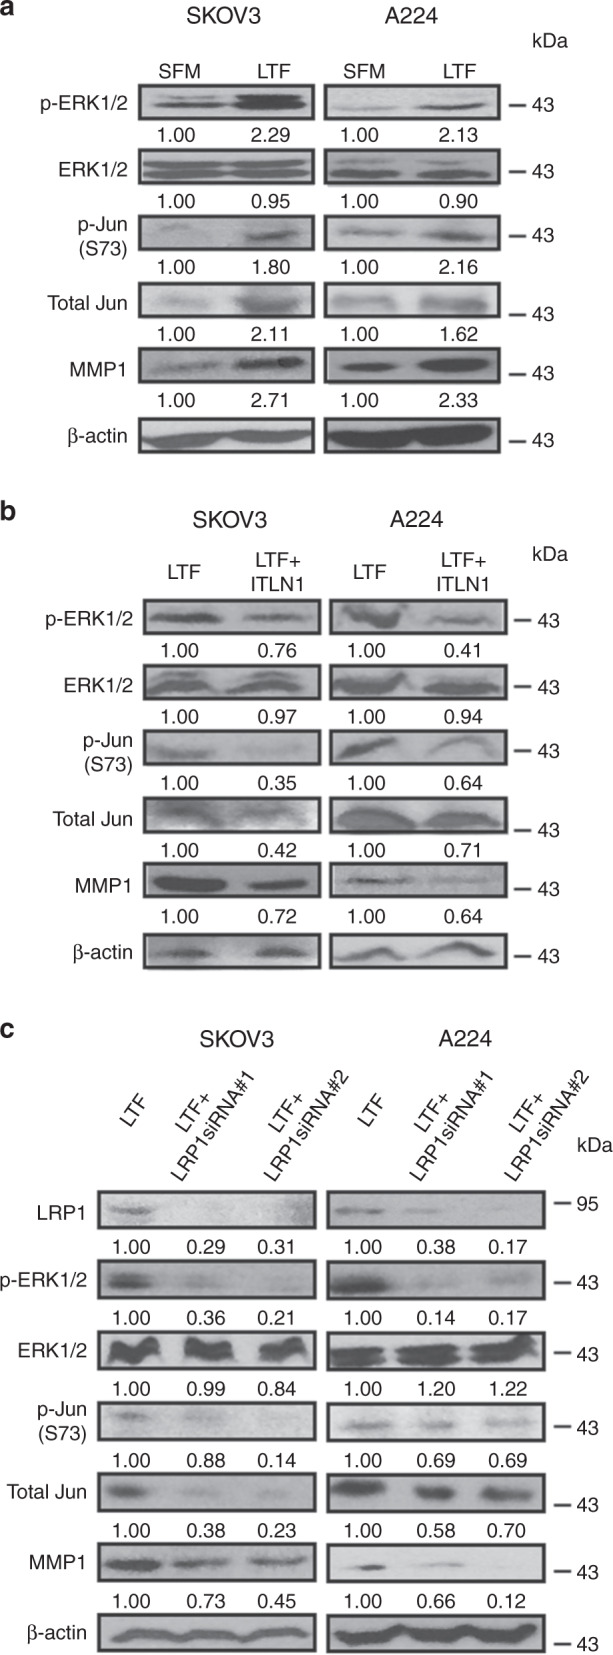
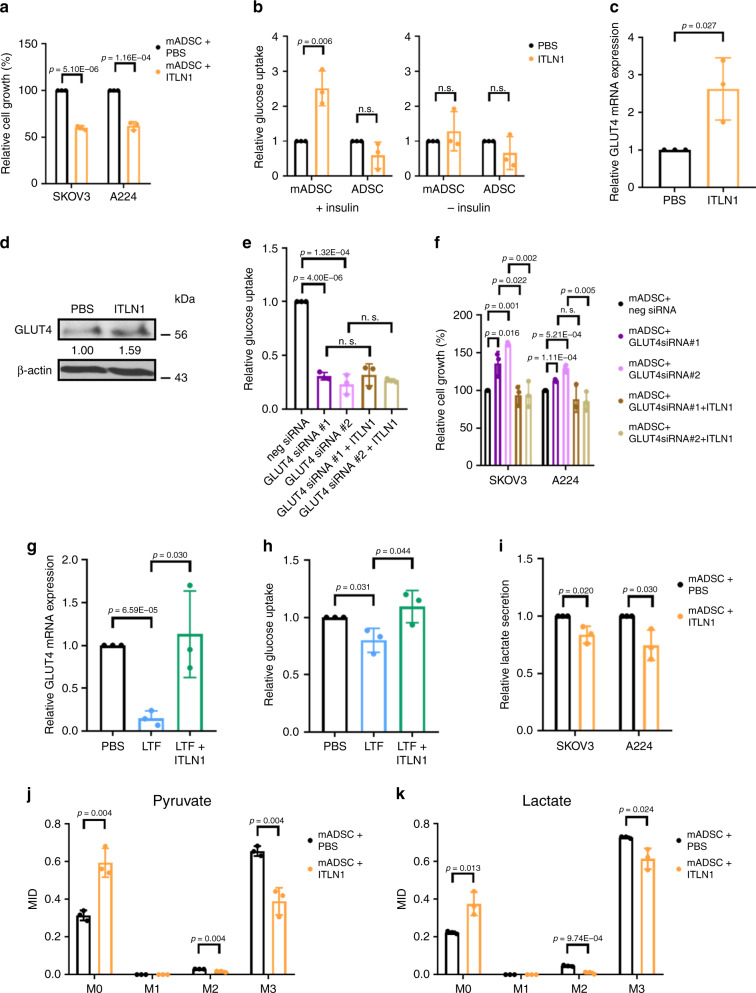
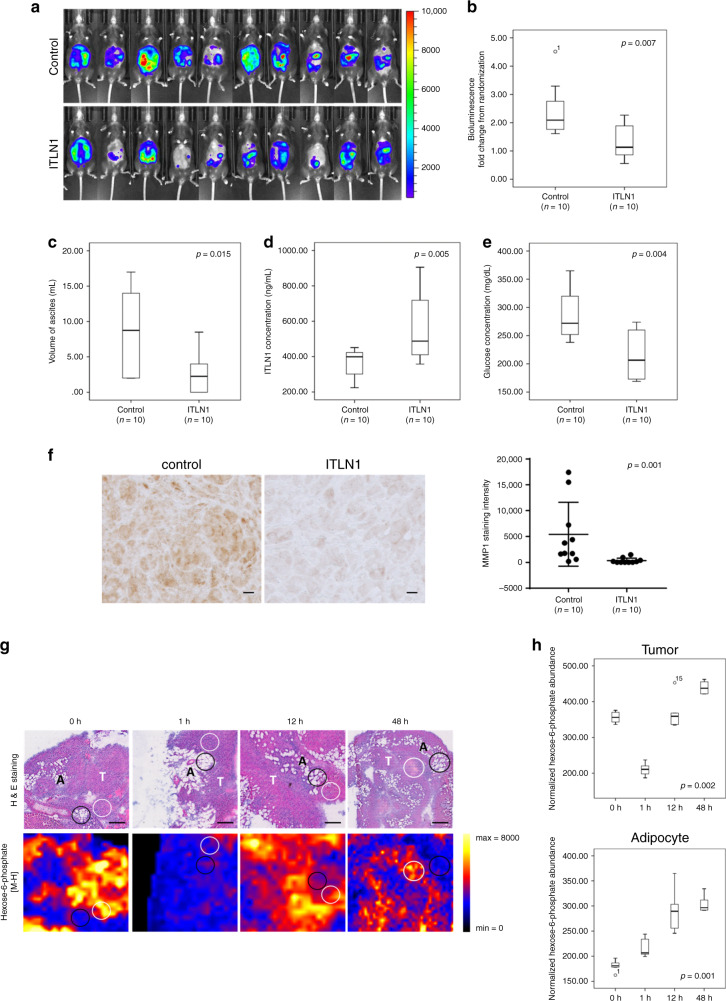
Advanced ovarian cancer usually spreads to the omentum. However, the omental cell-derived molecular determinants modulating its progression have not been thoroughly characterized. Here, we show that circulating ITLN1 has prognostic significance in patients with advanced ovarian cancer. Further studies demonstrate that ITLN1 suppresses lactotransferrin's effect on ovarian cancer cell invasion potential and proliferation by decreasing MMP1 expression and inducing a metabolic shift in metastatic ovarian cancer cells. Additionally, ovarian cancer-bearing mice treated with ITLN1 demonstrate marked decrease in tumor growth rates. These data suggest that downregulation of mesothelial cell-derived ITLN1 in the omental tumor microenvironment facilitates ovarian cancer progression.


Conflict of interest statement

The authors declare no competing interests.

Figures

Fig. 1
Fig. 1. ITLN1 expression is downregulated in ovarian cancer-associated mesothelial cells.
Heat map obtained (a) using transcriptome profiling analysis shows ITLN1 expression is significantly decreased in microdissected ovarian cancer-associated omental adipose tissue samples from HGSC patients (n = 10) compared with normal omental adipose tissue samples from patients with benign gynecologic diseases (n = 4); b using RNA-sequencing technique shows ITLN1 expression is significantly decreased in ovarian cancer-associated mesothelial cells derived from ascites of HGSC patients (n = 4) compared with commercially purchased, normal mesothelial cells (n = 3). c QRT-PCR and d western blot analyses show a lower ITLN1 mRNA and protein expressions in ovarian cancer-associated mesothelial cells (n = 5) compared with normal mesothelial cells (n = 5 and n = 3, respectively). β-actin served as a loading control. e Representative microscopic images from immunolocalization show a lower ITLN1 expression level in the mesothelial cell layer (calretinin-positive) covering the ovarian cancer-associated omental adipose tissues compared with normal adipose tissues from healthy women. A adipocytes, T tumors; Bar = 40μm; n = 3. f QRT-PCR analysis shows a lower ITLN1 mRNA level in MESO636 co-cultured with SKOV3 and A224 compared with MESO636 cultured alone. Results from three independent experiments were averaged and are shown as mean ± SD (two-tailed t-test).
Fig. 2
Fig. 2. Higher circulating ITLN1 levels predict improved overall survival rates.
a Box plot shows a significantly lower ITLN1 level in serum collected from HGSC patients (n = 147) compared with normal women (n = 99) and patients with benign gynecologic disease (n = 48) (p = 0.001 for both comparisons; Mann–Whitney U test). b Box plot shows a significantly lower ITLN1 level in serum collected from C57BL/6 mice with IG10 cells injected intraperitoneally (n = 10) compared with the control group without cancer cell injection (n = 10) (p = 0.029; Mann–Whitney U test). c Box plot shows a significantly higher CA125 level in serum collected from HGSC patients (n = 146) compared with normal women (n = 89) and patients with benign gynecologic disease (n = 45) (p = 0.001 for both comparisons; Mann–Whitney U test). d Graph shows a negative correlation between ITLN1 and CA125 levels in serum collected from normal women, patients with benign gynecologic disease, and HGSC patients (n = 280; r (Spearman’s rank correlation coefficient) = −0.394; p = 0.001). e Receiver operating characteristic curves show a significantly larger area under the curve (AUC) with a combination of ITLN1 and CA125 (AUC = 0.9664) compared with ITLN1 alone (AUC = 0.8422) and CA125 alone (AUC = 0.9287) (p = 0.001 and p = 0.029, respectively; one-tailed ROC.test function). f Kaplan–Meier analysis shows that a high (>350 ng mL−1) preoperative circulating ITLN1 level was significantly associated with a longer overall survival duration (n = 147; p = 0.001; two-tailed log rank test). ac In the box plot, the boxes represent the interquartile range of the records, and the lines across the boxes indicate the median value of the records. The whiskers indicate the highest and lowest values among the records that are no more than 1.5 times greater than the interquartile range.
Fig. 3
Fig. 3. MMP1 mediates the effect of ITLN1 on suppressing ovarian cancers’ motility.
Representative microscopic images of (a) a wound-healing assay show that ITLN1 suppressed cell migration ability in SKOV3 and A224; b a cell invasion assay show that ITLN1 suppressed cell invasive potential in SKOV3 and A224. Bar = 50 μm. Results in the bar charts, presented as mean ± SD (two-tailed t-test), show the average from three independent experiments with duplicated samples. PBS phosphate-buffered saline. c Heat map from a transcriptome profiling analysis shows that MMP1 expression is significantly decreased in ITLN1-treated A224 (n = 2) compared with control A224 without ITLN1 treatment (n = 2). d QRT-PCR analysis shows a lower MMP1 mRNA level in ITLN1-treated SKOV3 and A224 compared with control cells treated with PBS. Results, as presented as mean ± SD (two-tailed t-test), show the average from three independent experiments. e Western blot analysis shows a lower MMP1 protein level in ITLN1-treated SKOV3 and A224 compared with control cells treated with PBS. β-actin served as a loading control. Relative normalized protein levels with respect to the corresponding control are presented. Three independent experiments were performed.
Fig. 4
Fig. 4. ITLN1 abrogates LTF’s effects on ovarian cancer cells’ motility.
a Western blot analysis shows ITLN1 on proteins pulled down by an anti-LTF antibody. Normal mouse IgG served as a control. ITLN1 band size = 34 kDa. b Representative microscopic images from a Duolink proximity ligation assay (PLA) on SKOV3 and A224 shows the interaction between LTF and LRP1 while ITLN1 reduced the interaction. Red fluorescent signals indicate protein–protein interaction; nuclei were stained with 4,6-diamidino-2-phenylindole (DAPI) blue. Staining with no primary antibody and with anti-LTF antibody plus normal rabbit IgG served as controls. Bar = 5 μm. Representative microscopic images show that LTF induced c cell migration ability and d cell invasion potential in SKOV3 and A224 compared with control cells, while ITLN1 counteracted the effect. Bar = 50 μm. e Bar charts show that LTF upregulated the relative MMP1 mRNA expression in SKOV3 and A224, while ITLN1 counteracted the effect. f Western blot analysis shows that LTF upregulated MMP1 protein expression in SKOV3 and A224, while ITLN1 counteracted the effect. β-actin served as a loading control. Relative normalized protein levels with respect to the corresponding control are presented. Three independent experiments were performed. b, e Results from three independent experiments were averaged and are shown as mean ± SD (two-tailed t-test). n. s. not significant (p > 0.05).
Fig. 5
Fig. 5. ITLN1 inhibits the LTF/LRP1/MMP1 signaling pathway.
Western blot analyses show (a) higher protein levels of p-ERK1/2, p-Jun (S73), total Jun, and MMP1 in LTF-treated (100 μg mL−1) SKOV3 and A224 compared with control cells without treatment; b lower protein levels of p-ERK1/2, p-Jun (S73), total Jun, and MMP1 in LTF-treated SKOV3 and A224 with ITLN1 (500 ng mL−1) compared with control cells without ITLN1; and c lower protein levels of LRP1, p-ERK1/2, p-Jun (S73), total Jun, and MMP1 in LTF-treated SKOV3 and A224 with LRP1-specific siRNAs compared with control cells with negative siRNA. β-actin served as a loading control. Relative normalized protein levels with respect to the corresponding control are presented. Three independent experiments were performed.
Fig. 6
Fig. 6. ITLN1 suppresses ovarian cancer cell growth by enhancing glucose uptake in adipocytes.
a ITLN1 suppressed SKOV3 and A224 cell growth in the presence of mature adipocytes (mADSC). b ITLN1 enhanced insulin-dependent glucose uptake in mADSC but not in adipose-derived stem cells (ADSC), when both are compared with control cells without ITLN1 treatment. ITLN1 also has no significant effect on glucose uptake in mADSC and ADSC in the absence of insulin. c ITLN1 upregulated GLUT4 mRNA expression in mADSC compared with control cells without ITLN1 treatment in the presence of insulin. d Western blot analysis shows a higher GLUT4 protein level in ITLN1-treated mADSC in the presence of insulin compared with control cells. β-actin served as a loading control. Relative normalized protein levels with respect to the corresponding control are presented. Three independent experiments were performed. GLUT4 siRNA transfection counteracted ITLN1’s effect on e insulin-dependent glucose uptake in mADSC and f cell growth in SKOV3 and A224. LTF downregulated g the relative GLUT4 mRNA expression and h insulin-dependent glucose uptake in mADSC, while ITLN1 counteracted the effects. i ITLN1 reduced lactate production in SKOV3 and A224 in the presence of mADSC. j, k GC–MS results were reported as mass isotopologue distributions (MID), which represented the relative abundance of different mass isotopologues of each metabolite; M0 referred to the isotopologues with all 12C atoms, and M1 to M3 referred to heavier isotopologues with one to three 13C atoms derived from the tracer. The (j) M3 pyruvate fraction and (k) M3 lactate fraction indicated significantly lower glycolytic fluxes in A224 co-cultured with ITLN1-treated mADSC compared with controls not treated with ITLN1. ac, ek Results from three independent experiments were averaged and are shown as mean ± SD (two-tailed t-test). n. s. not significant (p > 0.05).
Fig. 7
Fig. 7. ITLN1 suppresses ovarian cancer progression via metabolic shift in vivo.
a Images show a decrease in bioluminescence of IG10 cell-bearing C57BL/6 mice with ITLN1 treatment (n = 10) compared with untreated controls (n = 10) 6 weeks after treatment. Box plot shows a significantly (b) smaller tumor growth rate in; c smaller volume of ascites collected from; d higher ITLN1 concentration in serum collected from; and e lower glucose concentration in whole blood collected from IG10 cell-bearing C57BL/6 mice with ITLN1 treatment (n = 10) compared with untreated controls (n = 10) (p = 0.007, p = 0.015, p = 0.005, and p = 0.004, respectively; Mann–Whitney U test) 6 weeks after treatment. f Representative microscopic images of paraffinized sections of tumor tissues collected from IG10 cell-bearing C57BL/6 mice 6 weeks after treatment shows a significantly lower MMP1 expression in the ITLN1 treatment group compared with the untreated controls. Bar = 10 μm. Quantification of the staining intensity for each group (n = 10) is shown in dot plot. p = 0.001; Mann–Whitney U test. g Representative images show reduced intensity of hexose-6-phosphate (glucose-6-phosphate and fructose-6-phosphate) (ion adduct: [M-H]; mass to charge ratio (m/z): 259.0224) in tumor cells (white circles) in frozen omental tumor tissue sections from 0 to 1 h post injection of ITLN1, while increased intensity of hexose-6-phosphate is seen in adjacent adipocytes (black circles) post injection of ITLN1. The same tissue sections were stained with haematoxylin and eosin (H&E) after MALDI-imaging mass spectrometry (IMS). T tumor cells, A adipocytes; Bar = 200 μm. Three ROIs for each region (tumor and adipocyte) were randomly selected for each section (n = 5) based on histology of cell types for the analysis. h Box plot shows the normalized hexose-6-phosphate intensity in tumor cells (upper panel) and adipocytes (lower panel) at different time points after ITLN1 was intraperitoneally injected into C57BL/6 mice. (p = 0.002 and 0.001, respectively; Kruskal–Wallis H test). n = 5 in each group. ae, h In the box plot, the boxes represent the interquartile range of the records, and the lines across the boxes indicate the median value of the records. The whiskers indicate the highest and lowest values among the records that are no more than 1.5 times greater than the interquartile range.

References

    1. Siegel RL, Miller KD, Jemal A. Cancer statistics, 2018. CA Cancer J Clin. 2018;68:7–30. doi: 10.3322/caac.21442. - DOI - PubMed
    1. Calle EE, Thun MJ. Obesity and cancer. Oncogene. 2004;23:6365–6378. doi: 10.1038/sj.onc.1207751. - DOI - PubMed
    1. Colditz GA, Wei EK. Preventability of cancer: the relative contributions of biologic and social and physical environmental determinants of cancer mortality. Annu. Rev. Public Health. 2011;33:137–156. doi: 10.1146/annurev-publhealth-031811-124627. - DOI - PMC - PubMed
    1. Khandekar MJ, Cohen P, Spiegelman BM. Molecular mechanisms of cancer development in obesity. Nat. Rev. Cancer. 2011;11:886–895. doi: 10.1038/nrc3174. - DOI - PubMed
    1. Mutsaers SE. The mesothelial cell. Int. J. Biochem. Cell Biol. 2004;36:9–16. doi: 10.1016/S1357-2725(03)00242-5. - DOI - PubMed

Publication types

MeSH terms