. 2021 Jan;31(1):80-93.
doi: 10.1038/s41422-020-0372-z. Epub 2020 Jul 15.

Skp2 dictates cell cycle-dependent metabolic oscillation between glycolysis and TCA cycle

Affiliations

Skp2 dictates cell cycle-dependent metabolic oscillation between glycolysis and TCA cycle

Jing Liu et al. Cell Res. 2021 Jan.

Erratum in

Abstract

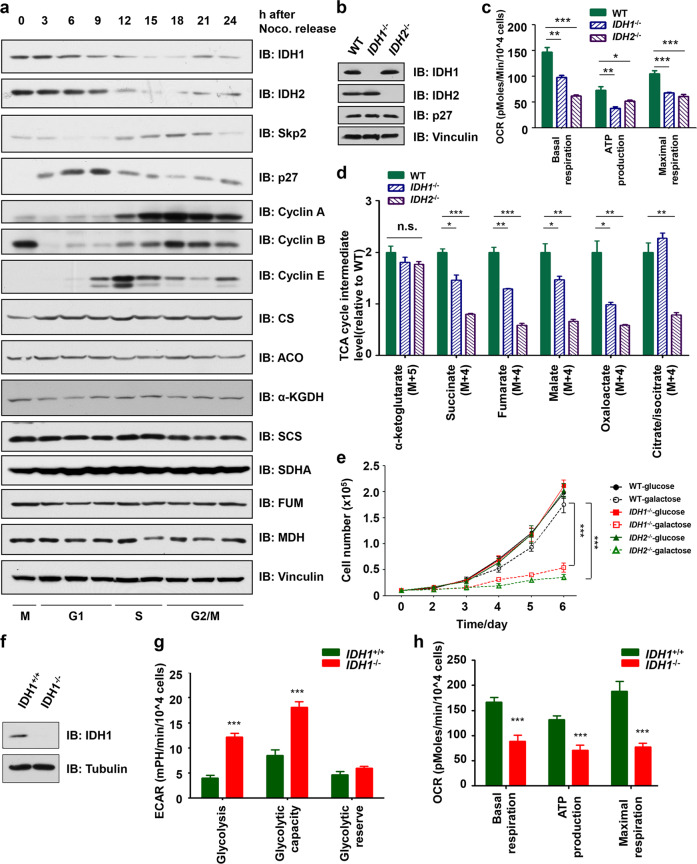
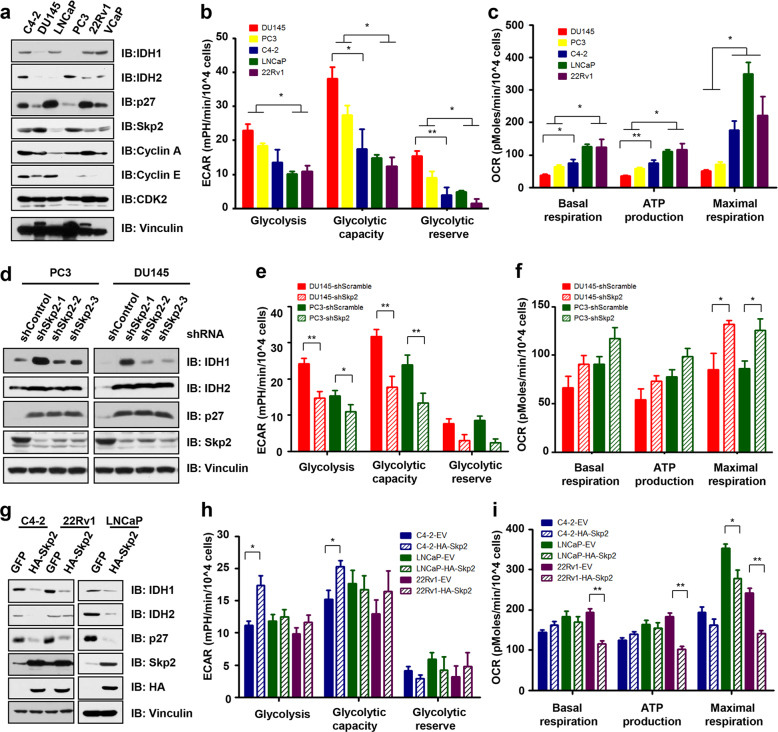
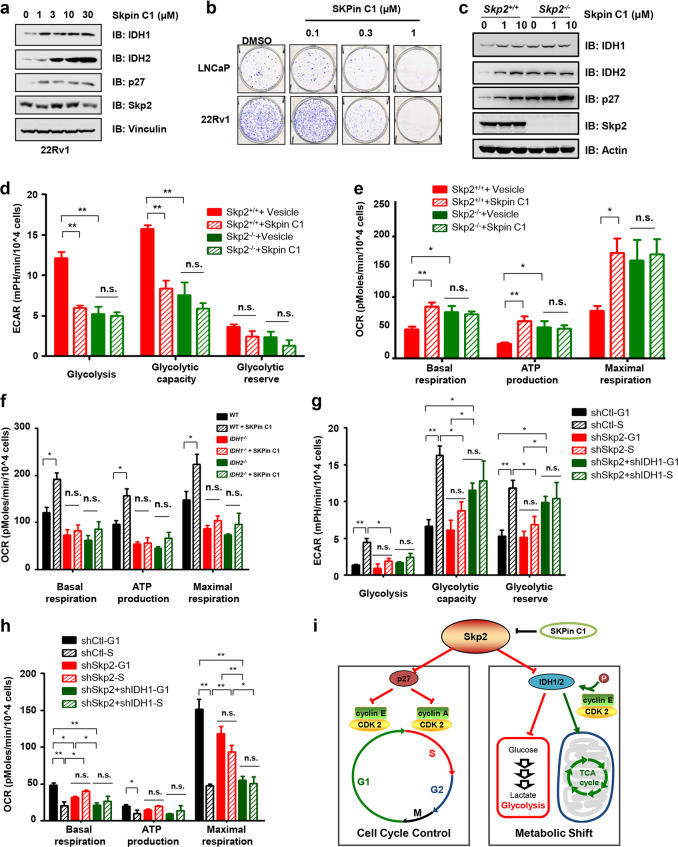
Whether glucose is predominantly metabolized via oxidative phosphorylation or glycolysis differs between quiescent versus proliferating cells, including tumor cells. However, how glucose metabolism is coordinated with cell cycle in mammalian cells remains elusive. Here, we report that mammalian cells predominantly utilize the tricarboxylic acid (TCA) cycle in G1 phase, but prefer glycolysis in S phase. Mechanistically, coupling cell cycle with metabolism is largely achieved by timely destruction of IDH1/2, key TCA cycle enzymes, in a Skp2-dependent manner. As such, depleting SKP2 abolishes cell cycle-dependent fluctuation of IDH1 protein abundance, leading to reduced glycolysis in S phase. Furthermore, elevated Skp2 abundance in prostate cancer cells destabilizes IDH1 to favor glycolysis and subsequent tumorigenesis. Therefore, our study reveals a mechanistic link between two cancer hallmarks, aberrant cell cycle and addiction to glycolysis, and provides the underlying mechanism for the coupling of metabolic fluctuation with periodic cell cycle in mammalian cells.


Conflict of interest statement

W.W. is a co-founder and consultant of the ReKindle Therapeutics. All other authors declare no competing interests.

Figures

Fig. 1
Fig. 1. Mammalian cells adopt different glucose metabolism pathways in different cell cycle stages, primarily utilizing TCA cycle in G1 phase, but relying on glycolysis in S phase.
a Schematic illustration of the experimental procedure for ECAR and OCR measurements of synchronized cells. b Glycolysis, measured as ECAR, was found to be higher for cells in early S phase than in G1 phase. HeLa cells were synchronized by 10 μg/mL nocodazole for 20 h and subsequently released for the indicated time periods. From the ECAR curve, glycolysis (ECAR level in the presence of glucose), glycolytic capacity (stimulated glycolysis when oligomycin is used to inhibit ATP synthase), and glycolytic reserve (glycolytic capacity minus glycolysis) were calculated. **P < 0.01, ***P < 0.001. c TCA cycle, measured as OCR, was found to be lower for cells in early S phase than in G1 phase. HeLa cells were synchronized by 10 μg/mL nocodazole for 20 h and subsequently released for the indicated time periods. From the OCR curve, basal respiration, ATP production (the OCR portion that is inhibited by oligomycin), and maximal respiration (stimulated OCR when antimycin A is used to inhibit electron transfer chain complex III) were calculated. *P < 0.05, **P < 0.01. d Schematic illustration of the experimental procedure for the flux assay of synchronized cells. e Glycolytic intermediate level was found to be higher for cells in S phase than in G1 phase. HeLa cells were synchronized with nocodazole blockage and released for 6 h (G1 phase) or 12 h (S phase), and labeled with 13C-glucose for 1 min, followed by measurement of labeled glycolytic intermediates. *P < 0.05, **P < 0.01. f TCA cycle intermediate level was found to be lower for cells in S phase than in G1 phase. HeLa cells were synchronized with nocodazole and released for 6 h (G1 phase) or 12 h (S phase), and labeled with 13C-glutamine for 1 h, followed by measurement of the labeled TCA cycle intermediates. n.s., not significant; *P < 0.05, **P < 0.01, ***P < 0.001.
Fig. 2
Fig. 2. The fluctuation of IDH1/2 protein abundances during cell cycle.
a Protein abundance of IDH1, and to a lesser extent of IDH2, fluctuated during the cell cycle. HeLa cells were synchronized by 10 μg/mL nocodazole for 20 h and subsequently released for the indicated time periods before harvesting for immunoblot (IB) analysis. b IB of IDH1 and IDH2 in HAP1-IDH1–/– and HAP1-IDH2–/– cells. c Depletion of IDH1 or IDH2 compromised OCR. *P < 0.05, **P < 0.01, ***P < 0.001. d Depletion of IDH1 or IDH2 decreased TCA cycle intermediate level. HAP1-IDH1–/–, HAP1-IDH2–/– and parental cells (WT) were labeled with 13C-glutamine for 1 h followed by measurement of the labeled TCA cycle intermediates. n.s., not significant; *P < 0.05, **P < 0.01, ***P < 0.001. e Loss of either IDH1 or IDH2 impaired oxidative phosphorylation in HAP1 cells. HAP1-WT, HAP1-IDH1–/– and HAP1-IDH2–/– cells were cultured in DMEM with either glucose or galactose for 6 days, and the growth curve was drawn. ***P < 0.001. f IB of IDH1 in IDH1+/+ and IDH1–/– HeLa cells. HeLa-IDH1/– cells were made using CRISPR/Cas9. g ECAR levels of IDH1+/+ and IDH1–/– HeLa cells. ***P < 0.001. h OCR levels of HeLa-IDH1+/+ and IDH1–/– HeLa cells. ***P < 0.001.
Fig. 3
Fig. 3. SCFSkp2 promotes IDH1/2 ubiquitination and subsequent degradation, thus dictating cell cycle-dependent metabolic shift.
a MG132 or MLN4924 treatment led to accumulation of IDH1 and IDH2. RWPE1 cells were incubated with 10 μM MG132 or 1 μM MLN4924 for 12 h, followed by IB analysis of the indicated proteins. b IDH1 specifically interacted with Cullin 1 in cells. IB analysis of immunoprecipitate (IP) and whole cell lysate (WCL) derived from HEK293 cells that were transfected with Flag-IDH1 and the indicated Myc-tagged Cullins for 48 h. Cells were treated with 10 μM MG132 for 12 h before harvest. c Knockdown of Cullin 1, but not Cullin 3, led to accumulation of IDH1 in cells. PC3 cells were infected with shControl, shCullin 1, or shCullin 3 lenti-viruses, and selected with puromycin for 3 days, followed by IB analysis of the indicated proteins. d IDH1 specifically interacted with two F-box proteins, Skp2, and to a lesser extent, Fbw4, in cells. IB analysis of IP and WCL derived from HEK293 cells that were transfected with Flag-IDH1 and the indicated CMV-GST-tagged F-box proteins for 48 h. Cells were treated with 10 μM MG132 for 12 h before harvest. e Skp2, but not Fbw4, promoted IDH1 ubiquitination in cells. IB analysis of Ni-NTA pull-down products and WCL derived from HEK293 cells transfected with the indicated constructs. Cells were treated with 30 μM MG132 for 6 h before harvest. f Depletion of Skp2 in HeLa cells led to accumulation of IDH1. HeLa cells were infected with pLKO-shSkp2 or mock lenti-viruses, selected with puromycin (1 μg/mL) for 3 days to eliminate non-infected cells, and subjected to IB analysis with the indicated antibodies. g Genetic ablation of Skp2 in MEFs led to a significant increase in protein abundance of IDH1 and IDH2. Skp2+/+ and Skp2–/– primary MEFs were harvested and subjected to IB analysis with the indicated antibodies. h Depletion of endogenous Skp2 abolished IDH1/2 abundance fluctuation during the cell cycle. HeLa cells were infected with pLKO-shSkp2 or mock lenti-viruses, and selected by puromycin for 3 days to eliminate non-infected cells. The resulting cells were synchronized by 10 μg/mL nocodazole for 20 h and subsequently released for the indicated time periods. The cells were harvested and WCL was subjected to IB analysis with the indicated antibodies. i Depletion of endogenous Skp2 abolished the glycolytic peak in S phase. After releasing for the indicated time periods, cell lines generated in h were subjected to ECAR measurement using Seahorse XF extracellular flux analyzer. n.s., not significant; *P < 0.05, **P < 0.01, ***P < 0.001. j Depletion of endogenous Skp2 impaired the decrease of OCR in S phase. After releasing for the indicated time periods, various cell lines generated in h were subjected to OCR measurement using Seahorse XF extracellular flux analyzer. *P < 0.05, **P < 0.01. k Depletion of endogenous Skp2 eliminated the observed difference in glycolytic intermediate level between G1 phase and S phase. Various cell lines generated in h were synchronized and released for the indicated time periods, followed by 13C-glucose labeling for 60 s. The labeled glycolytic intermediates were measured using HPLC-MS. n.s., not significant; *P < 0.05, **P < 0.01, ***P < 0.001. l Depletion of endogenous Skp2 eliminated the observed difference in TCA cycle intermediate level between G1 phase and S phase. Various cell lines generated in h were synchronized and released for the indicated time periods, followed by 13C-glutamine labeling for 1 h. The labeled TCA cycle intermediates were measured using HPLC-MS. n.s., not significant; **P < 0.01, ***P < 0.001.
None
Fig. 4 Cyclin E/CDK2 phosphorylates IDH1 to trigger its ubquitination and subsequent degradation by SCFSkp2.
a Skp2 promoted IDH1 degradation in a cyclin E/CDK2- and/or cyclin A/CDK2-dependent manner in cells. IB analysis of HeLa cells after being transfected with Flag-IDH1 and the indicated constructs for 48 h. b Genetic ablation of Ccne1 but not Ccne2 in MEFs led to a significant increase in protein abundance of IDH1 and IDH2. Immortalized Ccne1–/–, Ccne2–/– and WT MEFs were harvested and subjected to IB analysis with the indicated antibodies. c Depletion of Ccne1 led to elevation of OCR. Ccne1–/–, Ccne2–/– and WT MEFs were subjected to OCR measurement using Seahorse XF extracellular flux analyzer. ***P < 0.001. d Cyclin E/CDK2 phosphorylated IDH1 in vitro. Bacterially purified GST or GST-IDH1 recombinant proteins were incubated with purified cyclin E/CDK2 for 30 min at 30 °C using 32P-γ-ATP as donor for phosphorylation, followed by SDS-PAGE. The protein input was stained with coomassie brilliant blue. e Alignment of the conserved TP/SP sites within IDH1 and IDH2 protein sequences among different species. f Identification of the T157 residue as the major site phosphorylated by cyclin E/CDK2 in vitro. Bacterially purified His-tagged IDH1 WT or mutant proteins were incubated with purified cyclin E/CDK2 for 30 min using 32P-γ-ATP as donor for phosphorylation, followed by SDS-PAGE. The protein input was stained with coomassie brilliant blue. g Cyclin E/CDK2-dependent phosphorylation of T157 was required for IDH1 to be recognized by recombinant Skp2 in vitro. Bacterially purified recombinant GST-tagged IDH1 WT or mutant proteins were incubated with or without purified cyclin E/CDK2 for 30 min using ATP as donor for phosphorylation, followed by His-Skp2 pull-down, and then subjected to SDS-PAGE and IB analysis. The protein input was stained with coomassie brilliant blue. h Compared to IDH1-WT, the Skp2-dependent ubiquitination of IDH1-T157A mutant was impaired in cells. IB analysis of Ni-NTA pull-down products and WCL derived from HEK293 cells transfected with Flag-tagged IDH1 WT or mutants, together with other indicated constructs. Cells were treated with 30 μM MG132 for 6 h before harvest. i, j SCFSkp2 ubiquitinated IDH1 in vitro in a cyclin E/CDK2 (i) or cyclin A/CDK2 (j) dependent manner. IB analysis of in vitro ubiquitination assays, in which GST-IDH1-WT and GST-IDH1-T157A were purified from E. Coli and SCFSkp2 E3 ligase was purified from HEK293 cells. k The IDH1-T157A mutant was resistant to Skp2-dependent degradation in cells. IB analysis of WCL derived from HeLa cells transfected with Flag-IDH1-WT or Flag-IDH1-T157A and other indicated constructs.
Fig. 5
Fig. 5. Non-degradable IDH1 is resistant to cell cycle-dependent fluctuation in abundance, and restricts cell proliferation.
a Compared to IDH1-WT, the IDH1-T157A mutant escaped from cell cycle-dependent degradation, thereby becoming stabilized across different cell cycle phases. HeLa cells were infected with HA-IDH1-WT or HA-IDH1-T157A lenti-viruses and selected with hygromycin B (200 μg/mL) for 3 days. The stable cell lines were synchronized by nocodazole blockage for 20 h and released for the indicated time periods, followed by IB analysis with the indicate antibodies. b Compared to IDH1-WT, ectopic expression of the IDH1-T157A mutant significantly reduced the glycolytic peak in S phase. Various cell lines generated in a were synchronized by nocodazole blockage for 20 h and released for the indicated time periods, followed by ECAR measurements with Seahorse XF extracellular flux analyzer. n.s., not significant; *P < 0.05, **P < 0.01. c Compared to IDH1-WT, ectopic expression of the IDH1-T157A mutant was incapable of reducing TCA cycle in S phase. Various cell lines generated in a were synchronized by nocodazole blockage for 20 h and released for the indicated time periods, followed by OCR measurements with Seahorse XF extracellular flux analyzer. n.s., not significant; *P < 0.05, **P < 0.01. d Compared to IDH1-WT, ectopic expression of the IDH1-T157A mutant significantly reduced the glycolytic intermediates level in S phase. Various cell lines generated in a were synchronized and released for the indicated time periods, followed by 13C-glucose labeling for 60 s. The labeled glycolytic intermediates were measured using HPLC-MS. *P < 0.05, **P < 0.01, ***P < 0.001. e IB analysis of the indicated proteins in HeLa stable cell lines. f Compared to IDH1-WT, ectopic expression of the IDH1-T157A mutant suppressed cell growth. g Compared to IDH1-WT, ectopic expression of the IDH1-T157A mutant compromised transformation ability. Representative images showing colony growth or anchorage-independent growth. h, i Quantification of the colony numbers in colony growth (h) or soft agar assay (i). **P < 0.01, ***P < 0.001. j Image of xenograft tumor derived from 22Rv1 cells that expressed either GFP, IDH1-WT or IDH1-T157A mutant. k Quantification of xenograft tumor mass derived from 22Rv1 cells that expressed either GFP, IDH1-WT or IDH1-T157A mutant as in j. **P < 0.01.
Fig. 6
Fig. 6. Skp2 dedicates the metabolic phenotypes of prostate cancer cell lines in part by promoting IDH1 degradation.
a There was an inverse correlation between the protein abundance of Skp2 and IDH1 in a panel of prostate cancer (PrCa) cell lines. IB analysis of C4-2, DU145, LNCaP, PC3, 22Rv1 and VCaP with the indicated antibodies. b ECAR analysis of different PrCa cell lines as listed in a. *P < 0.05, **P < 0.01. c OCR analysis of different PrCa cell lines as listed in a. *P < 0.05, **P < 0.01. d Depletion of endogenous Skp2 in Skp2high cells led to a significant elevation of IDH1 protein abundance. Two Skp2high cells, PC3 and DU145 were infected with pLKO-shSkp2 or shControl lenti-viruses, selected for 3 days, and harvested for IB analysis. e ECAR analysis of PC3 and DU145 with or without depletion of endogenous SKP2. *P < 0.05, **P < 0.01. f OCR analysis of PC3 and DU145 with or without depletion of endogenous SKP2. *P < 0.05. g Enforced ectopic expression of Skp2 in Skp2low cells led to elevated IDH1 degradation. Skp2low cells, LNCaP, C4-2 and 22Rv1 were infected with HA-Skp2 or GFP lenti-viruses, selected by puromycin for 3 days, and harvested for IB analysis. h ECAR analysis of LNCaP, C4-2 and 22Rv1 with or without ectopic expression of Skp2. *P < 0.05. i OCR analysis of LNCaP, C4-2 and 22Rv1 with or without ectopic expression of Skp2. *P < 0.05, **P < 0.01.
Fig. 7
Fig. 7. Skp2 inhibitor represses prostate cancer via shifting cell metabolism from glycolysis to TCA cycle.
a The treatment of Skp2 inhibitor SKPin C1 led to a robust accumulation of IDH1 and IDH2 in cells. 22Rv1 cells were treated with 0, 1, 3, 10, or 30 μM SKPin C1 for 24 h, and then harvested for IB analysis. b SKPin C1 blocked the colony growth of PrCa cells, LNCaP and 22Rv1. LNCaP and 22Rv1 cells were planted in 6-well plate (1500 cell/well), treated with 0.1, 0.3, or 1 μM Skin C1 for 7 days, and transferred to fresh media for another 3 weeks. c Depletion of Skp2 abolished the effect of SKPin C1 on IDH1 and IDH2 abundances. HAP1-Skp2+/+ and HAP1-Skp2–/– cells were treated with the indicated concentrations of SKPin C1 for 24 h, followed by IB analysis of the indicated proteins. d Depletion of Skp2 abolished the effect of SKPin C1 on ECAR. n.s., not significant; **P < 0.01. e Depletion of Skp2 abolished the effect of SKPin C1 on OCR. n.s., not significant; *P < 0.05, **P < 0.01. f Depletion of endogenous IDH1 or IDH2 abolished the effects of SKPin C1 on OCR. HAP1-IDH1–/–, HAP1-IDH2–/– and parental cells were treated with 3 μM SKPin C1 for 24 h, followed by OCR analysis with Seahorse XF 24 analyzer. n.s., not significant; *P < 0.05. g, h Depletion of endogenous Skp2 rendered a metabolic profile of G1 phase, while further depletion of IDH1 resulted in a metabolic profile more similar to S phase as indicated by ECAR (g) and OCR (h). n.s., not significant; *P < 0.05, **P < 0.01. i Schematic illustration of the working model for SKPin C1 in regulating cell cycle and metabolic shift via targeting p27 and IDH1/2, respectively.

References

    1. Warburg O. On the origin of cancer cells. Science. 1956;123:309–314. doi: 10.1126/science.123.3191.309. - DOI - PubMed
    1. Vander Heiden MG, Cantley LC, Thompson CB. Understanding the Warburg effect: the metabolic requirements of cell proliferation. Science. 2009;324:1029–1033. doi: 10.1126/science.1160809. - DOI - PMC - PubMed
    1. Bensaad K, et al. TIGAR, a p53-inducible regulator of glycolysis and apoptosis. Cell. 2006;126:107–120. doi: 10.1016/j.cell.2006.05.036. - DOI - PubMed
    1. Gordan JD, Thompson CB, Simon MC. HIF and c-Myc: sibling rivals for control of cancer cell metabolism and proliferation. Cancer Cell. 2007;12:108–113. doi: 10.1016/j.ccr.2007.07.006. - DOI - PMC - PubMed
    1. Manning BD, Cantley LC. AKT/PKB signaling: navigating downstream. Cell. 2007;129:1261–1274. doi: 10.1016/j.cell.2007.06.009. - DOI - PMC - PubMed

Publication types

MeSH terms