. 2020 Jul 15;10(1):11680.
doi: 10.1038/s41598-020-66624-3.

Blood pressure-lowering effects of a Bowman-Birk inhibitor and its derived peptides in normotensive and hypertensive rats

Affiliations

Blood pressure-lowering effects of a Bowman-Birk inhibitor and its derived peptides in normotensive and hypertensive rats

Maria Alzira Garcia de Freitas et al. Sci Rep. .

Abstract

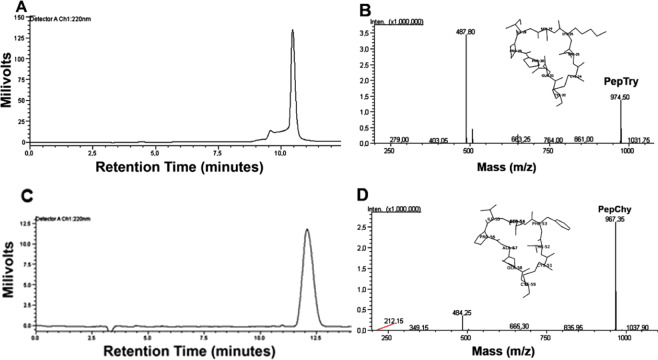
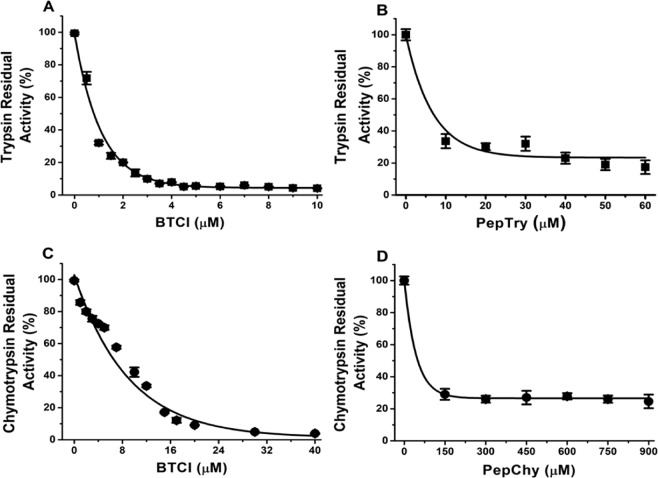
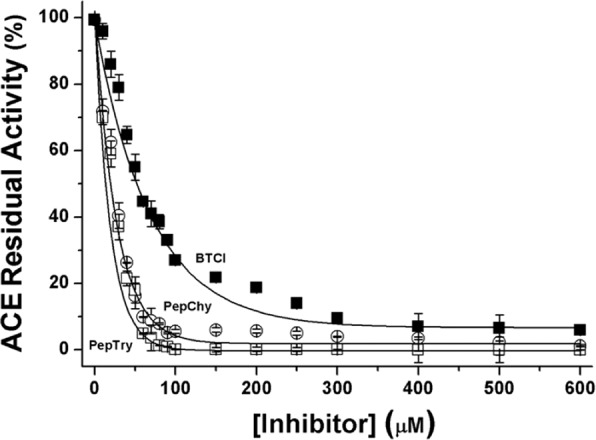
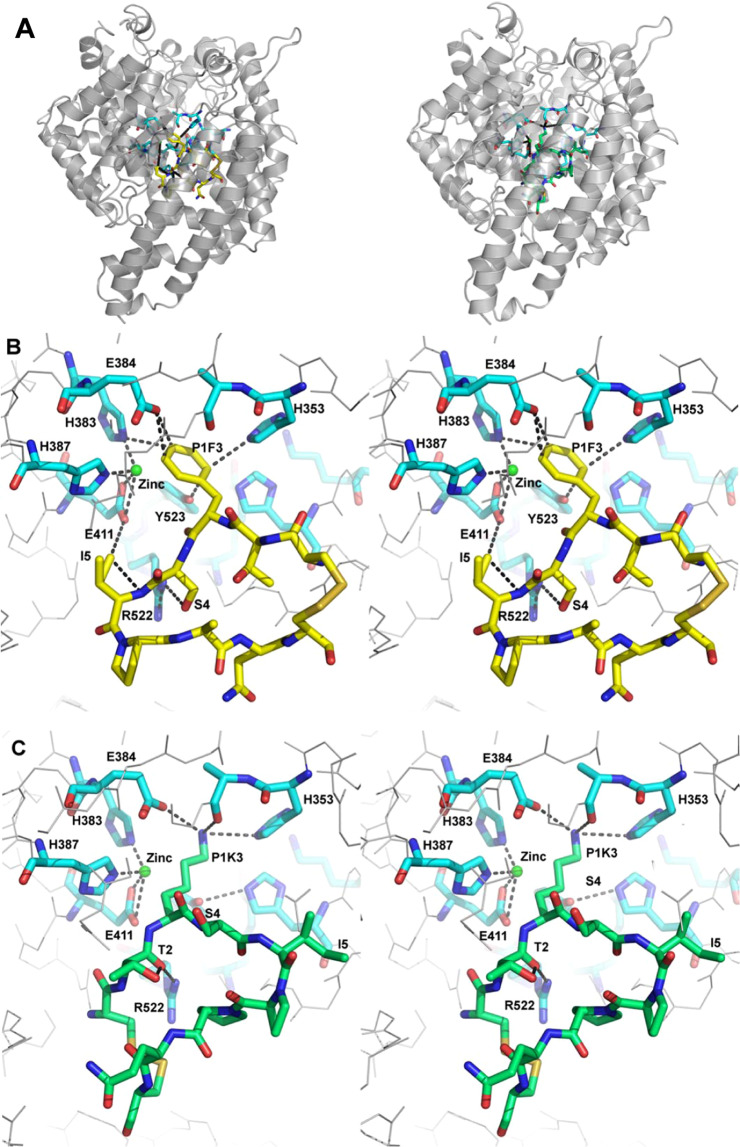
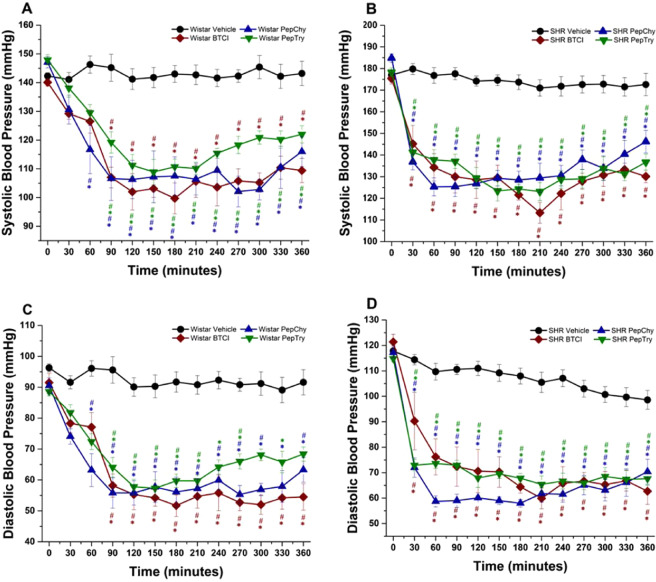
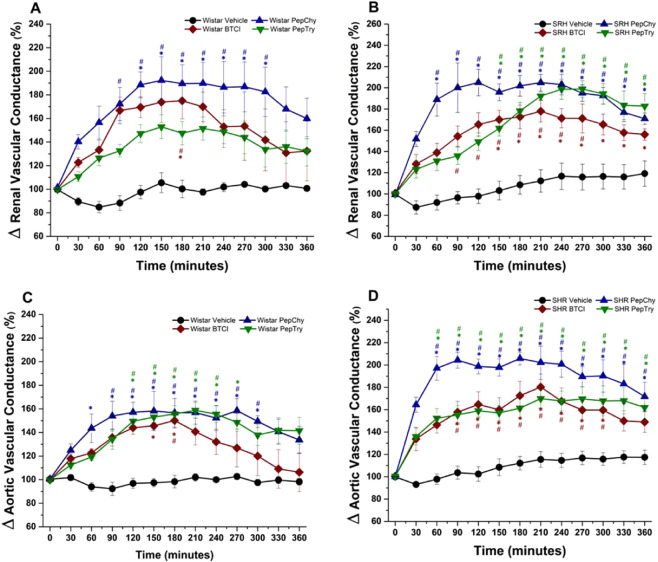
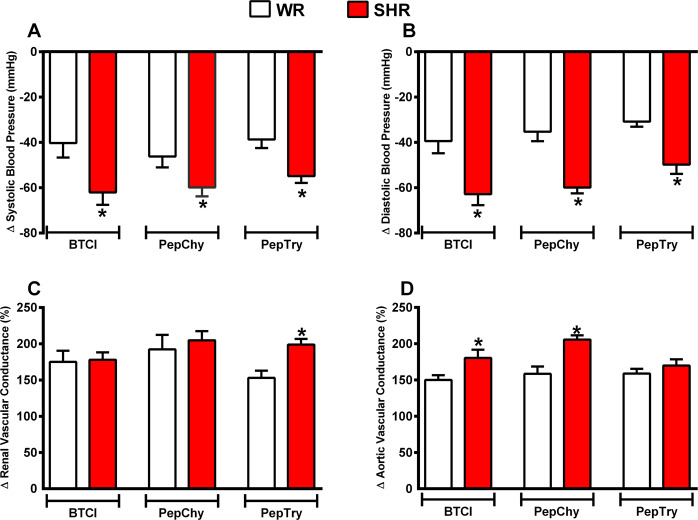
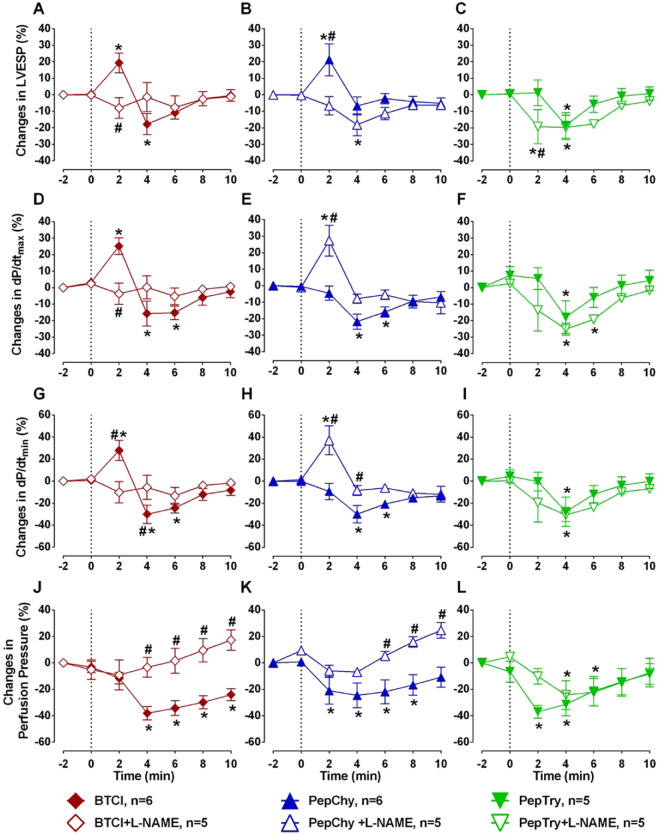
Bioactive plant peptides have received considerable interest as potential antihypertensive agents with potentially fewer side effects than antihypertensive drugs. Here, the blood pressure-lowering effects of the Bowman-Birk protease inhibitor, BTCI, and its derived peptides, PepChy and PepTry, were investigated using normotensive (Wistar-WR) and spontaneously hypertensive rats (SHR). BTCI inhibited the proteases trypsin and chymotrypsin, respectively, at 6 µM and 40 µM, a 10-fold greater inhibition than observed with PepTry (60 µM) and PepChy (400 µM). These molecules also inhibited angiotensin converting enzyme (ACE) with IC50 values of 54.6 ± 2.9; 24.7 ± 1.1; and 24.4 ± 1.1 µM, respectively, occluding its catalytic site, as indicated by molecular docking simulation, mainly for PepChy and PepTry. Gavage administration of BTCI and the peptides promoted a decrease of systolic and diastolic blood pressure and an increase of renal and aortic vascular conductance. These effects were more expressive in SHR than in WR. Additionally, BTCI, PepChy and PepTry promoted coronary vasodilation and negative inotropic effects in isolated perfused hearts. The nitric oxide synthase inhibitor blunted the BTCI and PepChy, with no cardiac effects on PepTry. The findings of this study indicate a therapeutic potential of BTCI and its related peptides in the treatment of hypertension.


Conflict of interest statement

The authors declare no competing interests.

Figures

Figure 1
Figure 1
Purification and purity of synthetic peptides PepTry and PepChy. (A,C) Reverse-phase chromatography of PepTry and PepChy, respectively, on a C18 Shim-pak VP-ODS column using a linear gradient (5–95%) of acetonitrile. PepTry and PepChy were eluted at 10.5 minutes and 12.0 minutes and 50% and 55% ACN, respectively. (B,D) EIS-MS spectrometry analysis of PepTry (molecular mass of 974.5 Da) and PepChy (molecular mass of 967.35 Da), respectively. In sets: structures of PepTry and PepChy from crystal structure of BTCI (PDB code 2G81).
Figure 2
Figure 2
Inhibitory activities of BTCI and its derived peptides. (A) Residual activity of trypsin in the presence of increasing concentrations of BTCI and (B) PepTry. (C) Residual activity of chymotrypsin in the presence of increasing concentrations of BTCI and PepChy (D). The inhibitory assay showed that PepTry and PepChy required a concentration approximately six and eight times higher than BTCI in order to result in total inhibition of trypsin and chymotrypsin, respectively.
Figure 3
Figure 3
Inhibitory activities of BTCI (■—■), PepChy (ο—ο) and PepTry (□—□) against angiotensin converting enzyme (ACE). All molecules present inhibition closest to 95%. IC50 values were estimated for BTCI, PepChy and PepTry at 54.6 ± 2.9 µM, 24.7 ± 1.1 µM, and 24.4 ± 1.1 µM, respectively.
Figure 4
Figure 4
Tridimensional structures of the ACE-PepChy and ACE-PepTry complexes obtained by docking. (A) ACE (gray cartoon) in complex with PepChy (yellow sticks) and PepTry (green sticks). (B) Stereo view (cross-eyed) of ACE active site (blue) with bound PepChy (yellow). Interacting residues of the ACE active site and reactive site of PepChy (P1F3) are labelled. Atoms are coloured as red for oxygen, blue for nitrogen and green sphere for zinc ion. Hydrogen bonds at the complex interface are shown as dotted lines. (C) Stereo view (cross-eyed) of ACE active site (blue) with bound PepTry (green). Interacting residues of the ACE active site and reactive site of PepTry (P1K3) are labelled. Atoms are coloured as red for oxygen, blue for nitrogen and green sphere for zinc ion. Hydrogen bonds at the complex interface are shown as dotted lines. The crystallographic structures used by docking procedure were: ACE PDB code 1O8A, PepTry and PepChy from BTCI (PDB code 2G81).
Figure 5
Figure 5
Hemodynamic effects in WR and SHR induced by gavage administration of BTCI (30.0 mg·kg−1), PepTry (3.3 mg·kg−1) and PepChy (3.3 mg·kg−1) or Vehicle (NaCl 0.9%), in anesthetized rats. Systolic blood pressure in (A) Wistar and (B) SHR; Diastolic blood pressure in (C) Wistar and (D) SHR. The results are expressed as the mean ± SEM. *p < 0.05 compared to vehicle; p < 0.05 compared to basal time.
Figure 6
Figure 6
Cardiovascular responses induced by gavage administration of BTCI (30.0 mg·kg−1), PepTry (3.3 mg·kg−1) and PepChy (3.3 mg·kg−1) or Vehicle (NaCl 0.9%), in anesthetized rats. Renal vascular conductance in (A) Wistar and (B) SHR; Aortic vascular conductance in (C) Wistar and (D) SHR. The results are expressed as the mean ± SEM. *p < 0.05 compared to vehicle; #p < 0.05 compared to basal time.
Figure 7
Figure 7
Maximum response induced by gavage administration of BTCI (30.0 mg·kg−1), PepTry (3.3 mg·kg−1) and PepChy (3.3 mg·kg−1) in anesthetized WR rats (n = 6) and SHR (n = 6). (A) Systolic blood pressure; (B) Diastolic blood pressure; (C) Renal vascular conductance; (D) Aortic vascular conductance. The results are expressed as the mean ± SEM. *p < 0.05 compared to WR..
Figure 8
Figure 8
Effects of BTCI, PepChy and PepTry in isolated rat hearts. Effects of the PepChy, BTCI and PepTry in the (A–C) Left ventricular end-systolic pressure (LVESP), (D–F) Maximal Rate of Left Ventricular Pressure Rise (dP/dtmax), (G–I) Maximal Rate of Left Ventricular Pressure Decline (dP/dtmin), and (J–L) Perfusion Pressure. The dotted line represents the beginning of peptide infusion. Data are reported as mean ± SE. *p < 0.05 vs. baseline, #p < 0.05 vs. between time points. Two-way ANOVA was followed by Sidak’s multiple comparison post-test.

References

    1. Whitworth JA. 2003 World Health Organization (WHO)/International Society of Hypertension (ISH) statement on management of hypertension. Journal of hypertension. 2003;21:1983–1992. doi: 10.1097/00004872-200311000-00002. - DOI - PubMed
    1. Roth GA, et al. Global, Regional, and National Burden of Cardiovascular Diseases for 10 Causes, 1990 to 2015. Journal of the American College of Cardiology. 2017;70:1–25. doi: 10.1016/j.jacc.2017.04.052. - DOI - PMC - PubMed
    1. Bromfield S, Muntner P. High blood pressure: the leading global burden of disease risk factor and the need for worldwide prevention programs. Current hypertension reports. 2013;15:134–136. doi: 10.1007/s11906-013-0340-9. - DOI - PMC - PubMed
    1. Liu, X. Z. et al. Association between cardiovascular risk factors and stage 1 hypertension defined by the 2017 ACC/AHA guidelines. Clinical and experimental hypertension (New York, N.Y.: 1993), 1–7, 10.1080/10641963.2020.1714639 (2020). - PubMed
    1. Bernatova. Endothelial dysfunction in experimental models of arterial hypertension: cause or consequence?. Biomed Res. Int598271 (2014). - PMC - PubMed

Publication types

MeSH terms