

Quantifying greenhouse gas emissions from global aquaculture
- PMID: 32669630
- PMCID: PMC7363927
- DOI: 10.1038/s41598-020-68231-8
Quantifying greenhouse gas emissions from global aquaculture
Abstract
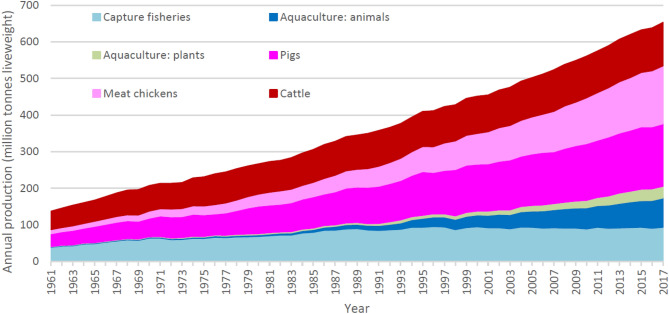
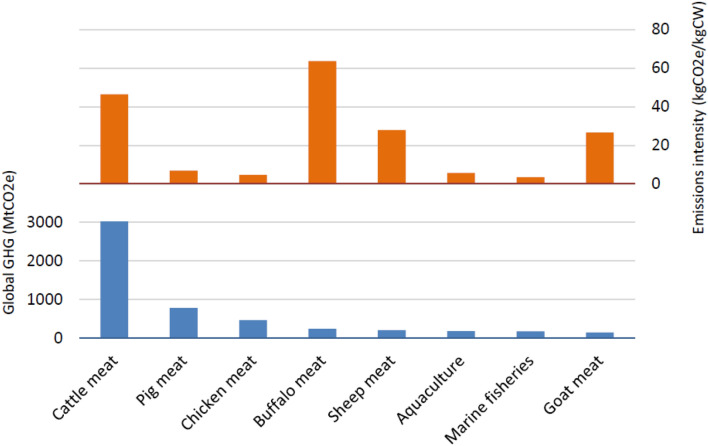
Global aquaculture makes an important contribution to food security directly (by increasing food availability and accessibility) and indirectly (as a driver of economic development). In order to enable sustainable expansion of aquaculture, we need to understand aquaculture's contribution to global greenhouse gas (GHG) emissions and how it can be mitigated. This study quantifies the global GHG emissions from aquaculture (excluding the farming of aquatic plants), with a focus on using modern, commercial feed formulations for the main species groups and geographic regions. Here we show that global aquaculture accounted for approximately 0.49% of anthropogenic GHG emissions in 2017, which is similar in magnitude to the emissions from sheep production. The modest emissions reflect the low emissions intensity of aquaculture, compared to terrestrial livestock (in particular cattle, sheep and goats), which is due largely to the absence of enteric CH4 in aquaculture, combined with the high fertility and low feed conversion ratios of finfish and shellfish.
Conflict of interest statement
The authors declare no competing interests.
Figures
References
-
- FAO. World Aquaculture 2015: A Brief Overview 34 (FAO Fisheries and Aquaculture Circular No. 1140, 2017).
-
- UNEP . The Emissions Gap Report 2018. Nairobi: United Nations Environment Programme; 2018.
-
- FAO. Global Livestock Environmental Assessment Model (GLEAM) 109 (FAO, Rome, 2017) www.fao.org/gleam/en/. - PubMed
-
- Parker RWR, et al. Fuel use and greenhouse gas emissions of world fisheries. Nat. Clim. Change. 2018;8:333–337. doi: 10.1038/s41558-018-0117-x. - DOI
Publication types
LinkOut - more resources
Full Text Sources
