. 2020 Jul 15;3(1):379.
doi: 10.1038/s42003-020-1106-y.

Rapid detection of microbiota cell type diversity using machine-learned classification of flow cytometry data

Affiliations

Rapid detection of microbiota cell type diversity using machine-learned classification of flow cytometry data

Birge D Özel Duygan et al. Commun Biol. .

Abstract

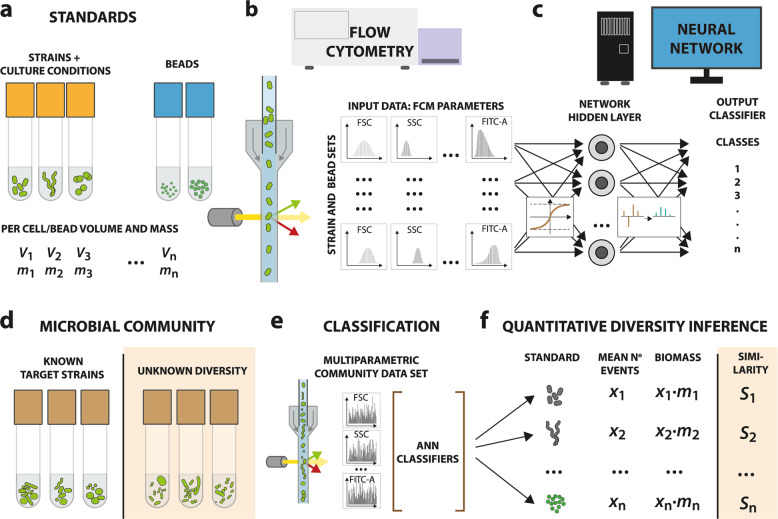
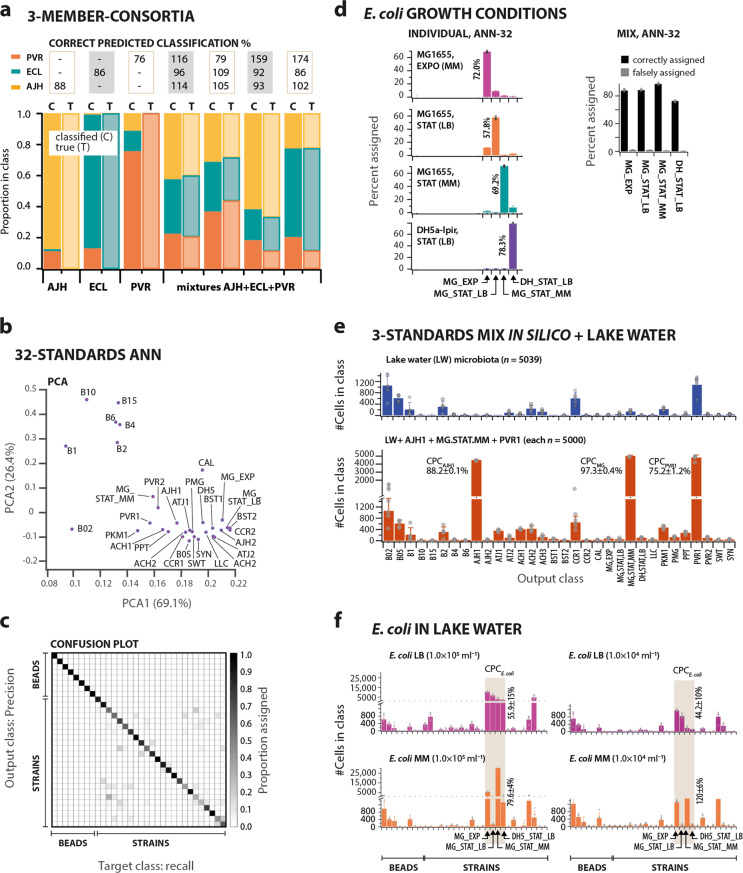
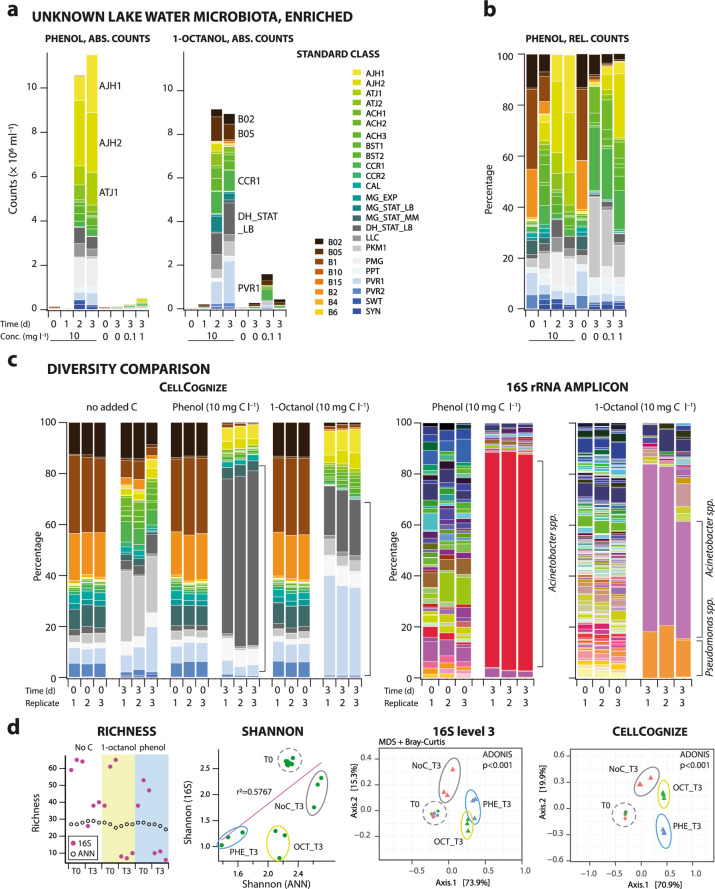
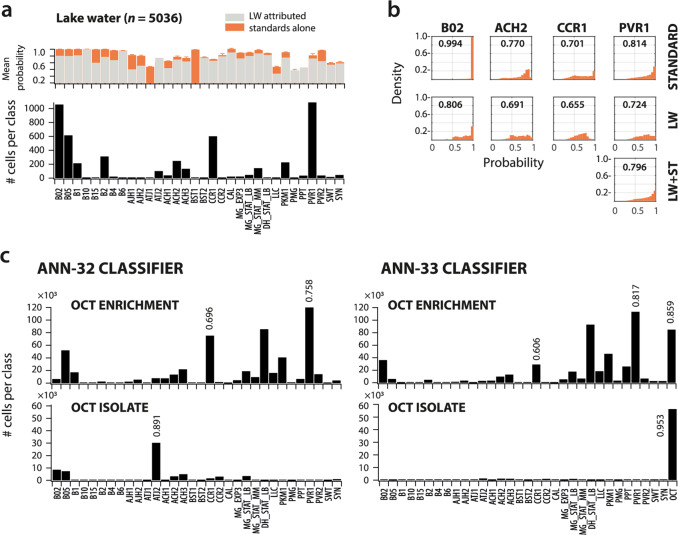
The study of complex microbial communities typically entails high-throughput sequencing and downstream bioinformatics analyses. Here we expand and accelerate microbiota analysis by enabling cell type diversity quantification from multidimensional flow cytometry data using a supervised machine learning algorithm of standard cell type recognition (CellCognize). As a proof-of-concept, we trained neural networks with 32 microbial cell and bead standards. The resulting classifiers were extensively validated in silico on known microbiota, showing on average 80% prediction accuracy. Furthermore, the classifiers could detect shifts in microbial communities of unknown composition upon chemical amendment, comparable to results from 16S-rRNA-amplicon analysis. CellCognize was also able to quantify population growth and estimate total community biomass productivity, providing estimates similar to those from 14C-substrate incorporation. CellCognize complements current sequencing-based methods by enabling rapid routine cell diversity analysis. The pipeline is suitable to optimize cell recognition for recurring microbiota types, such as in human health or engineered systems.


Conflict of interest statement

The authors declare no competing financial interests but the following competing non-financial interests: B.D.Ö.D. is the inventor on a patent application by the University of Lausanne that covers the CellCognize concept.

Figures

Fig. 1
Fig. 1. CellCognize: a flow cytometry (FCM)— supervised artificial neural network (ANN) pipeline for classification of microbial cell diversity and physiology.
Representative stained cell and bead standards with known volume and mass (a) are analyzed by FCM to capture multidimensional optical and shape characteristics (b). Note that FITC here represents the channel to capture the SYBR Green I fluorescence of cell staining. Multiparametric data of each of the strain and bead standards, separated where they consist of recognizable subpopulations, are used as input for training, testing and validating the ANN, producing the classifiers (c). FCM data from stained target untrained known or unknown microbial communities (d) are assigned to the strain and bead output classes using the ANN classifiers (e). The diversity attribution can subsequently be used to estimate individual population densities and their biomass, and, in the case of unknown communities, to calculate similarities to the used standards (f).
Fig. 2
Fig. 2. CellCognize performance and analysis of microbiota with known members.
a Classification of a three-membered bacterial community composed of Acinetobacter johnsonii (AJH), Escherichia coli MG1655 (ECL), and Pseudomonas veronii (PVR), using a five-class ANN classifier. Bars show the means of CellCognize-inferred strain abundance for in vivo grown pure cultures and mixtures compared to their true abundance, with correct predicted classification per strain indicated above. b Principal component analysis of multiparametric variation among the 24 defined cell and 8 bead standards (7 FCM parameters; 20,000 events for each), and the confusion matrix (c) for the 32-standard ANN classifiers showing the mean precision (rows) versus recall (columns), represented as gray-level, according to the scale bar on the right. d Correct prediction classification of E. coli MG1655 or DH5α-λpir cultures grown to exponential (EXPO) or stationary phase (STAT) in M9-CAA (MM) medium or in Luria broth (LB), individually (left, n = 20,000 cells) or as an in silico mixture (right, n = 5000 cells each, randomly subsampled). Bar plots show the mean class attribution ± one SD and together with the correct predicted classification of E. coli, from five independent ANN-32 classifiers. e Predicted classification (absolute cell counts ± one SD) from the five 32-standard ANN classifiers for cells from a Lake Geneva microbial community (blue bars, n  = 5039) or for the same community in silico mixed with n = 5000 cells each of the standards AJH1, MG_STAT_MM and PVR1 (dark orange bars). Correct predicted classifications (CPC) were calculated as the mean percentage of each standard attributed to its own class. f Predicted classification (mean of absolute cell counts ± one SD, five 32-standard ANN classifiers) of triplicate FCM data of in vivo filtered (0.2–40 µm) Lake Geneva microbiota mixed with 1.0 × 104 or 1.0 × 105 cells ml−1 of E. coli strain MG1655 grown on LB or M9-CAA medium (MM) to stationary phase. Correct predicted classifications (CPC) were calculated as the mean number (±one SD) of cells assigned to the four E. coli classes as a percentage of the expected added number.
Fig. 3
Fig. 3. Diversity analysis of an unknown microbial community using CellCognize.
a Inferred mean class cell densities from the five 32-standard classifiers (absolute counts, ABS.) of a size-filtered (0.2–40 µm), resuspended Lake Geneva water microbial community over the course of three days amended with 0.1, 1 or 10 mg C l−1 phenol or 1-octanol, compared to a zero added carbon control. Bars show individual biological replicates, with data merged from two technical replicates. b Proportional cell counts (REL.) for the phenol-amended communities shown in a. c Comparison of community diversity inferred using CellCognize and taxonomic diversity estimated from 16 S rRNA gene amplicon data (shown as proportions of 20,000 normalized cleaned sequence reads, given without color scale) for communities amended with 10 mg C l–1 phenol or 1-octanol. d Diversity measures of communities shown in c: richness (16S: class level; CellCognize: assigned classes >0.05%) initially (T0) and after three days incubation (T3), Shannon index and Multidimensional scaling plot (MDS), based on calculated Bray–Curtis similarities. Symbols represent individual replicate diversities, circumscribed by ellipses to indicate similar treatments.
Fig. 4
Fig. 4. Similarity measures of cells attributed to CellCognize classes.
a Class attribution (absolute cell counts) from a single 32-standard ANN classifier for in vivo filtered (0.2–40 µm) n = 5036 cells from a Lake Geneva microbial community (black bars), with their corresponding mean probability of assignment (gray bars, LW attributed). In background (orange bars), mean probabilities of assignment (±one SD) of each of the standards within an in silico mixture of all FCM standard datasets (subsampled to n = 5000 cells each, five 32-standard ANN classifiers). b Distributions of classification probabilities for four classes that were attributed in high numbers within the lake water community in the classifier results of a (i.e., B02, ACH2, CCR1 and PVR1) for each standard individually, for lake water (LW), or, in one case, of LW in silico mixed with n =  5000 cells of the PVR1 standard. Values within panels indicate the mean probability of the shown distribution, and correspond to the value plotted in a. c Mean class attribution (absolute cell numbers) of the lake water enriched community on 1-octanol (n = 536,783 cells), and of the pure culture isolate (OCT, n = 63,824 cells) derived from this enrichment grown on 1-octanol, both after three days of incubation, for one of the ANN-32 classifiers and for a new classifier that was trained using a dataset that in addition included FCM data from the OCT isolate itself (ANN-33). Numbers on the bars indicate the mean probability of class attribution. Image display calculations are detailed in “Supplementary Methods”.

References

    1. Kau AL, Ahern PP, Griffin NW, Goodman AL, Gordon JI. Human nutrition, the gut microbiome and the immune system. Nature. 2011;474:327–336. doi: 10.1038/nature10213. - DOI - PMC - PubMed
    1. Kwong WK, et al. Dynamic microbiome evolution in social bees. Sci. Adv. 2017;3:e1600513. doi: 10.1126/sciadv.1600513. - DOI - PMC - PubMed
    1. Mendes R, et al. Deciphering the rhizosphere microbiome for disease-suppressive bacteria. Science. 2011;332:1097–1100. doi: 10.1126/science.1203980. - DOI - PubMed
    1. Fierer N. Embracing the unknown: disentangling the complexities of the soil microbiome. Nat. Rev. Microbiol. 2017;15:579–590. doi: 10.1038/nrmicro.2017.87. - DOI - PubMed
    1. Zuniga C, Zaramela L, Zengler K. Elucidation of complexity and prediction of interactions in microbial communities. Micro. Biotechnol. 2017;10:1500–1522. doi: 10.1111/1751-7915.12855. - DOI - PMC - PubMed

Publication types

Substances