. 2020 Jul;583(7818):825-829.
doi: 10.1038/s41586-020-2485-4. Epub 2020 Jul 15.

Temperature-dependent growth contributes to long-term cold sensing

Affiliations

Temperature-dependent growth contributes to long-term cold sensing

Yusheng Zhao et al. Nature. 2020 Jul.

Erratum in

Abstract

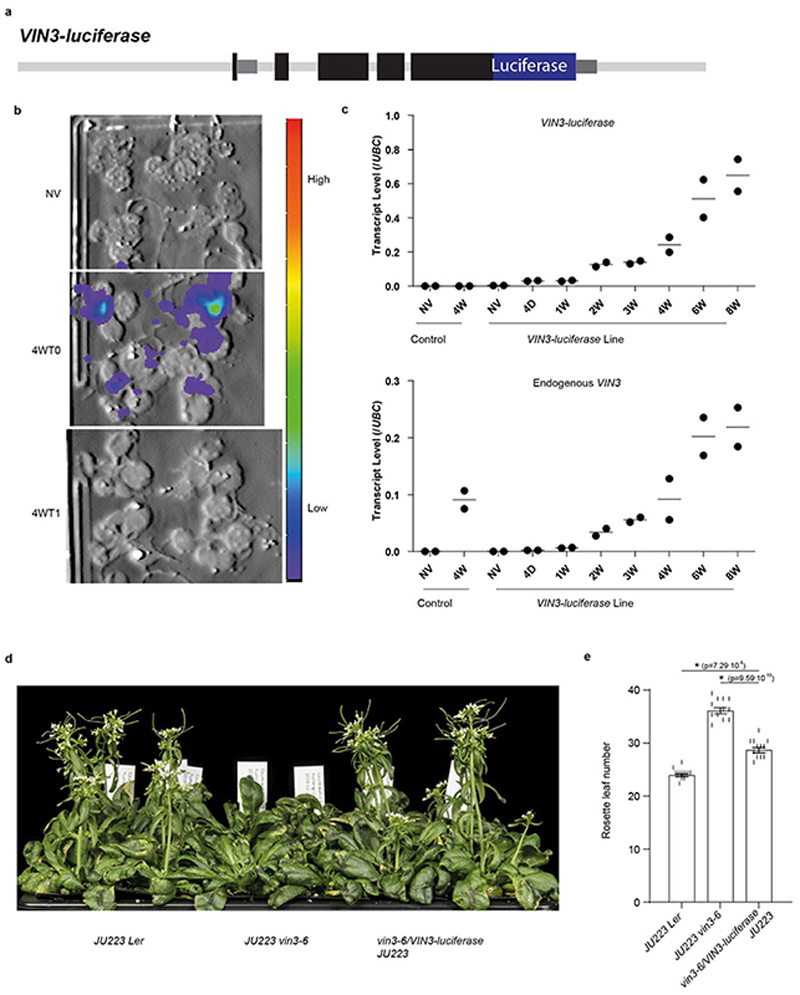
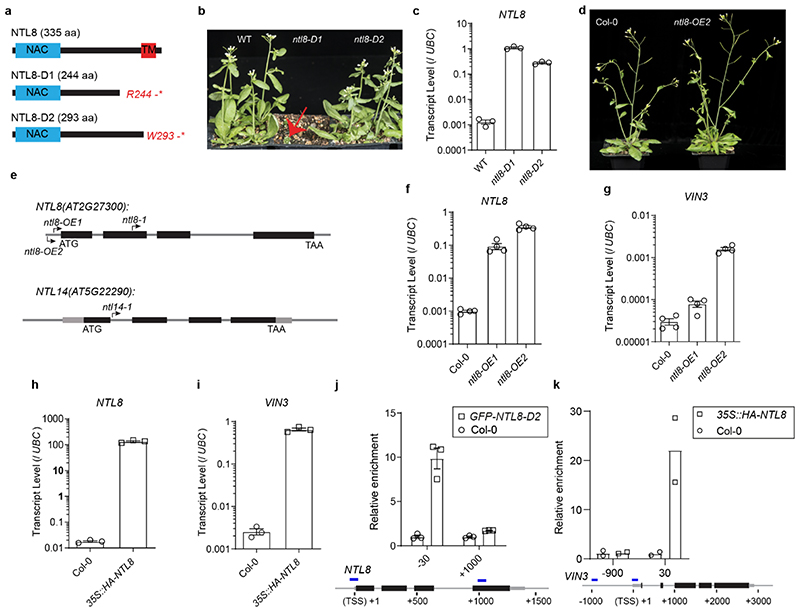
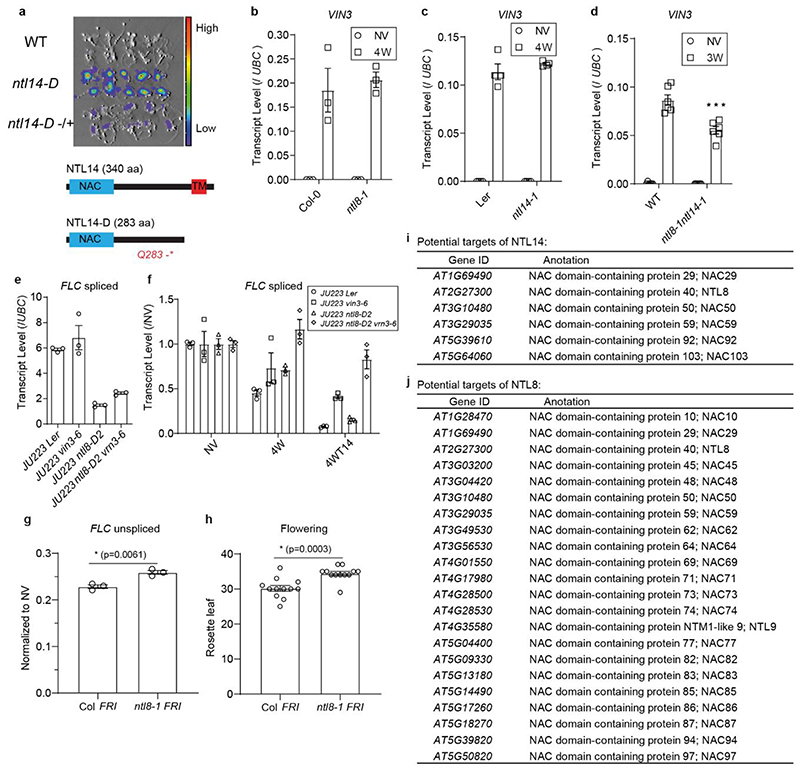
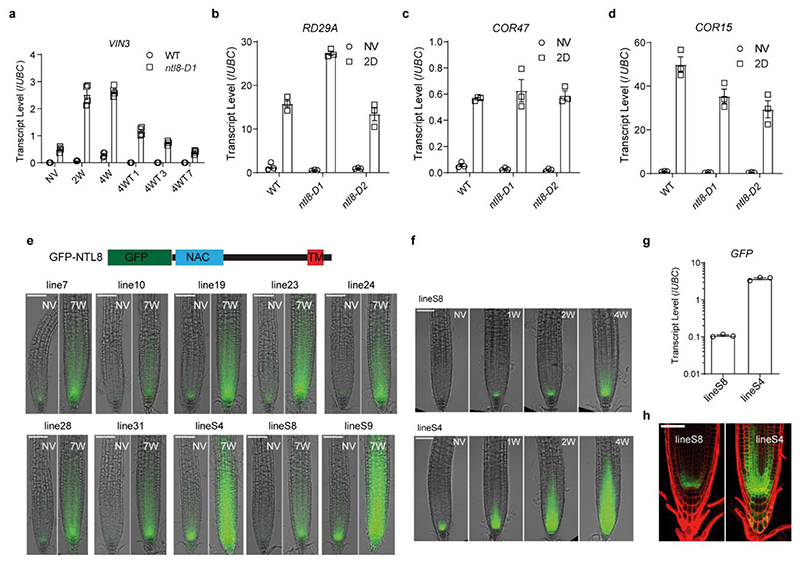
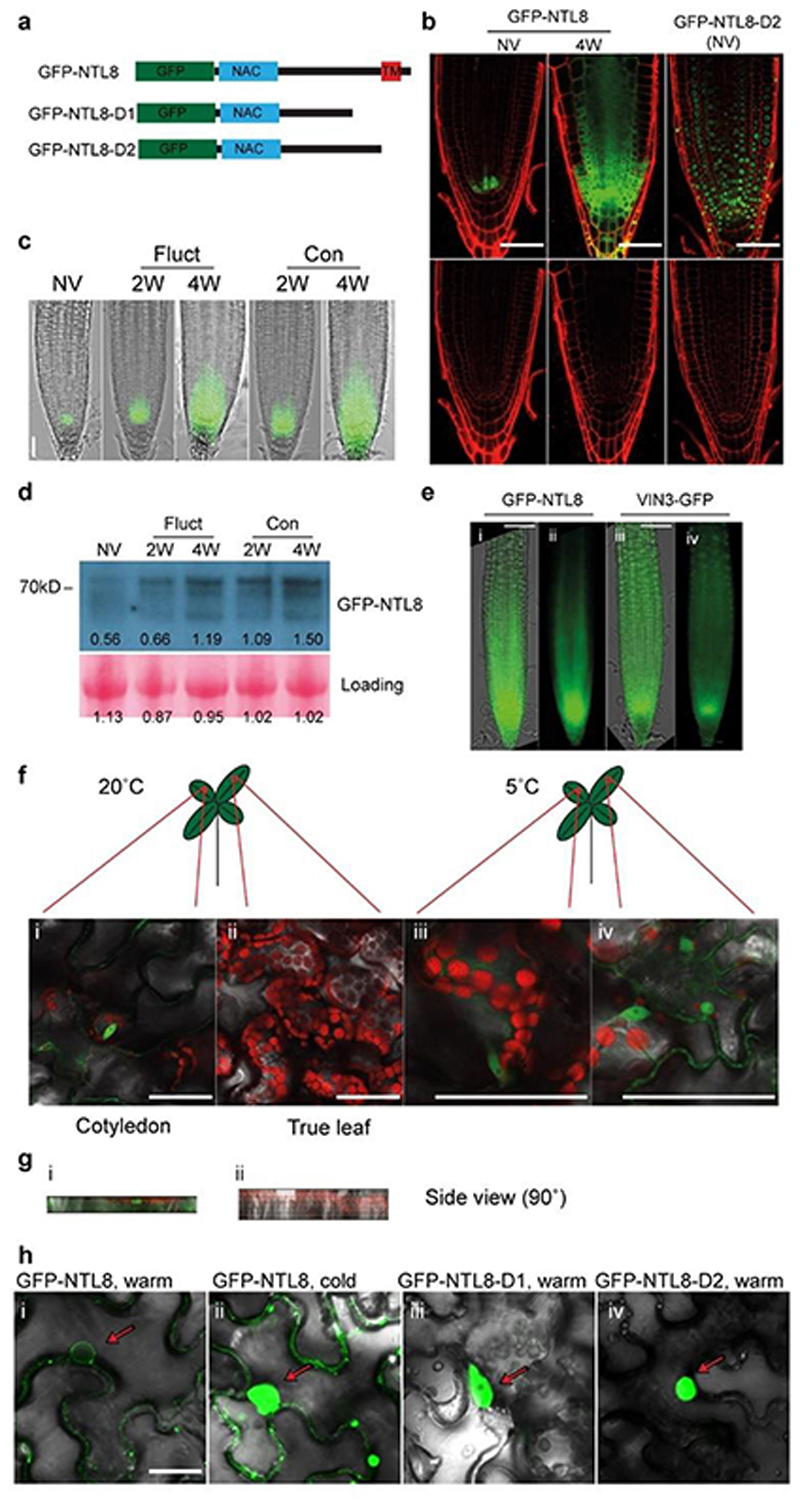
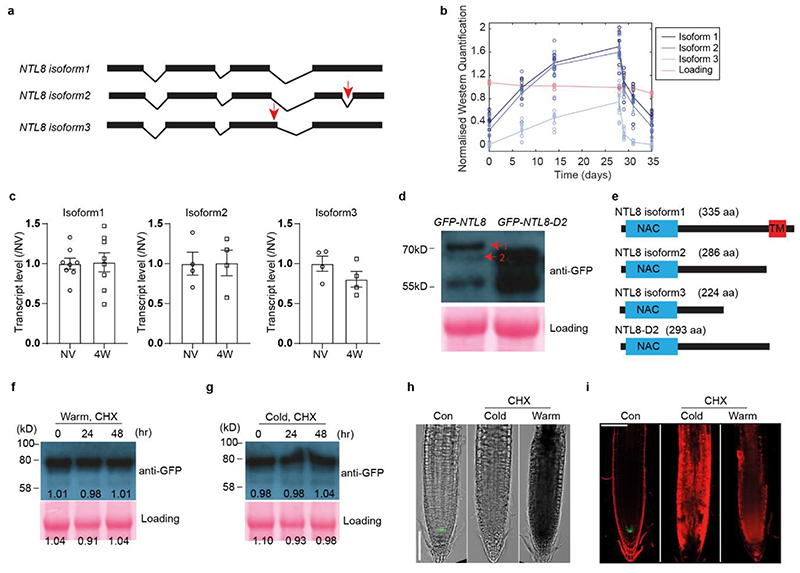
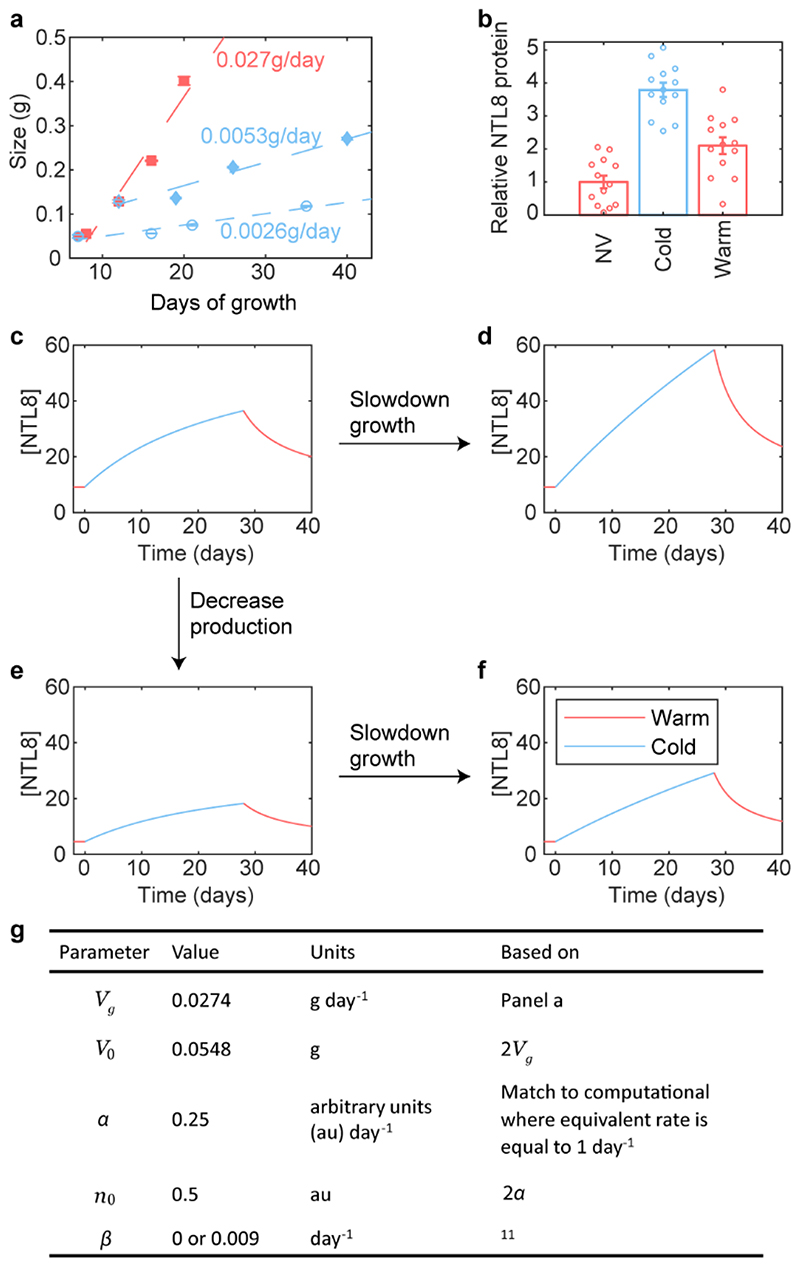
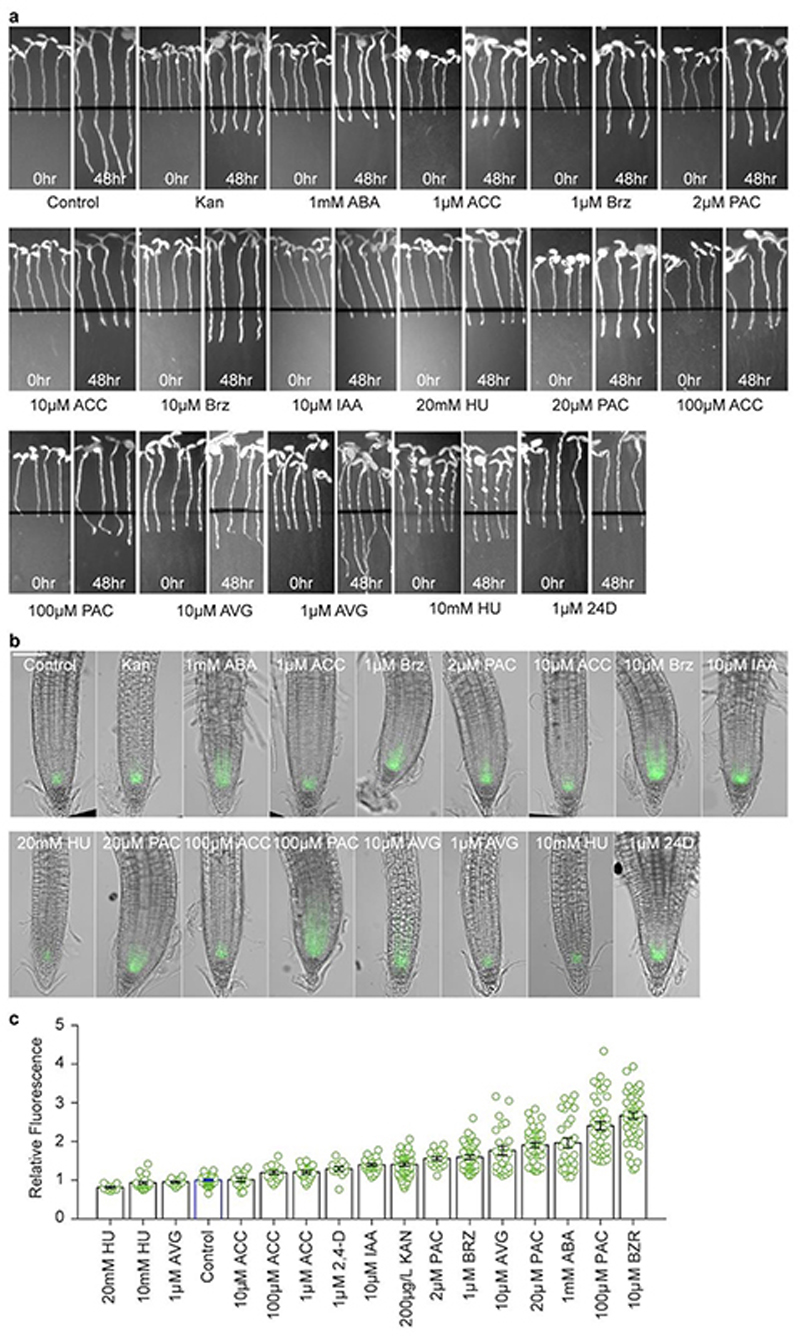
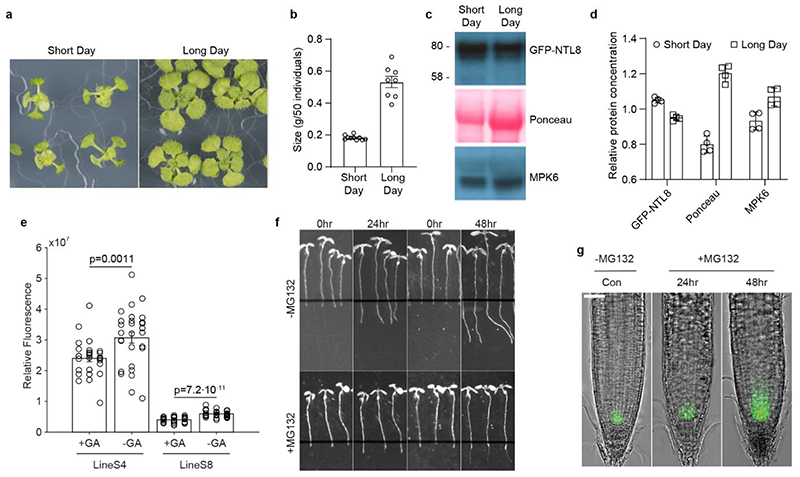
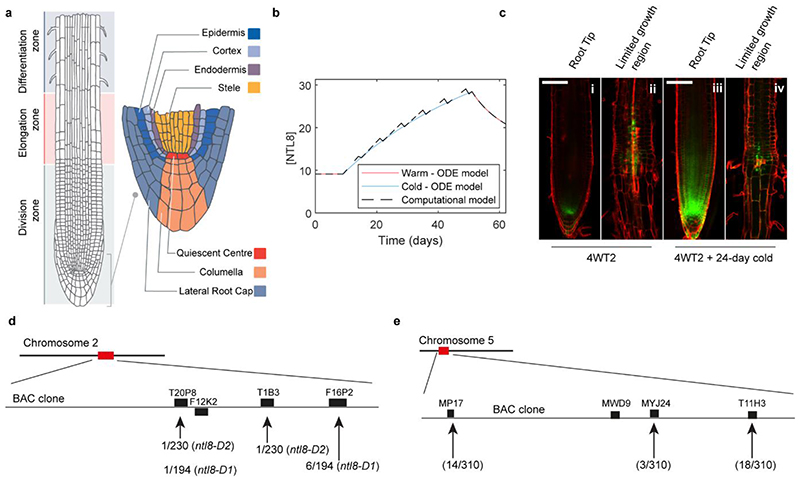
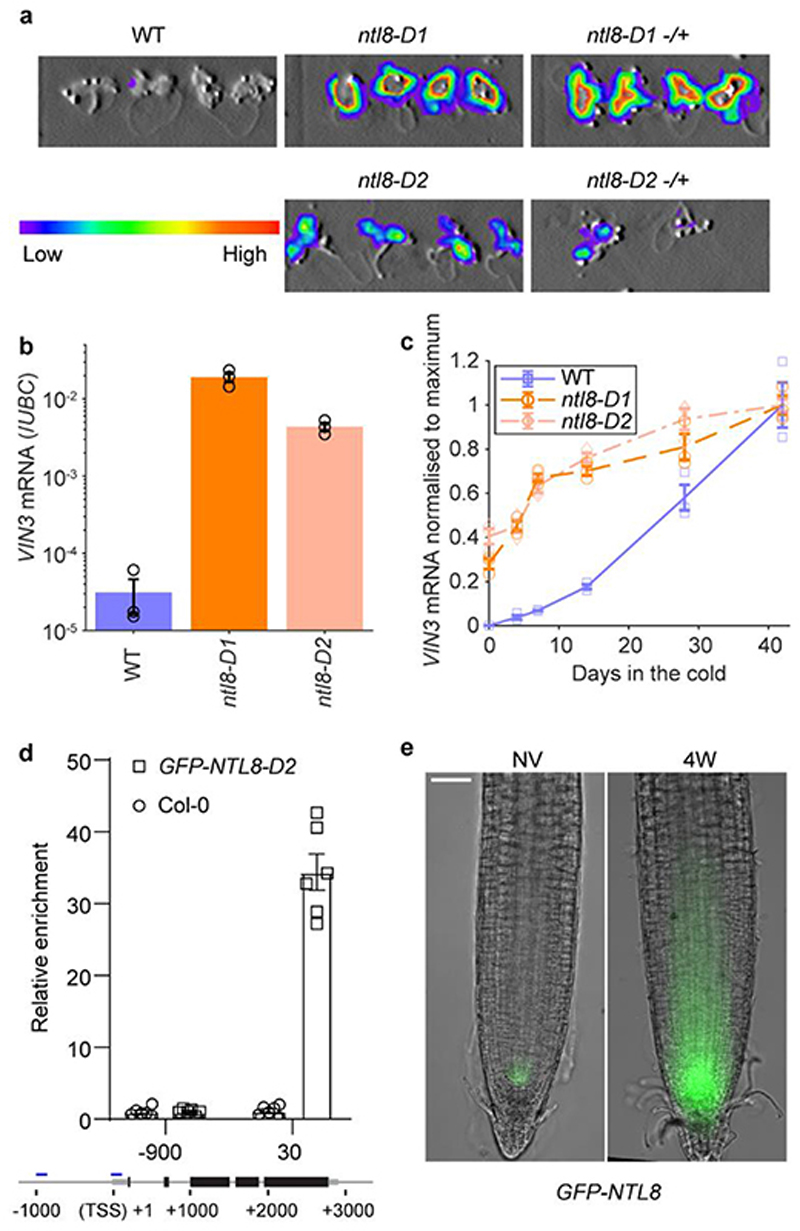
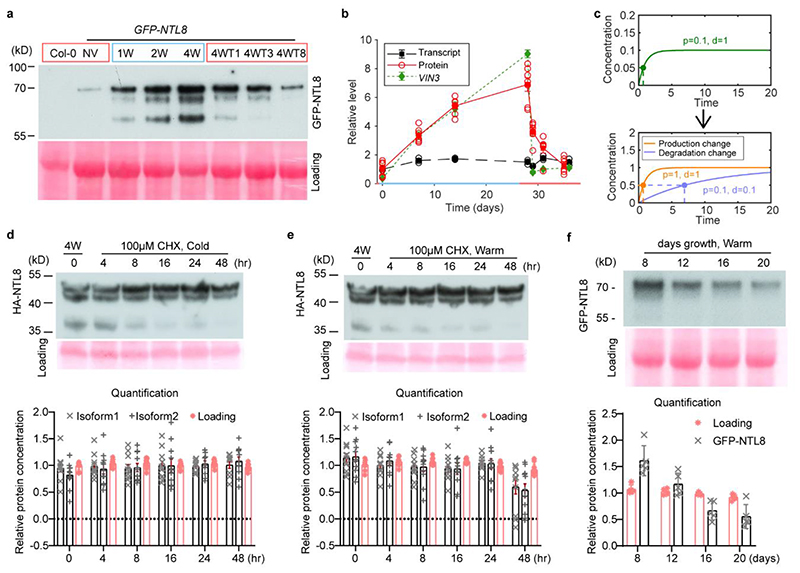
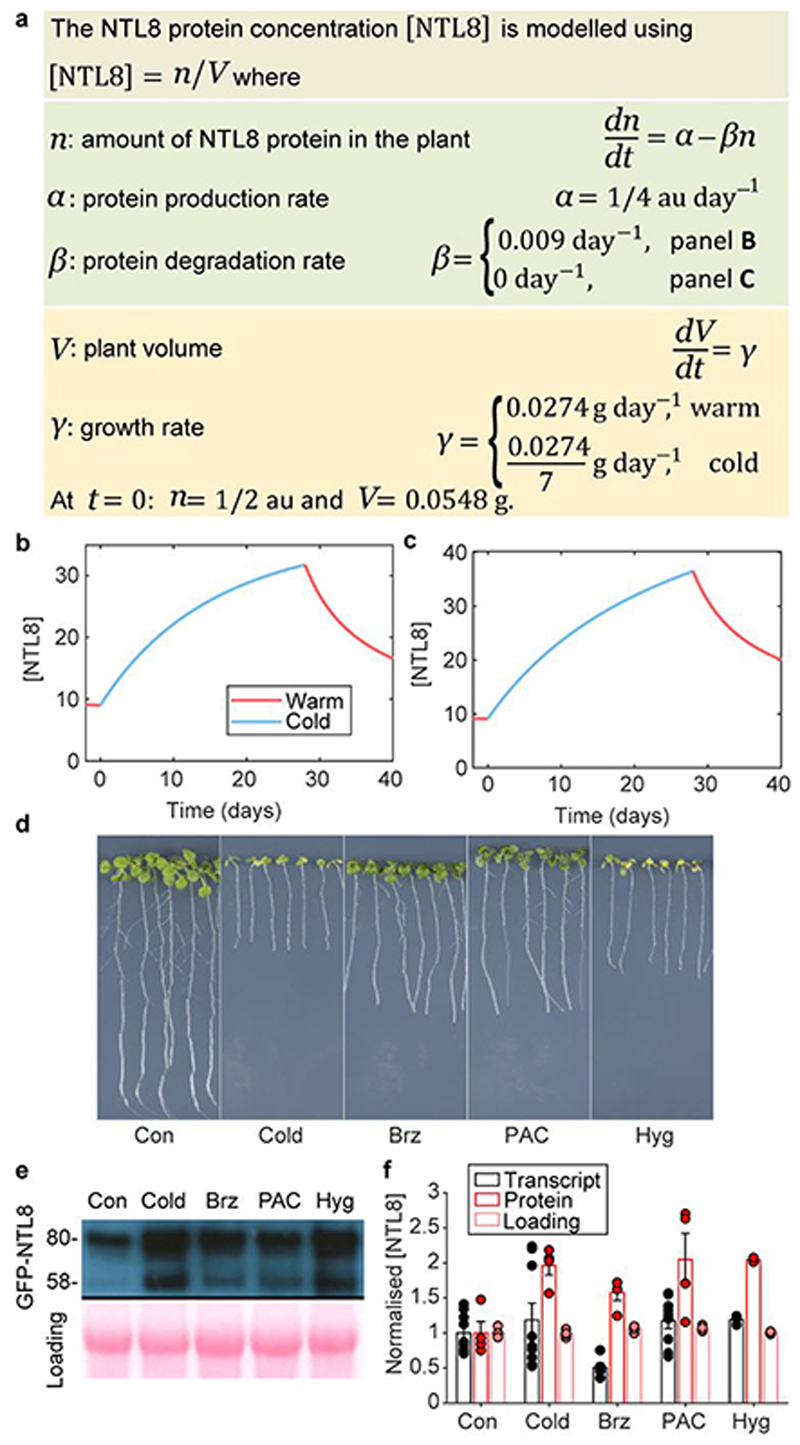
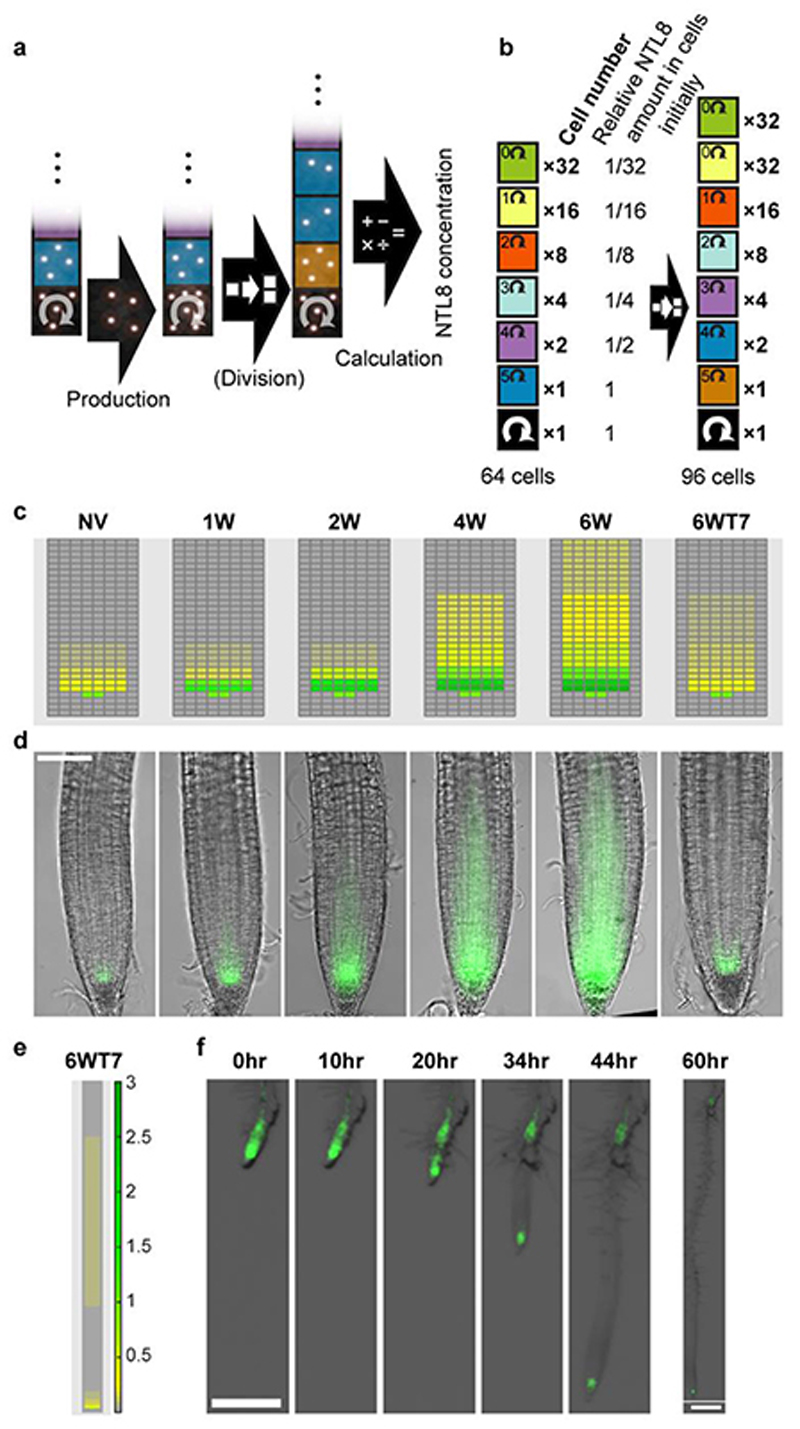
Temperature is a key factor in the growth and development of all organisms1,2. Plants have to interpret temperature fluctuations, over hourly to monthly timescales, to align their growth and development with the seasons. Much is known about how plants respond to acute thermal stresses3,4, but the mechanisms that integrate long-term temperature exposure remain unknown. The slow, winter-long upregulation of VERNALIZATION INSENSITIVE 3 (VIN3)5-7, a PHD protein that functions with Polycomb repressive complex 2 to epigenetically silence FLOWERING LOCUS C (FLC) during vernalization, is central to plants interpreting winter progression5,6,8-11. Here, by a forward genetic screen, we identify two dominant mutations of the transcription factor NTL8 that constitutively activate VIN3 expression and alter the slow VIN3 cold induction profile. In the wild type, the NTL8 protein accumulates slowly in the cold, and directly upregulates VIN3 transcription. Through combining computational simulation and experimental validation, we show that a major contributor to this slow accumulation is reduced NTL8 dilution due to slow growth at low temperatures. Temperature-dependent growth is thus exploited through protein dilution to provide the long-term thermosensory information for VIN3 upregulation. Indirect mechanisms involving temperature-dependent growth, in addition to direct thermosensing, may be widely relevant in long-term biological sensing of naturally fluctuating temperatures.


Conflict of interest statement

Competing interests: The authors declare no competing interests.

Figures

Extended Data Fig. 1
Extended Data Fig. 1. Characterization of VIN3-luciferase reporter.
a, Schematic for VIN3-luciferase reporter. Luciferase was fused next to the C-terminus of VIN3. b, Luminescence imaging of the transgenic line carrying the VIN3-luciferase reporter. NV (non-vernalization) indicates no cold treatment (20°C), 4W indicates four weeks cold treatment at 5°C, and 4WT1 indicates four weeks cold plus one day warm treatment at 20°C. Four independent repeats with similar results. c, Analysis of endogenous VIN3 and transgenic VIN3-luciferase transcripts in the reporter line under different lengths of cold treatment (5°C). Control indicates the non-transgene vin3-6 control. 4D indicates four days cold treatment, nW indicates n weeks cold treatment, where n is 1, 2, 3, 4, 6 or 8. Two biological replicates (dots) and their means (lines) are shown. d&e, Flowering phenotype of the reporter line after four weeks vernalization (5°C). JU223, a FRI transgene, was introduced into the reporter line by crossing. Error bars s.e.m. of 12 individuals. ANOVA with Tukey HSD post hoc test for multiple comparisons was performed and p-values for individual comparisons of interest are shown.
Extended Data Fig. 2
Extended Data Fig. 2. Characterization of ntl8-D1, ntl8-D2 and NTL8 overexpression lines.
a, Schematic of the predicted proteins with the identified mutations in ntl8-D1 and ntl8-D2 mutants. Light blue box indicates NAC (NAM/ATAF/CUC) domain, red box indicates transmembrane domain (TM). R indicates Arginine, W indicates tryptophan, * indicates stop codon. b, Developmental phenotypes of ntl8-D1 (indicated by red arrow) and ntl8-D2 mutants. Three independent repeats with similar results. c, NTL8 transcript quantification in wildtype (WT) and ntl8-D1 and ntl8-D2 mutants in the warm (20°C). Errors are s.e.m of three biological replicates. d, No morphological phenotype is observed in ntl8-OE2 mutant. Five independent repeats with similar results. e, Schematic of T-DNA mutant SM_3_16309(ntl8-1) Salk_866741(ntl8-OE1\ Salk_587226 (ntl8-OE2) and GT19225 (ntl14-1). f, Analysis of NTL8 transcript by quantitative PCR in ntl8-OE1 and ntl8-OE2 in the warm (20°C). g, Analysis of VIN3 transcript by quantitative PCR in ntl8-OE1 and ntl8-OE2 in the warm (20°C). For (f,g), errors are s.e.m of four biological replicates. h, Analysis of NTL8 transcript in 35S::HA-NTL8 transgenic line. i, Analysis of VIN3 transcript in 35S::HA-NTL8 transgenic line in the warm (20°C). For (h,i), errors are s.e.m of three biological replicates. j, Analysis of NTL8 binding at NTL8 locus by ChIP. Col-0 was used as a background control. Error bars are s.e.m of three replicates. Primer positions are shown in the NTL8 schematic below (-30: 30bp upstream, +1000: 1000bp downstream of transcription start site). k, Analysis of NTL8 binding at VIN3 locus by ChIP. Primer positions are shown in the VIN3 schematic below (-900: 900bp upstream, 30: 30bp downstream of transcription start site, as in Fig.1d). Two biological replicates are shown.
Extended Data Fig. 3
Extended Data Fig. 3. Role of NTL8 in vernalization and redundancy.
a, Forward genetics identified ntl14-D. Shown below is a schematic of NTL14. Light blue box indicates NAC (NAM/ATAF/CUC) domain, red box indicates transmembrane domain (TM). Q indicates Glutamine, * indicates stop codon. Seven independent repeats with similar results. b, Analysis of VIN3 transcript level by quantitative PCR in ntl8-1 mutant and Col-0 control, at NV (20°C) and 4 weeks cold treatment (4W) at 5°C. Error bars show s.e.m of three biological replicates. c, As for (b) in ntl14-1 and Ler control. Error bars show s.e.m of four biological replicates. d, VIN3 transcript in ntl8-1ntl14-1 and wild-type (WT) control, at NV (20°C) and 3 weeks cold treatment (5°C). WT is the wild type plants in the F2 population of the cross between ntl8-1 and ntl14-1. For comparison between WT and ntl8-1ntl14-1 double mutant, we performed a two-tailed t-test: t-value=4.634, df=10, p-value = 0.0009. Error bars show s.e.m of six biological replicates. e&f, Analysis of FLC transcripts in Ler JU223, vin3-6 JU223, ntl8-D2 JU223, and vin3-6 ntl8-D2 JU223 mutants under NV (e), 4WT0 (f) and 4WT14 (f) conditions. NV (non-vernalization) indicates the warm (20°C) prior to cold treatment, 4W indicates four weeks cold treatment at 5°C, and 4WT14 indicates four weeks cold plus 14 days warm treatment at 20°C. In f, data is normalised to the corresponding NV treatment. Errors are s.e.m of three biological replicates. g, Unspliced FLC levels after 4 weeks vernalization in Col FRI and ntl8-1 FRI, normalised to the non-vernalized levels in the same genotype. Errors are s.e.m of three biological replicates. Unpaired t-test, Two-tailed, t=5.303, df=4, p-value=0.0061. h, Flowering time, counted by number of rosette leaves at flowering, for plants vernalized for 4 weeks. Errors are s.e.m of 12 individuals. Unpaired t-test, Two-tailed, t=4.241, df=22, p-value=0.00031. i, Potential cross-regulation targets of NTL14 based on microarray data in . j, Potential cross-regulation targets of NTL8 based on in vitro data . RNA was isolated from whole seedlings, and values are all normalized to UBC.
Extended Data Fig. 4
Extended Data Fig. 4. Analysis of VIN3 and short-term cold stress inducible genes in ntl8-D mutants, and characterization of independent NTL8prom::GFP-NTL8 transgenic lines.
a, Analysis of VIN3 transcript level under different lengths of cold treatment by quantitative PCR. 4WTn indicates 4 weeks cold at 5°C plus n days warm at 20°C, where n is 1, 3 or 7. NV: Non-Vernalized (20°C). Data was normalized to UBC. Errors are s.e.m of four biological replicates. b-d, RD29A (b), COR47 (c) and COR15 (d) transcript quantification in wildtype (WT) and ntl8-D mutants. NV indicates no cold treatment (20°C); 2D indicates 2-day cold treatment at 5°C. Errors are s.e.m of three biological replicates. e, All 10 randomly selected NTL8prom::GFP-NTL8 transgenic lines show NTL8 accumulation in the cold. NV: Non-Vernalized, and 7W refer to 7 weeks of cold respectively at 5°C. Scale = 100μm. Schematics of the GFP-NTL8 shown above. A GFP-linker was fused at the N-terminus of NTL8. Three roots were assayed with similar results for each line in both NV and 7W. f, Two representative lines showing the slow accumulation behaviour of NTL8 in the cold. NV: Non-Vernalized, 1W, 2W and 4W refer to 1, 2 and 4 weeks of cold respectively at 5°C. Scale = 100μm. Two independent repeats with similar results. g, The transcript level of the NTL8prom::GFP-NTL8 transgene in the two representative lineS4 and lineS8. Values are normalized to UBC. Errors are s.e.m of three biological replicates. RNA was isolated from whole seedlings. h, Detection of low GFP-NTL8 levels in non-vernalized plants after long exposure. Propidium Iodide staining was used to mark the root structure. Scale = 50μm. Five roots were assayed with similar results.
Extended Data Fig. 5
Extended Data Fig. 5. Subcellular and tissue localization of NTL8 protein.
a, Schematics of the GFP-NTL8, GFP-NTL8-D1, and GFP-NTL8-D2 constructs. A GFP-linker was fused at the N-terminus of NTL8, NTL8-D1, NTL8-D2. b, Localization of GFP-NTL8 and GFP-NTL8-D2 in the root in stable transgenic plants (top) and only the propidium iodide staining channel for the same roots (bottom), indicating they are the same optical section. 8-day old roots were imaged with Leica SP5 confocal microscopy. NV indicates no vernalization treatment (20°C), and 4W indicates 4 weeks treatment in the vernalization room at 5°C. Propidium Iodide staining was used to mark the root structure. Scale = 50μm. Four independent repeats with similar results. c-d, NTL8 accumulation after exposure to fluctuating temperatures. c, Imaging of the GFP-NTL8 fluorescence signal in the root tip with a Leica DM6000 microscope, under exposure to different lengths of fluctuating temperatures (Fluct, with an average temperature of 14°C) and constant 14°C (Con). NV indicates non-vernalization, 2W indicates 2 weeks, 4W indicates 4 weeks. Scale = 50μm. Independent roots (6 for NV, 12 for Con-2W, 13 for Fluct-2W, 4 for Con-4W, and 5 for Fluct-4W) were assayed with similar results. d, Analysis of GFP-NTL8 protein using western blot after the same conditions as in c. One replicate. Ponceau staining of the input on a separate gel was used for the loading control. Quantification of band intensity is shown on each gel. For gel source data, see supplementary figure 1. e, Domains of NTL8 (i&ii) and VIN3 (iii&iv) in the root tip after 7 weeks cold. i&iii indicate merged image of bright and fluorescence channels, while ii&iv indicate fluorescence channel only. Scale = 100 μm. Independent roots (5 for GFP-NTL8 and 13 for VIN3-GFP) were assayed with similar results. f, Detection of GFP-NTL8 fluorescence signal in the shoot in warm (20°C) or after 6 weeks cold (5°C). Green indicates the signal of GFP-NTL8, red indicates the signal from chlorophyll autofluorescence, and grey indicates the bright field. g, g(i) and g(ii) are the side view of the 3D projection of f(i) and f(ii) respectively. Scale = 50μm. Three independent repeats with similar results. h, Subcellular localization of GFP-NTL8, GFP-NTL8-D1, and GFP-NTL8-D2 with transient assay in Nicotiana benthamiana. GFP-NTL8 (i), GFP-NTL8-D1 (iii) and GFP-NTL8-D2 (iv) were kept in warm (20°C) conditions for 2 days before imaging; GFP-NTL8 (ii) was kept in the cold (5°C) for 2 days prior to imaging. Arrows point to nuclei. Scale = 25μm. Two independent repeats with similar results.
Extended Data Fig. 6
Extended Data Fig. 6. Analysis of NTL8 isoforms in wild-type plants, and assay of NTL8 protein turnover rate under cycloheximide (CHX) treatment.
a, Schematic of NTL8 RNA isoforms identified by 3’RACE and sequence of isoforms 2 and 3. b, Quantification of protein levels from western blots of Fig. 2a and additional replicates of experiment, showing each band separately. c, Quantification of the transcript levels of all three isoforms by qPCR. NV indicates non-vernalized (20°C), and 4W indicates 4 weeks treatment in the vernalization room at 5°C. Errors are s.e.m of eight (for isoform1) or four (for isoform2 and isoform3) biological replicates. d, Comparison of the proteins produced by wild-type NTL8prom::GFP-NTL8 and mutant NTL8prom::GFP-NTL8-D2. The first band produced in the GFP-NTL8 line is absent in the GFP-NTL8-D2 line. Based on the sequence of GFP-NTL8-D2, the full-length form with the TM domain cannot be made. This suggests that the absent band corresponds to full length GFP-NTL8. The second band produced in the GFP-NTL8 line matches the size on the gel of the GFP-NTL8-D2 form. Ponceau staining of the input on a separate gel was used for the loading control. For gel source data, see supplementary figure 1. Two independent repeats with similar results e, Diagram of the predicted proteins produced by alternative splicing. The NTL8 isoform 2 (286 aa) has a similar amino-acid (aa) number as the NTL8-D2 (293 aa) form. Given that the second band for GFP-NTL8 in (d) matches the size on the gel of the NTL8-D2 form, the second band could be, at least in part, produced by NTL8 isoform 2. Furthermore, the alternative splicing site for isoform 3 is present in the ntl8-D2 allele, so NTL8 isoform 3 could still be produced by the ntl8-D2 allele, and the resulting protein likely produces the band in the GFP-NTL8-D2 sample that matches the third band in the wild-type. Based on the protein marker, all of the bands gave systematically larger molecular weights than those predicted by the amino acid sequence, possibly due to large post-translational modifications, potential measurement inaccuracy or a combination of the two. f&g, GFP-NTL8 protein level determined by western blot assay. 8-day old seedlings treated with 100μM cycloheximide (CHX) in the warm (20°C, f), or in the cold (5°C, g), as indicated for 24hr and 48hr. Ponceau staining of the input on separate gels was used for the loading control. Quantification of band intensity is shown on each gel. Two independent repeats with similar results; for gel source data, see supplementary figure 1. h&i, 8-day old seedlings treated with 100μM cycloheximide (CHX) in the warm (20°C) or cold (5°C), as indicated for 48hr, were imaged with the fluorescence microscope Leica DM6000 (h) and with the Leica SP5 confocal microscope (i). Root structures and dying cells are shown in (i) with Propidium Iodide staining. Scale = 100μm. Two independent repeats with similar results.
Extended Data Fig. 7
Extended Data Fig. 7. Changes in production and growth rate are still consistent with the mathematical model.
a, Growth rate at different temperatures estimated from the weight of 50 seedlings at different times following growth in the warm (20°C) and in the cold (5°C). Seedlings were transferred to the cold (blue data points) after 7 days in the warm (data shown as empty circles) or 12 days (filled diamonds). Errors are s.e.m of six (8 days, 12 days warm) and three (all other timepoints) biological replicates. Linear regression was used, with the fitted lines shown together with the slopes corresponding to the growth rates in the different conditions. The difference in growth between warm and cold was approximately 7-fold. The older seedlings grew faster in the cold. Therefore we used the average slope between the growth rates of 7-day-old and 12-day-old plants in the cold as the cold growth rate. b, Assay of the absolute amount of NTL8 by western blot with the same number of seedlings grown for 8 days in warm (20°C) and then moved to cold (5°C) or kept in warm (20°C), showing that the amount of NTL8 per plant increases in the warm and in the cold. Errors are s.e.m of thirteen biological replicates. For gel source data, see supplementary figure 1. We performed a one-way ANOVA test: p-value = 8.544·10-10, F=39.42, R square = 0.6865, with the Tukey HSD post hoc test for multiple comparisons which showed all 3 pairs (NV-Cold: p-value = 1.44·1010-9, NV-Warm: p-value = 0.0038, Cold-Warm: p-value = 1.55·10-5) are significantly different. c, Model from Fig. 3c (no degradation) reproduced for comparison (α = ¼, tdiv (cold) = 7 days). d, Same model with a 4-fold longer division time (α = ¼, tdiv (cold) = 28 days), showing accumulation that saturates more slowly. e, Model with decreased production (α = ⅛, tdiv (cold) = 7 days). The timescale of the accumulation does not change, but the saturated levels are decreased, thus increasing the requirement for reduced dilution to explain the experimentally observed accumulation. f, Model with decreased production and a 4-fold longer division time (α = ⅛, tdiv (cold) = 28 days), showing that further reduced dilution can recover some of the effect due to decreased production. g, Table of parameters of model from Fig. 3a-c.
Extended Data Fig. 8
Extended Data Fig. 8. Additional treatments to reduce growth rate.
a, Inhibition of growth by applying kanamycin (Kan, 200μg/L), Aminoethoxyvinylglycine (AVG, 1μM or 10μM), Abscisic acid (ABA, 1mM), 2,4-Dichlorophenoxyacetic acid (2,4-D, 1μM), Indole-3-acetic acid (IAA, 10μM), brassinazole (Brz, 1μM or 10μM), 1-Aminocyclopropane-1-carboxylic Acid (ACC, 1μM, 10μM, or 100μM), Hydroxyurea (HU, 10mM or 20mM) and paclobutrazol (PAC, 2μM, 20μM or 100μM). Control indicates no treatment. Seedlings grown for around 6-days were transferred to new medium supplemented with indicated chemicals for 2 days in the warm (20°C). Two independent experiments showed similar results. b, Imaging of the fluorescence signal of GFP-NTL8 in the root tip of plants from (a) after treatments for 2 days in the warm (20°C). Scale = 100μm. c, Quantification of fluorescence intensity averaged over multiple roots. Two independent experiments were combined; roots imaged per treatment (treatment order as in (c) from left to right): 16 roots total (6 excluded), 25 (1), 13 (0), 55 (3), 13 (0), 18 (0), 19 (0), 20 (7), 30 (3), 52 (0), 19 (0), 40 (0), 25 (0), 43 (0), 30 (1), 42 (0), 51 (1). Errors are s.e.m. We observed higher NTL8 in all treatments that inhibited growth without killing the plants. Seedlings treated with 10mM or 20mM hydroxyurea for two days were almost dead. The 1μM AVG treatment did not increase NTL8 levels, which is expected since growth was not slowed in that case. ACC treatments showed subtle effects, possibly due to indirect effects.
Extended Data Fig. 9
Extended Data Fig. 9. Alternative treatments affecting growth show perturbed NTL8 levels.
a, Seedling phenotypes. 6-day old seedlings were treated under Short Day (8hr light/16hr dark) or Long Day (16hr light/8hr dark) conditions for two weeks in the warm (20°C). b, Assay of growth in (a) by measuring fresh weight. Bulk of 50 individual seedlings were weighed. Errors indicates s.e.m of ten (for short day) or eight (for long day) replicates. c, Analysis of NTL8 protein concentration from treatments in (b) by western blot assay with equal weight of starting material. As shown by Ponceau staining, which differs between Short Day and Long Day treatments. MPK6 was therefore used as the loading control. Ponceau staining and MPK6 antibody of the input were performed on the same gel, separate to the NTL8 gel. For gel source data, see supplementary figure 1. d, Quantification of relative NTL8 protein concentration in (c) with ImageJ (normalised to Short Day levels). Error bars show s.e.m of 4 replicates. e, Effect of gibberellin treatment on NTL8 accumulation in the cold. 8-day seedlings grown in the warm (20°C) were transferred to a new medium supplemented with or without gibberellin (GA, 10μM), and treated for 4 weeks in the cold (5°C) before imaging. Quantification of fluorescence intensity; roots imaged per treatment (treatment order as in (e) from left to right): 28 roots total (0 excluded), 28 (0), 31 (0), 31 (1). Errors are s.e.m. For comparison between treatments with and without GA, one-tailed t-test was performed: for line S4: t-value = -3.21, df=54, p-value = 0.0011, for line S8: t-value = - 7.75, df = 59, p-value = 7.2·10−11. f, Inhibition of growth by applying MG132 (100μM). - MG132 indicates no treatment. Seedlings grown for around 6-days in the warm (20°C) were transferred to new medium supplemented with indicated chemicals for 2 days in the warm (20°C). g, Imaging of the fluorescence signal of GFP-NTL8 in the root tip of plants from (f) after treatments for 24hr and 48hr. Scale = 50μm. Six independent repeats with similar results.
Extended Data Fig. 10
Extended Data Fig. 10. Root tissue structure and computational model of the root, NTL8 protein stability, and map-based cloning of ntl8-D and ntl14-D mutations.
a, Diagram of root structure showing division zone, elongation zone and differentiation zone as well as the different tissue types in the meristematic region. Modified from. b, Analytical solution of the Ordinary Differential Equation (ODE) model (solid line) and computational simulation (dashed line) of the growth dilution model give the same predicted NTL8 concentration pattern. A small difference is seen in the cold because, in the simulation, division is occurring in a single step every week, as opposed to the smooth, averaged growth of the ODE model. c, NTL8 protein is stable over timescales of weeks. 4 weeks cold (5°C) root imaged after a further 2 days in the warm (20°C, i & ii), or 24 days in the cold (5°C) following the 2-day warm treatment (iii & iv). i, iii show the root tip, and ii, iv show the region of the root where NTL8 accumulated during the 4-week cold period. NTL8 is maintained at those high levels after transfer to warm (ii), due to limited further growth in that region, and persists there after transfer back to the cold for at least 24 days (iv). Root structures and dying cells are shown with Propidium Iodide staining. Scale = 100μm. Two roots. d, Diagram of map-based cloning for ntl8-D1 and ntl8-D2. Recombination numbers are indicated separately for ntl8-D1 and ntl8-D2 mutants. Diagram was drawn according to. e, Diagram of map-based cloning for ntl14-D. Recombination numbers are indicated as shown. Diagram was drawn according to.
Fig. 1
Fig. 1. Role for NTL8 in long-term cold-induced accumulation of VIN3.
a, Luminescence assay for ntl8-D1, ntl8-D2 before cold (5°C), homozygous and heterozygous (-/+) plants shown. WT: progenitor line carrying transgenic VIN3-luciferase. 14 independent repeats with similar results. b, qPCR VIN3 transcript levels in warm (20°C) for WT, ntl8-D1 and ntl8-D2, normalized to UBC. Error bars s.e.m. of three biological replicates (data from 0 days timepoint, panel c, not normalized to maximum). c, Increase in normalized qPCR VIN3 transcript levels after different cold durations (5°C). Levels normalized to UBC, and then to 42-day timepoint (maximum VIN3 level) in each genotype. Error bars s.e.m. of three biological replicates. d, ChIP analysis of NTL8 binding at VIN3. Control: Col-0. Error bars s.e.m. of six replicates. -900,30: 900bp upstream, 30bp downstream of transcription start site. e, GFP-NTL8 localization in transgenic plant root tips carrying NTL8prom::GFP-NTL8; left NV: Non-Vernalized (20°C), right 4-week cold (5°C). Scale=50μm. Five independent repeats with similar results (including data in Fig.4d).
Fig. 2
Fig. 2. NTL8 protein accumulates slowly in cold with constitutively slow turnover.
a, Western analysis of NTL8 protein in whole plants under different cold durations. Negative control: non-transgenic Col-0. NV (20°C),1W,2W,4W: 1,2,4 weeks of cold (5°C). 4WTn: 4 weeks cold followed by n-days warm (20°C), with n=1,3,8. Blue/red squares indicate cold/warm conditions. Experiment was repeated independently seven times with similar results; see Supplementary Figure 1. b, Comparison of VIN3 transcript dynamics, NTL8 protein and transcript dynamics. NTL8 protein dynamics measured as summed intensity of top two bands (a). Transcript levels determined using samples from same treatment as (a). Error bars s.e.m. of six (VIN3), seven (NTL8 protein) and three (NTL8 transcript) biological replicates. NTL8 protein, transcript levels normalised to NV measurement; VIN3 transcript levels normalised to 1W cold. Blue/red colour of x-axis indicates cold (5°C)/warm (20°C). c, Slow accumulation requires low degradation rates. Simple model (Supplementary Methods) demonstrates that time to reach half final concentration (t½, dashed line) is unchanged by production rate changes but is affected by degradation rate changes. d,e Analysis of NTL8 turnover rate after 4-week cold treatment (5°C), with subsequent 100μM cycloheximide (CHX) treatment in cold (d) or warm (e, 20°C) for indicated time, with HA-tagged NTL8. Growth also inhibited by CHX, so measurements reflect protein stability, with little effect from dilution. Quantification: mean ± s.e.m of 11 biological replicates. f, Western analysis of NTL8 protein concentration at different developmental phases in warm (20°C). Quantification: mean ± s.e.m of five biological replicates. All westerns carried out with equal weight of whole seedlings. Ponceau stainings (a,f) run on from separate gels and used as processing controls. Ponceau stainings (d,e) from same gel used as loading control. For gel source data, see Supplementary Figure 1.
Fig. 3
Fig. 3. Slowing down growth leads to NTL8 accumulation.
a, Mathematical description of Ordinary Differential Equation model for NTL8 dynamics; a.u.: arbitrary units. b,c, Prediction of NTL8 protein concentration dynamics based on model of (a): little degradation (b), no degradation (c) of NTL8 protein. d, Seedling phenotypes after 8-day treatment. Con: control (20°C), Cold: 5°C, Brz: brassinazole (20°C), PAC: paclobutrazol (20°C), Hyg: hygromycin (20°C). Seedlings grown for 6 days in warm (20°C) before transfer to respective treatment. Images taken immediately before sampling. e, Western analysis of NTL8 protein concentration with treatments in (d) with equal weight of whole seedlings. Ponceau staining was run on separate gels and used as processing control. Experiment was repeated independently four times with similar results. For gel source data, see Supplementary Figure 1. f, Quantification of relative NTL8 transcript and protein level in (e). Error bars: s.e.m. of two (protein Hyg treatment), four (protein all other treatments), three (transcript Hyg treatment), six (transcript Brz treatment), nine (transcript all other treatments) replicates.
Fig. 4
Fig. 4. Mathematical model predicts observed NTL8 pattern in roots.
a, Simulation schematic: each day protein is produced followed, in warm, by division. In cold, division occurs every seventh day. Because division is less frequent, concentration increases in black cells in cold, spreading through division to other cells. Last step of simulation each day is calculation/output of NTL8 protein amount in each cell and overall root concentration, accounting for same protein amounts in black/blue cells (and also equivalent position in panel c: first two rows above QC, indicated by two cells in middle columns). Production occurs in initials only; division following production leads to NTL8 amount split equally between daughters. b, Diagram of model root cell file: each cell from stem cell division assumed to divide five times. Cell numbers of each type (“Cell number”) and relative NTL8 protein amounts (“Relative NTL8 amount in cells initially”) in each cell type shown at simulation start. Inside cells, we indicate number of divisions to undergo before exiting “division zone”, with exception of black cell (initial) which undergoes unlimited divisions. Two generations shown, indicating 32 cells added at every generation (following short initial 6-generation growth period not included in simulation). c, Model predictions for relative GFP-NTL8 concentrations (colorscale bar for concentration in e), for timepoints shown in (d). d, Images of GFP-NTL8 in roots at same timepoints. NV (20°C),1W,2W,4W,6W: 1,2,4,6 weeks of cold (5°C). 6WT7: 6 weeks cold plus 7 days warm (20°C). Scale=100μm. e, Model prediction of region with NTL8 accumulation during 6 weeks cold, remaining at high levels for 7 days post-cold (colorscale bar for concentration, right). f, Root imaged immediately after 6 weeks cold (5°C) (0hr) and for 10,20,34,44,60 hours after cold, in warm (20°C). Scale=500μm. Five independent repeats for panels d&f with similar results.

Comment in

References

    1. Garrity PA, Goodman MB, Samuel AD, Sengupta P. Running hot and cold: behavioral strategies, neural circuits, and the molecular machinery for thermotaxis in C. elegans and Drosophila. Genes Dev. 2010;24:2365–2382. doi: 10.1101/gad.1953710. - DOI - PMC - PubMed
    1. McClung CR, Davis SJ. Ambient thermometers in plants: from physiological outputs towards mechanisms of thermal sensing. Curr Biol. 2010;20:R1086–1092. doi: 10.1016/j.cub.2010.10.035. - DOI - PubMed
    1. Ding Y, Shi Y, Yang S. Advances and challenges in uncovering cold tolerance regulatory mechanisms in plants. New Phytol. 2019;222:1690–1704. - PubMed
    1. Zhang J, Li X-M, Lin H-X, Chong K. Crop Improvement Through Temperature Resilience. Annual review of plant biology. 2019;70:753–780. - PubMed
    1. De Lucia F, Crevillen P, Jones AM, Greb T, Dean C. A PHD-Polycomb Repressive Complex 2 triggers the epigenetic silencing of FLC during vernalization. Proc Natl Acad Sci U S A. 2008;105:16831–16836. doi: 10.1073/pnas.0808687105. - DOI - PMC - PubMed

Publication types

MeSH terms