. 2020 Sep;585(7824):298-302.
doi: 10.1038/s41586-020-2497-0. Epub 2020 Jul 15.

Nucleolar RNA polymerase II drives ribosome biogenesis

Affiliations

Nucleolar RNA polymerase II drives ribosome biogenesis

Karan J Abraham et al. Nature. 2020 Sep.

Abstract

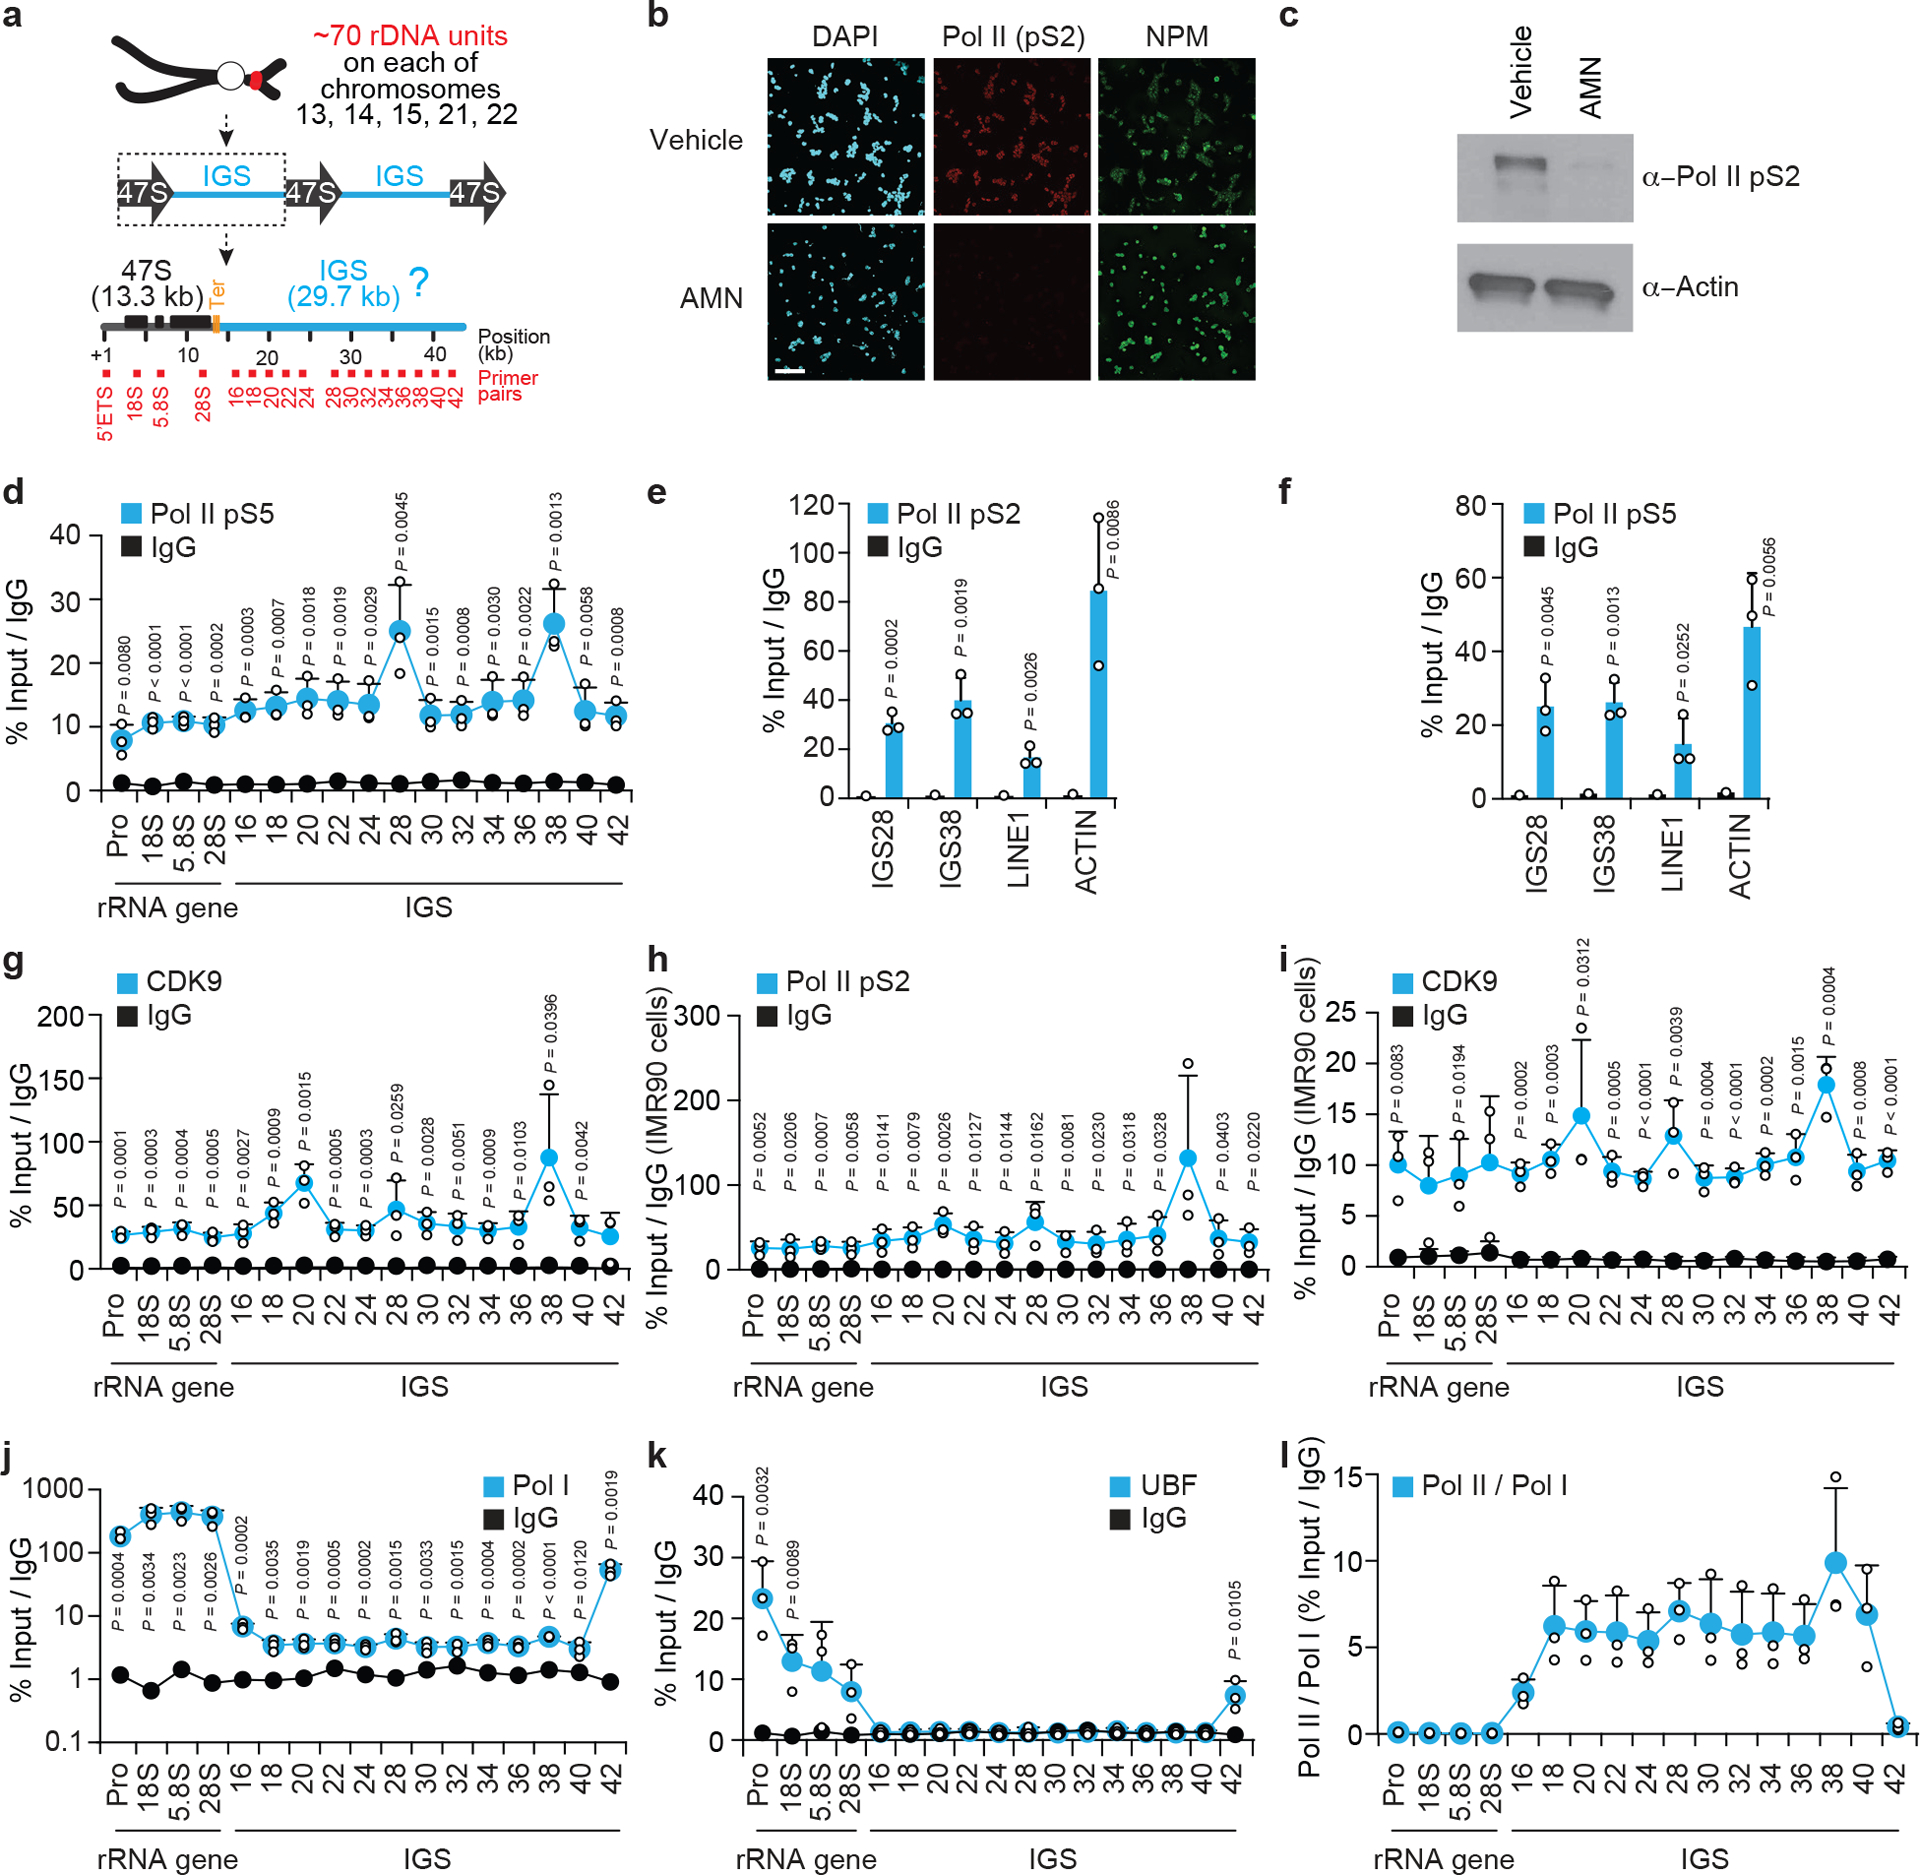
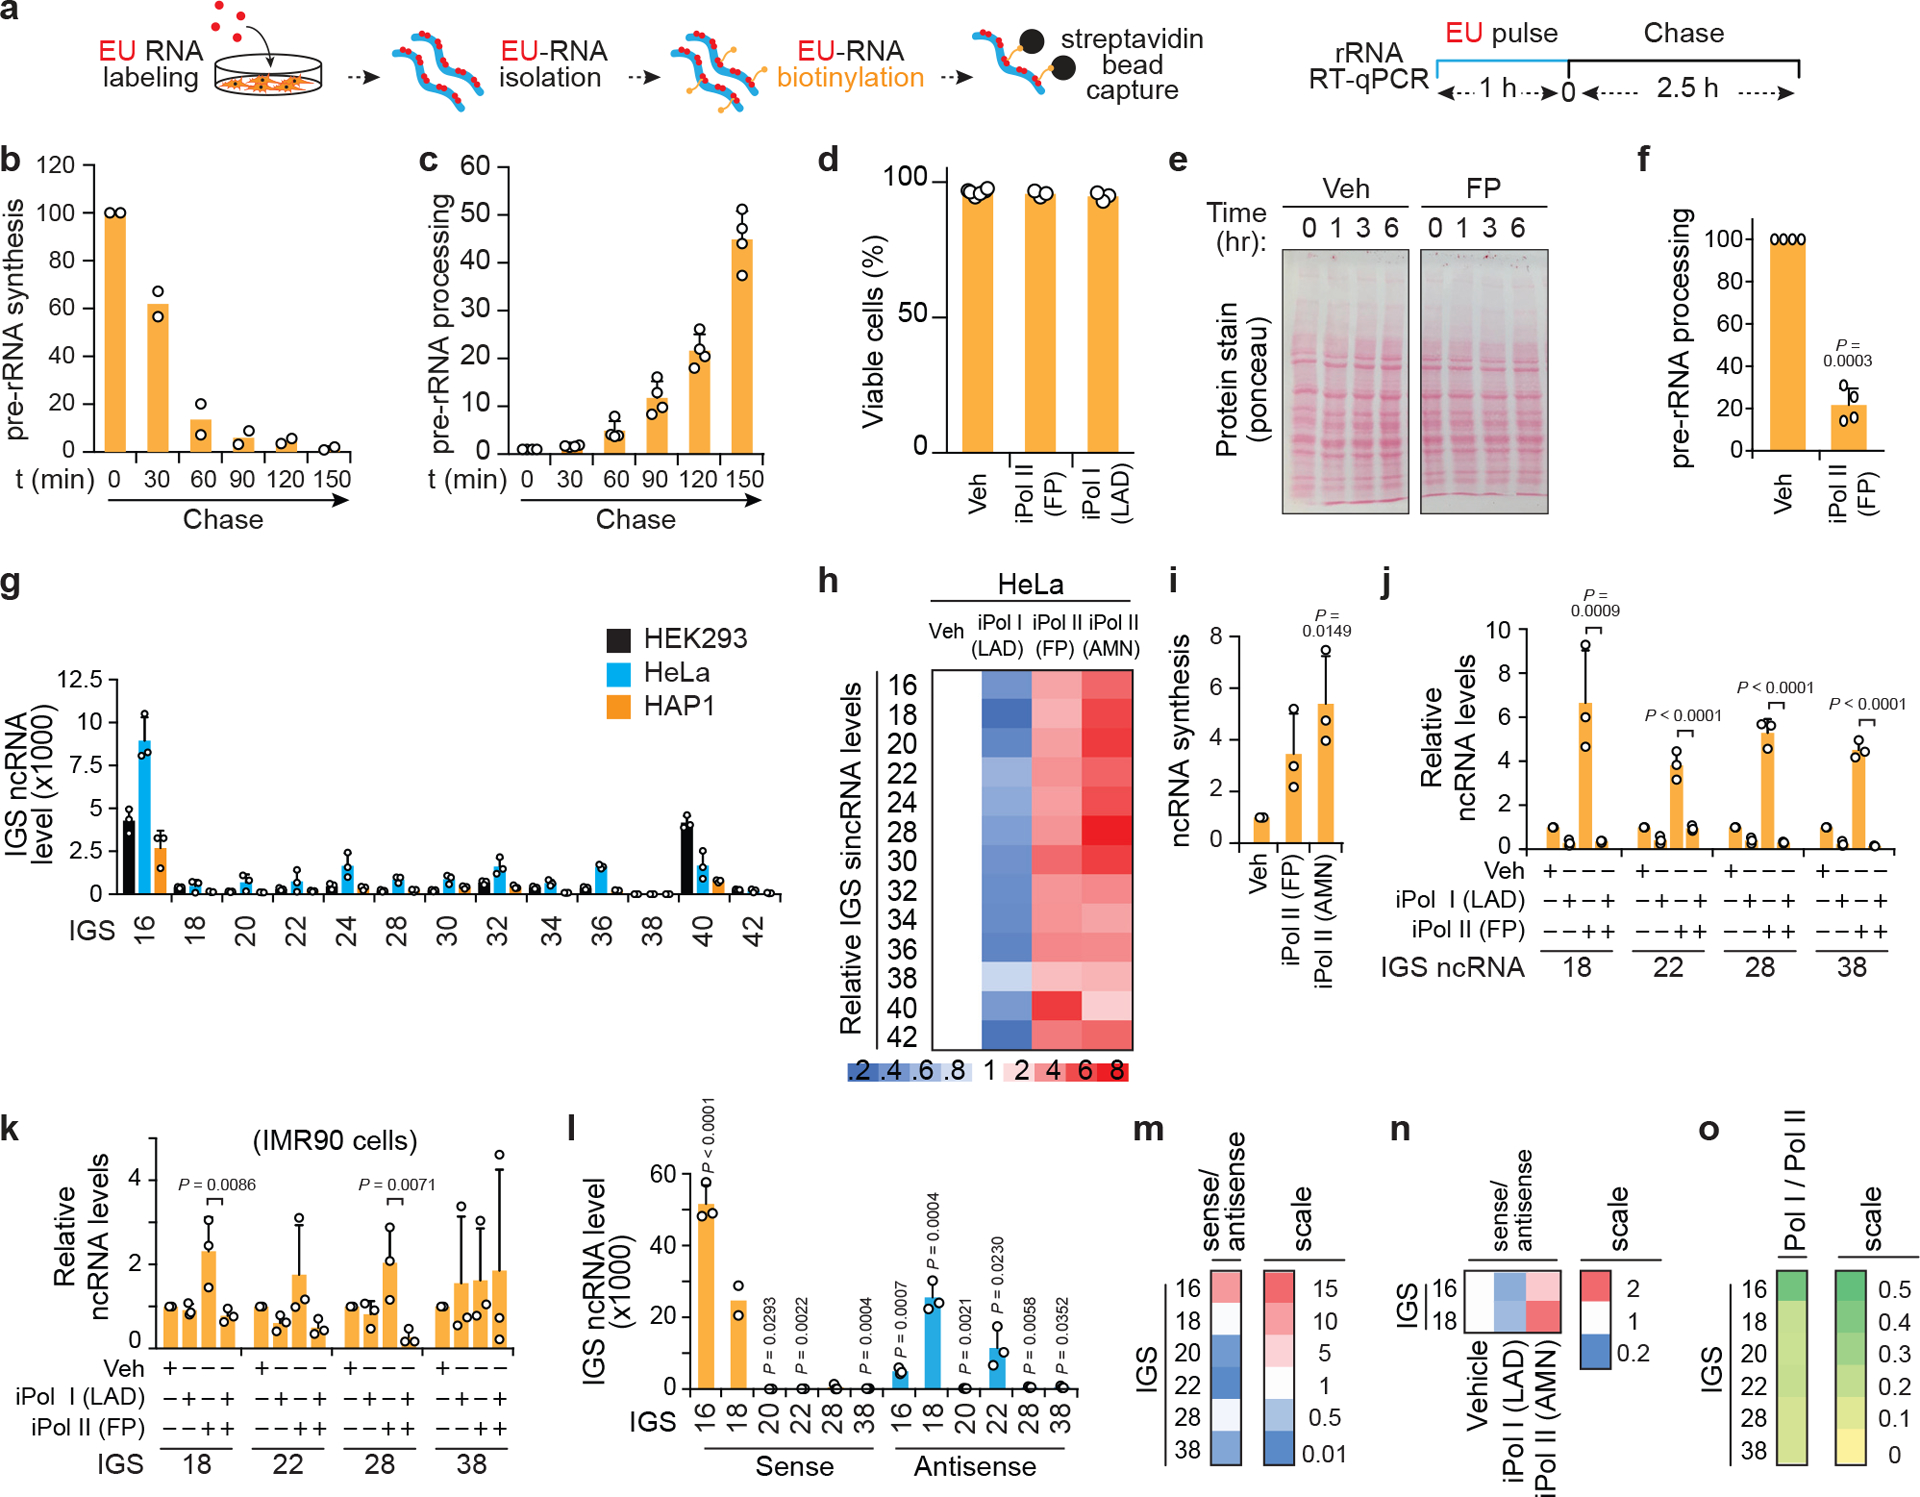
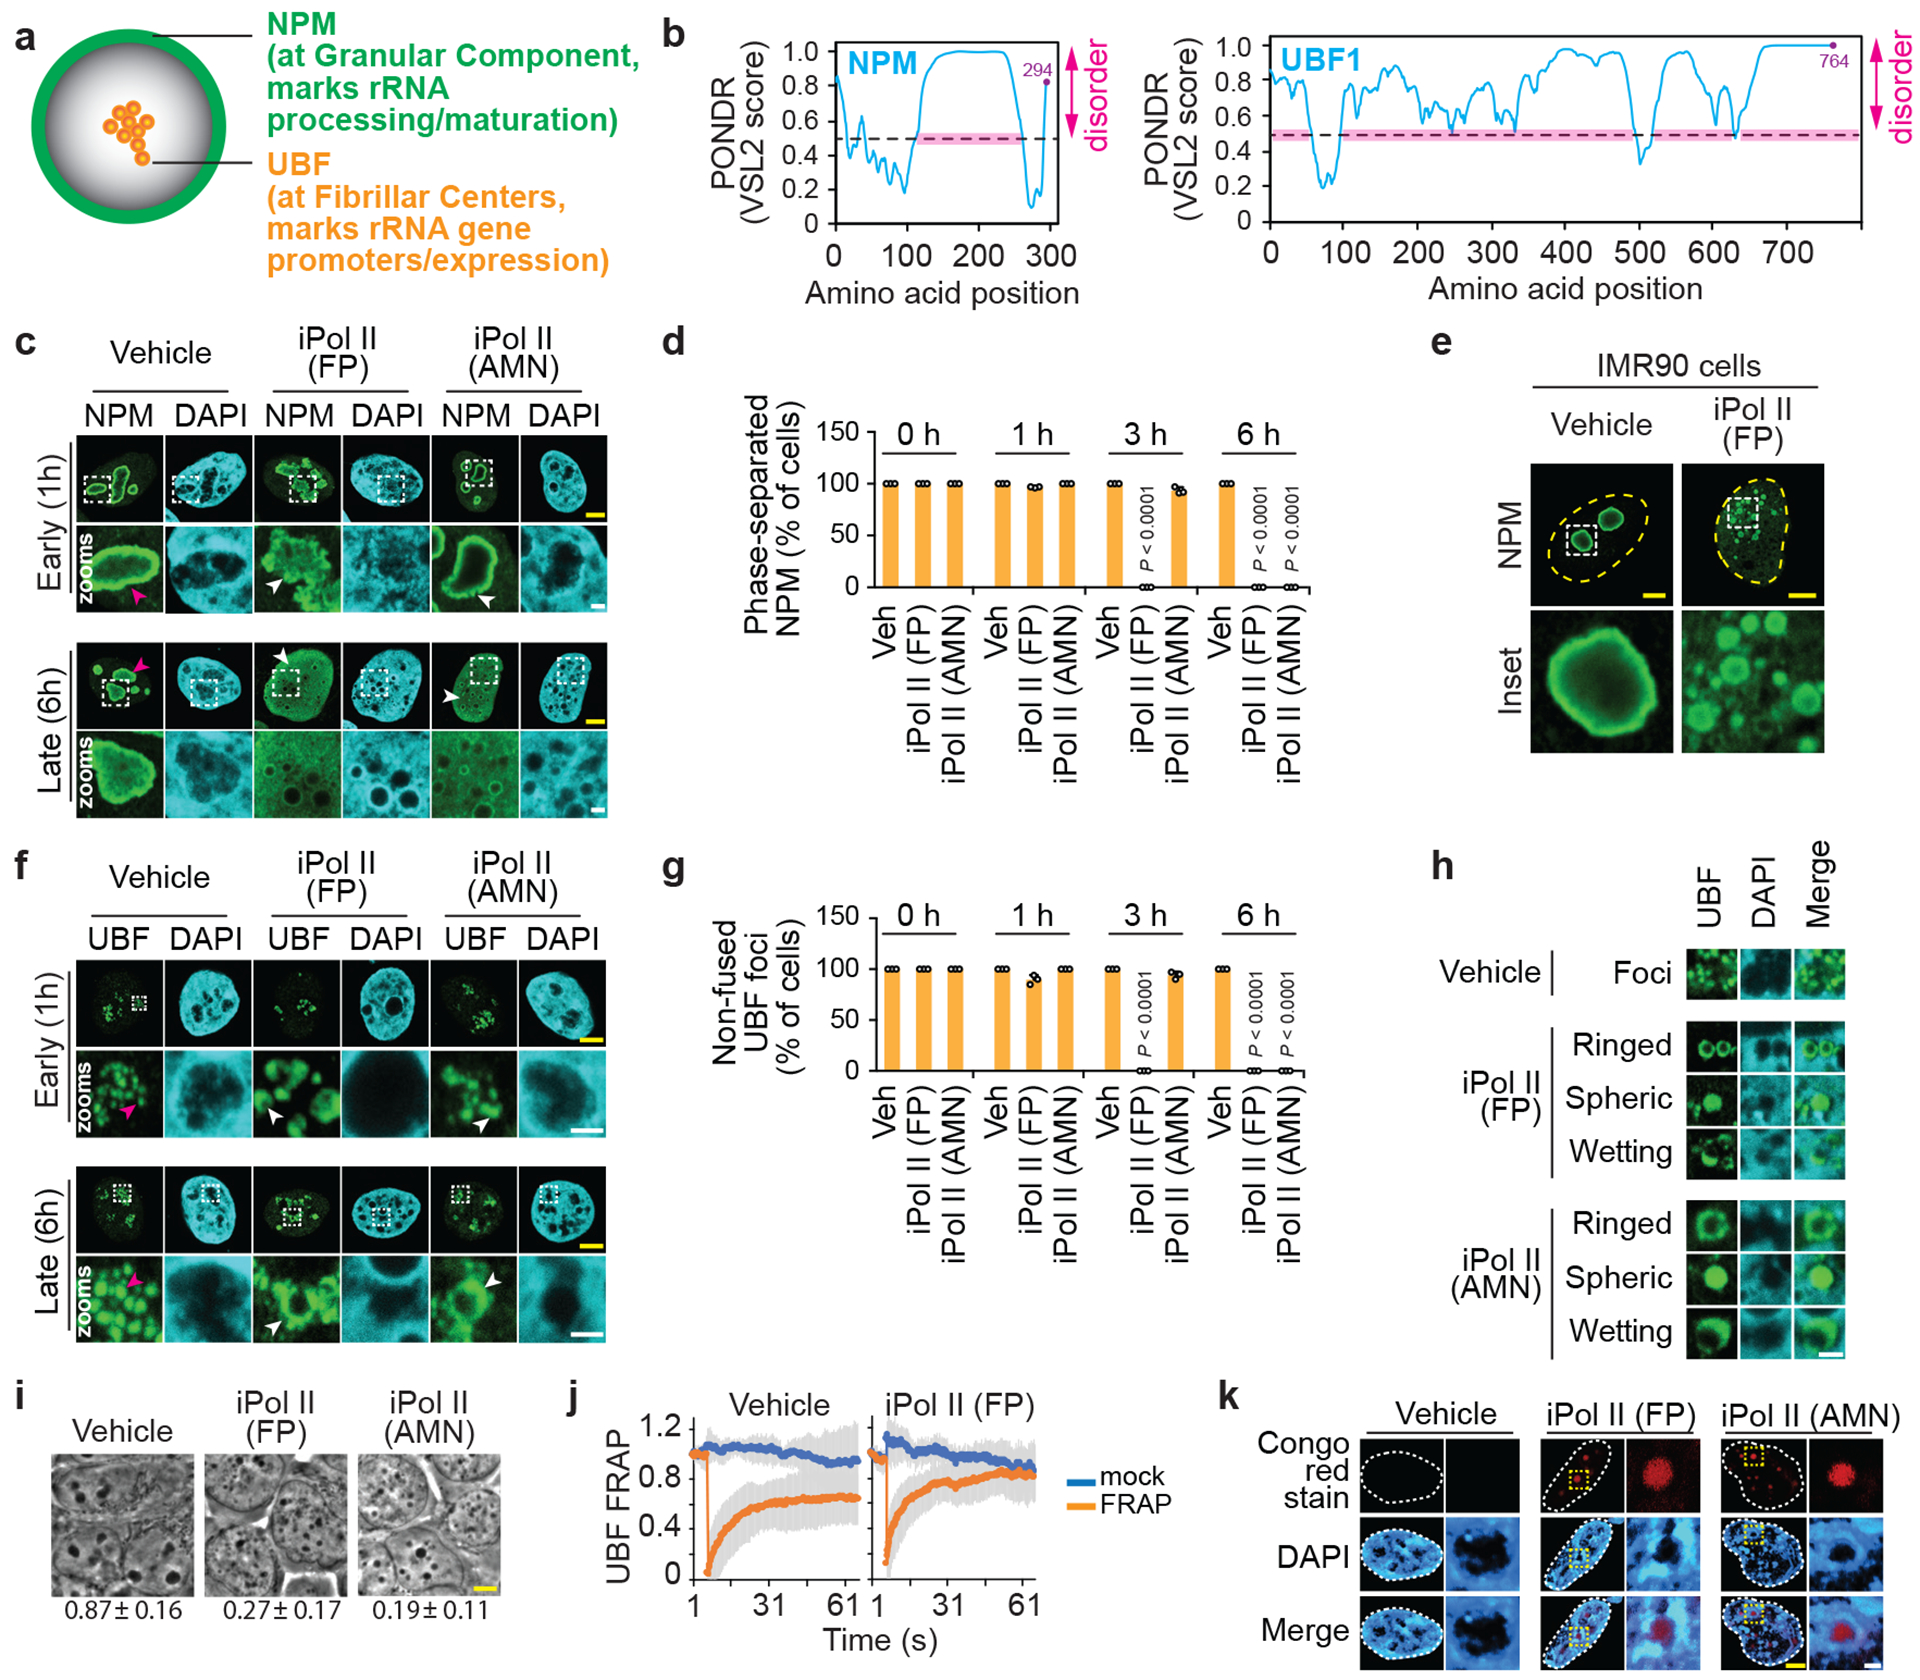
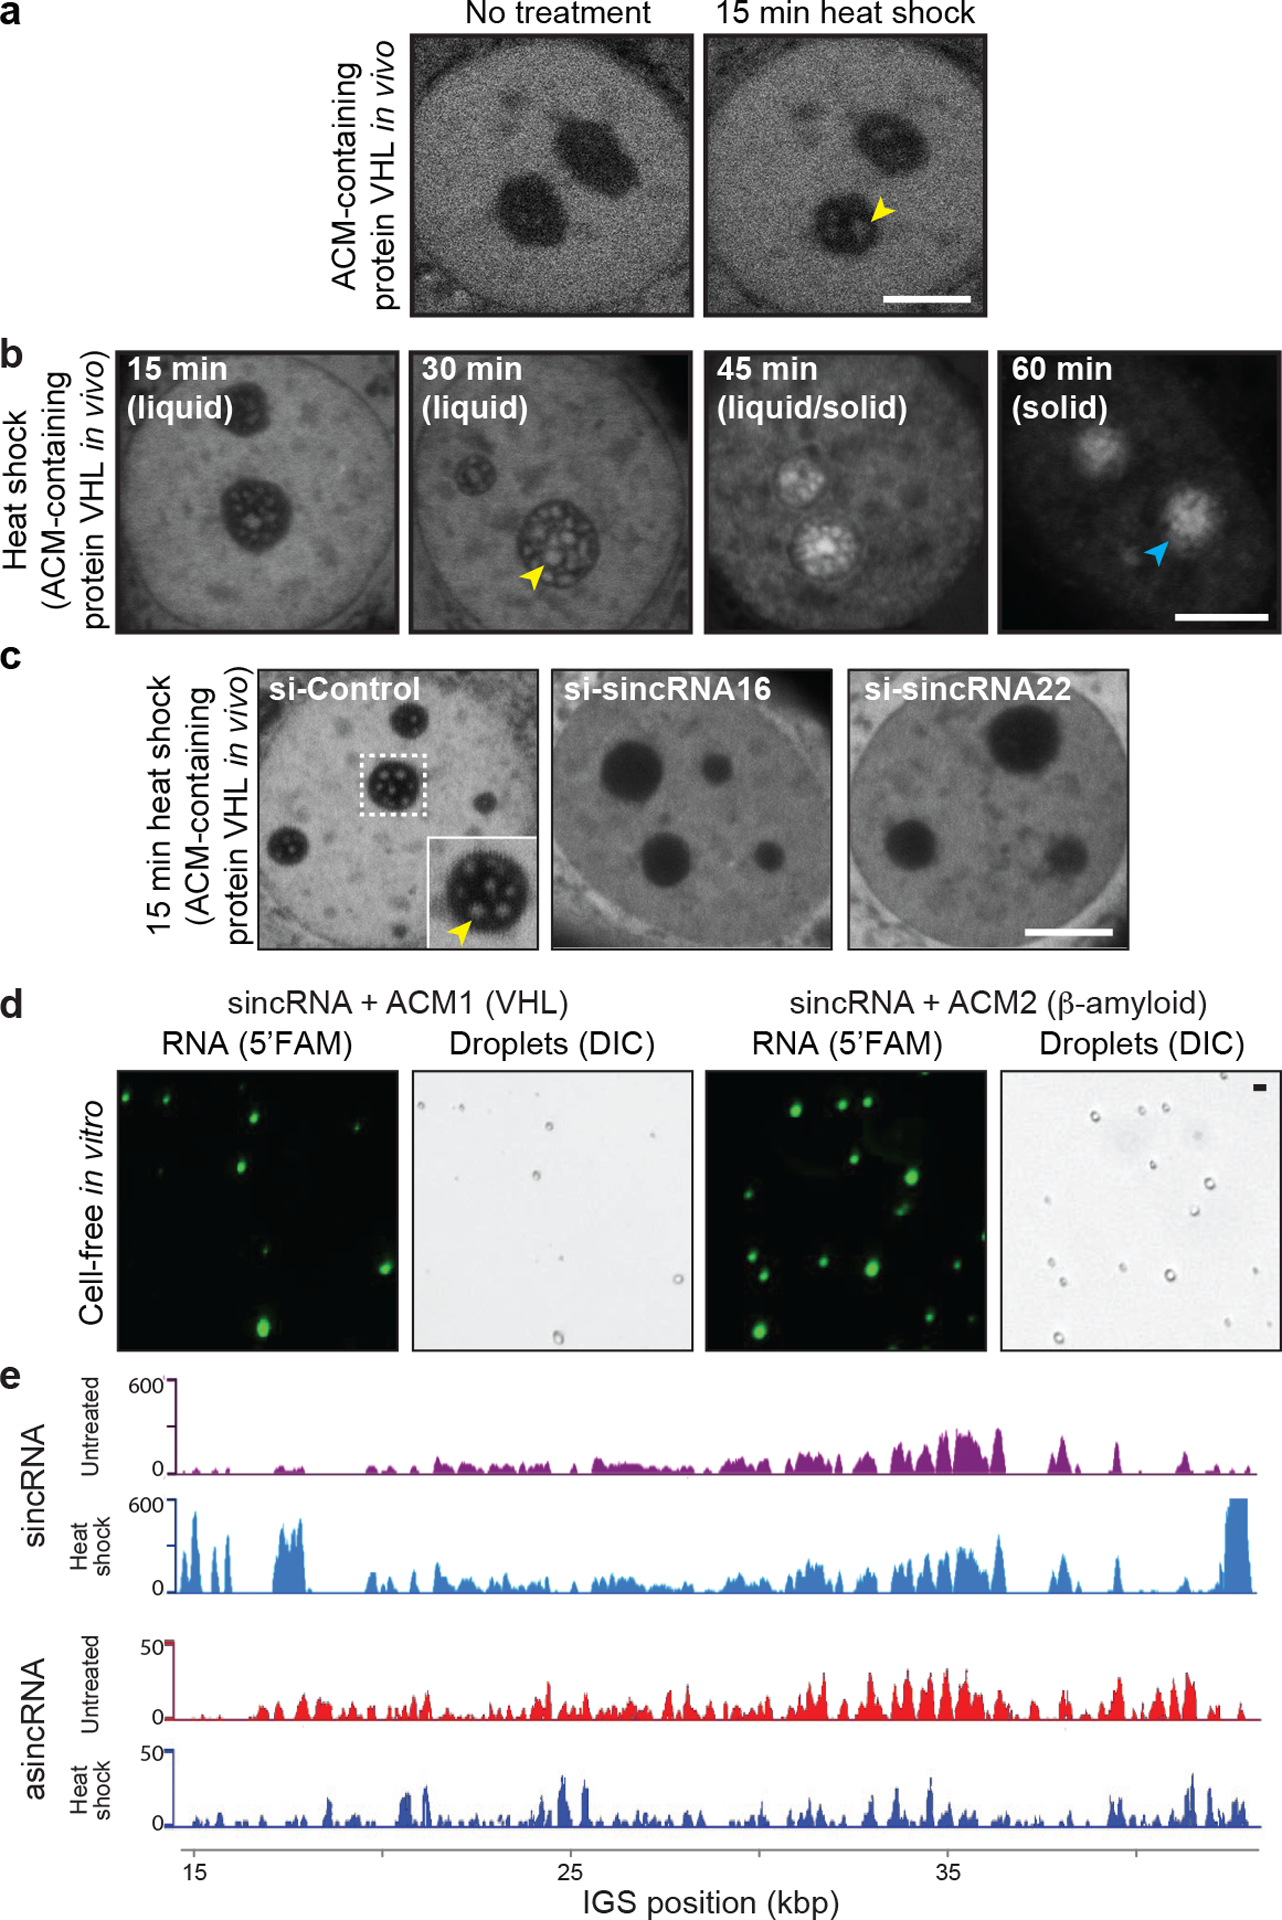
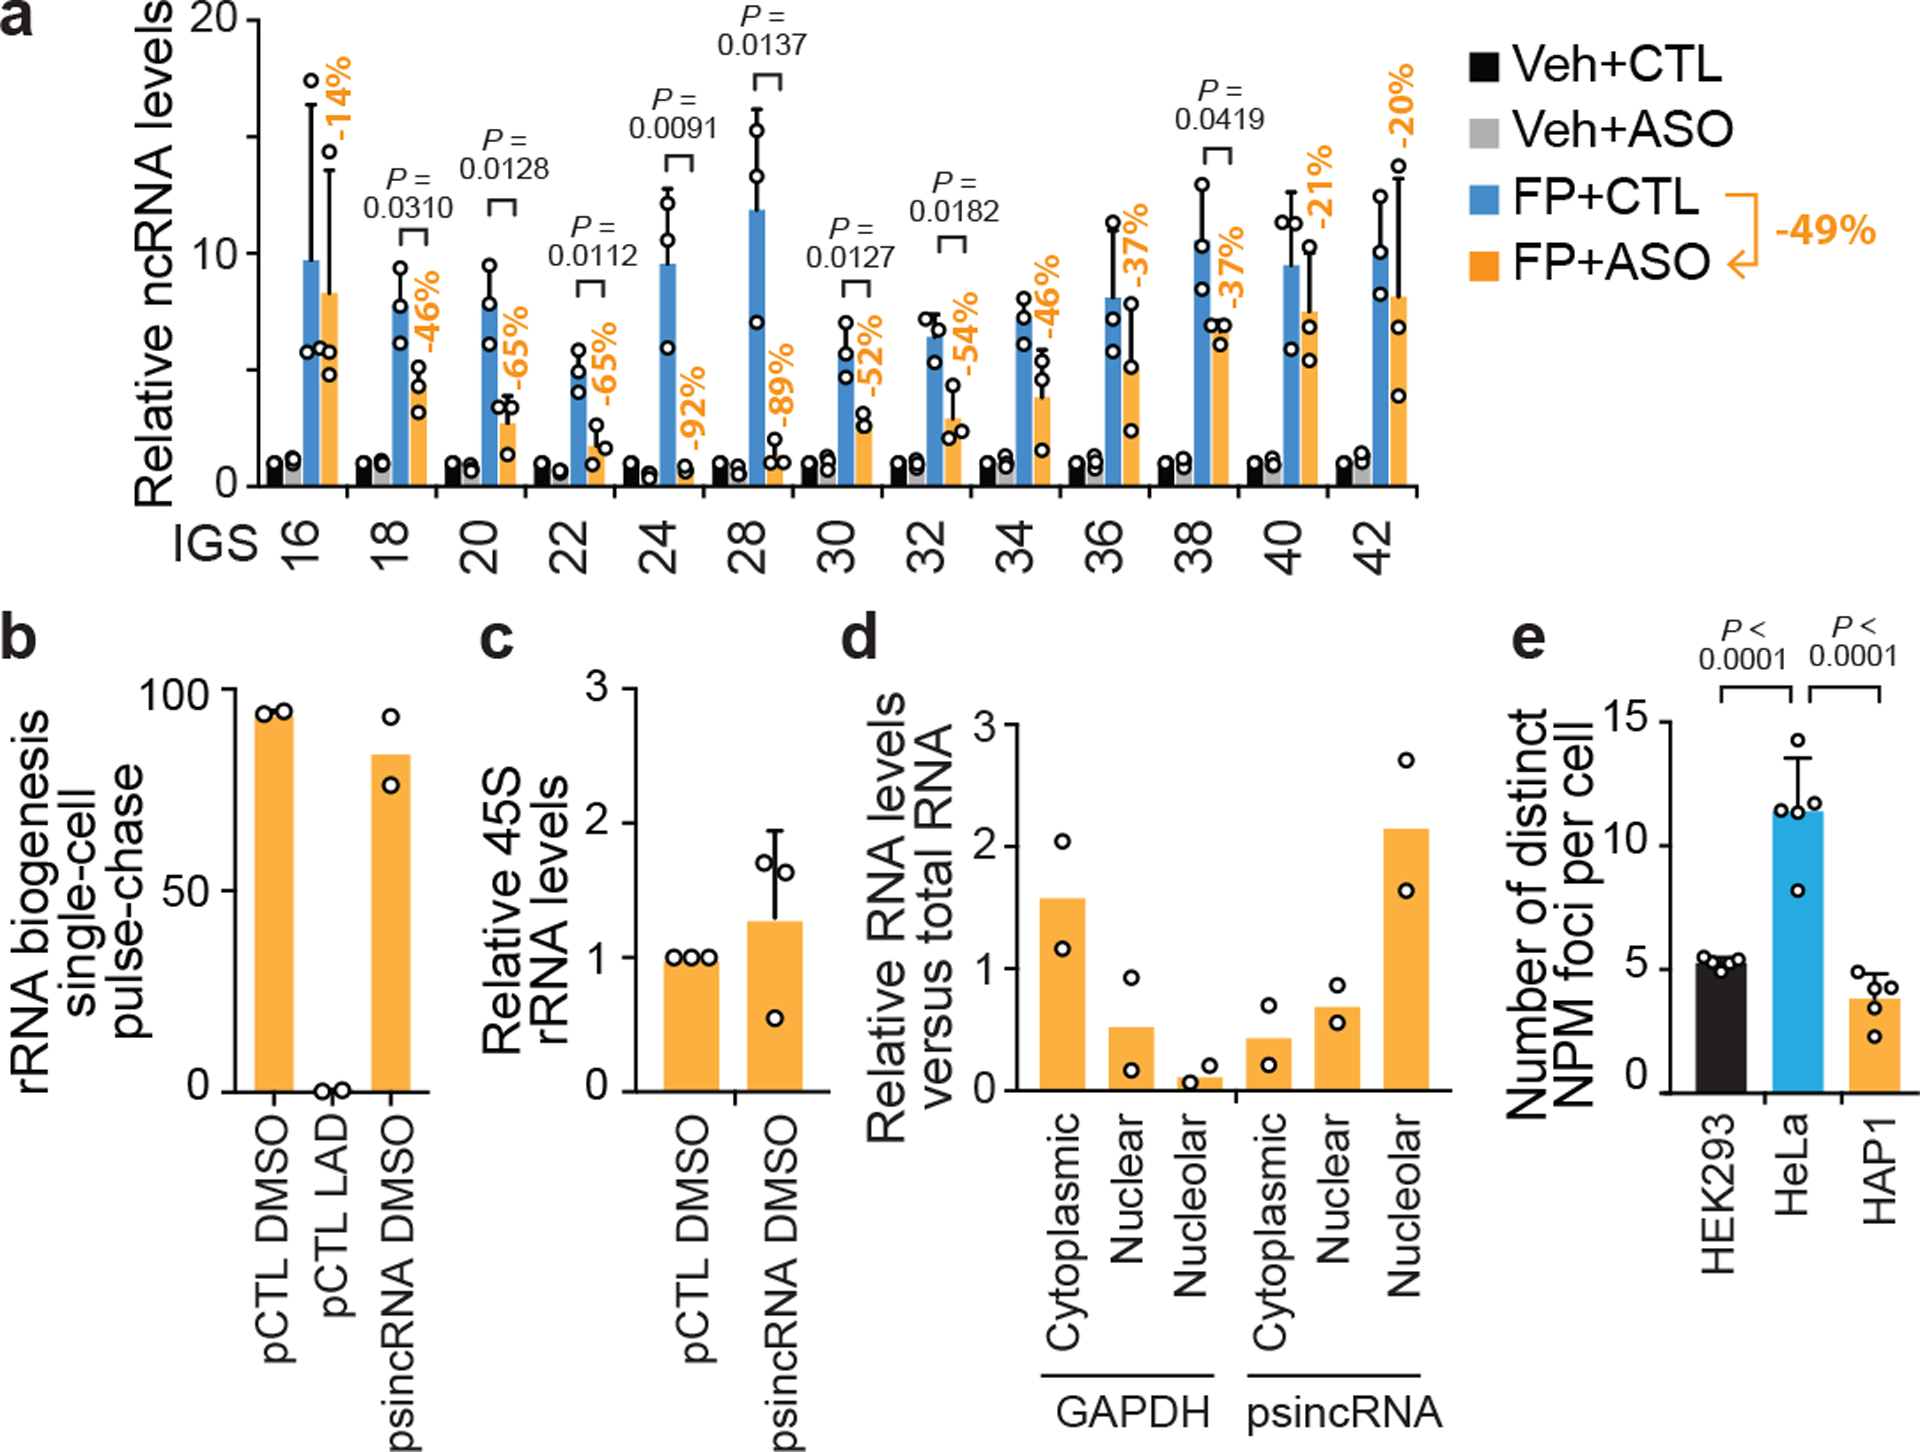
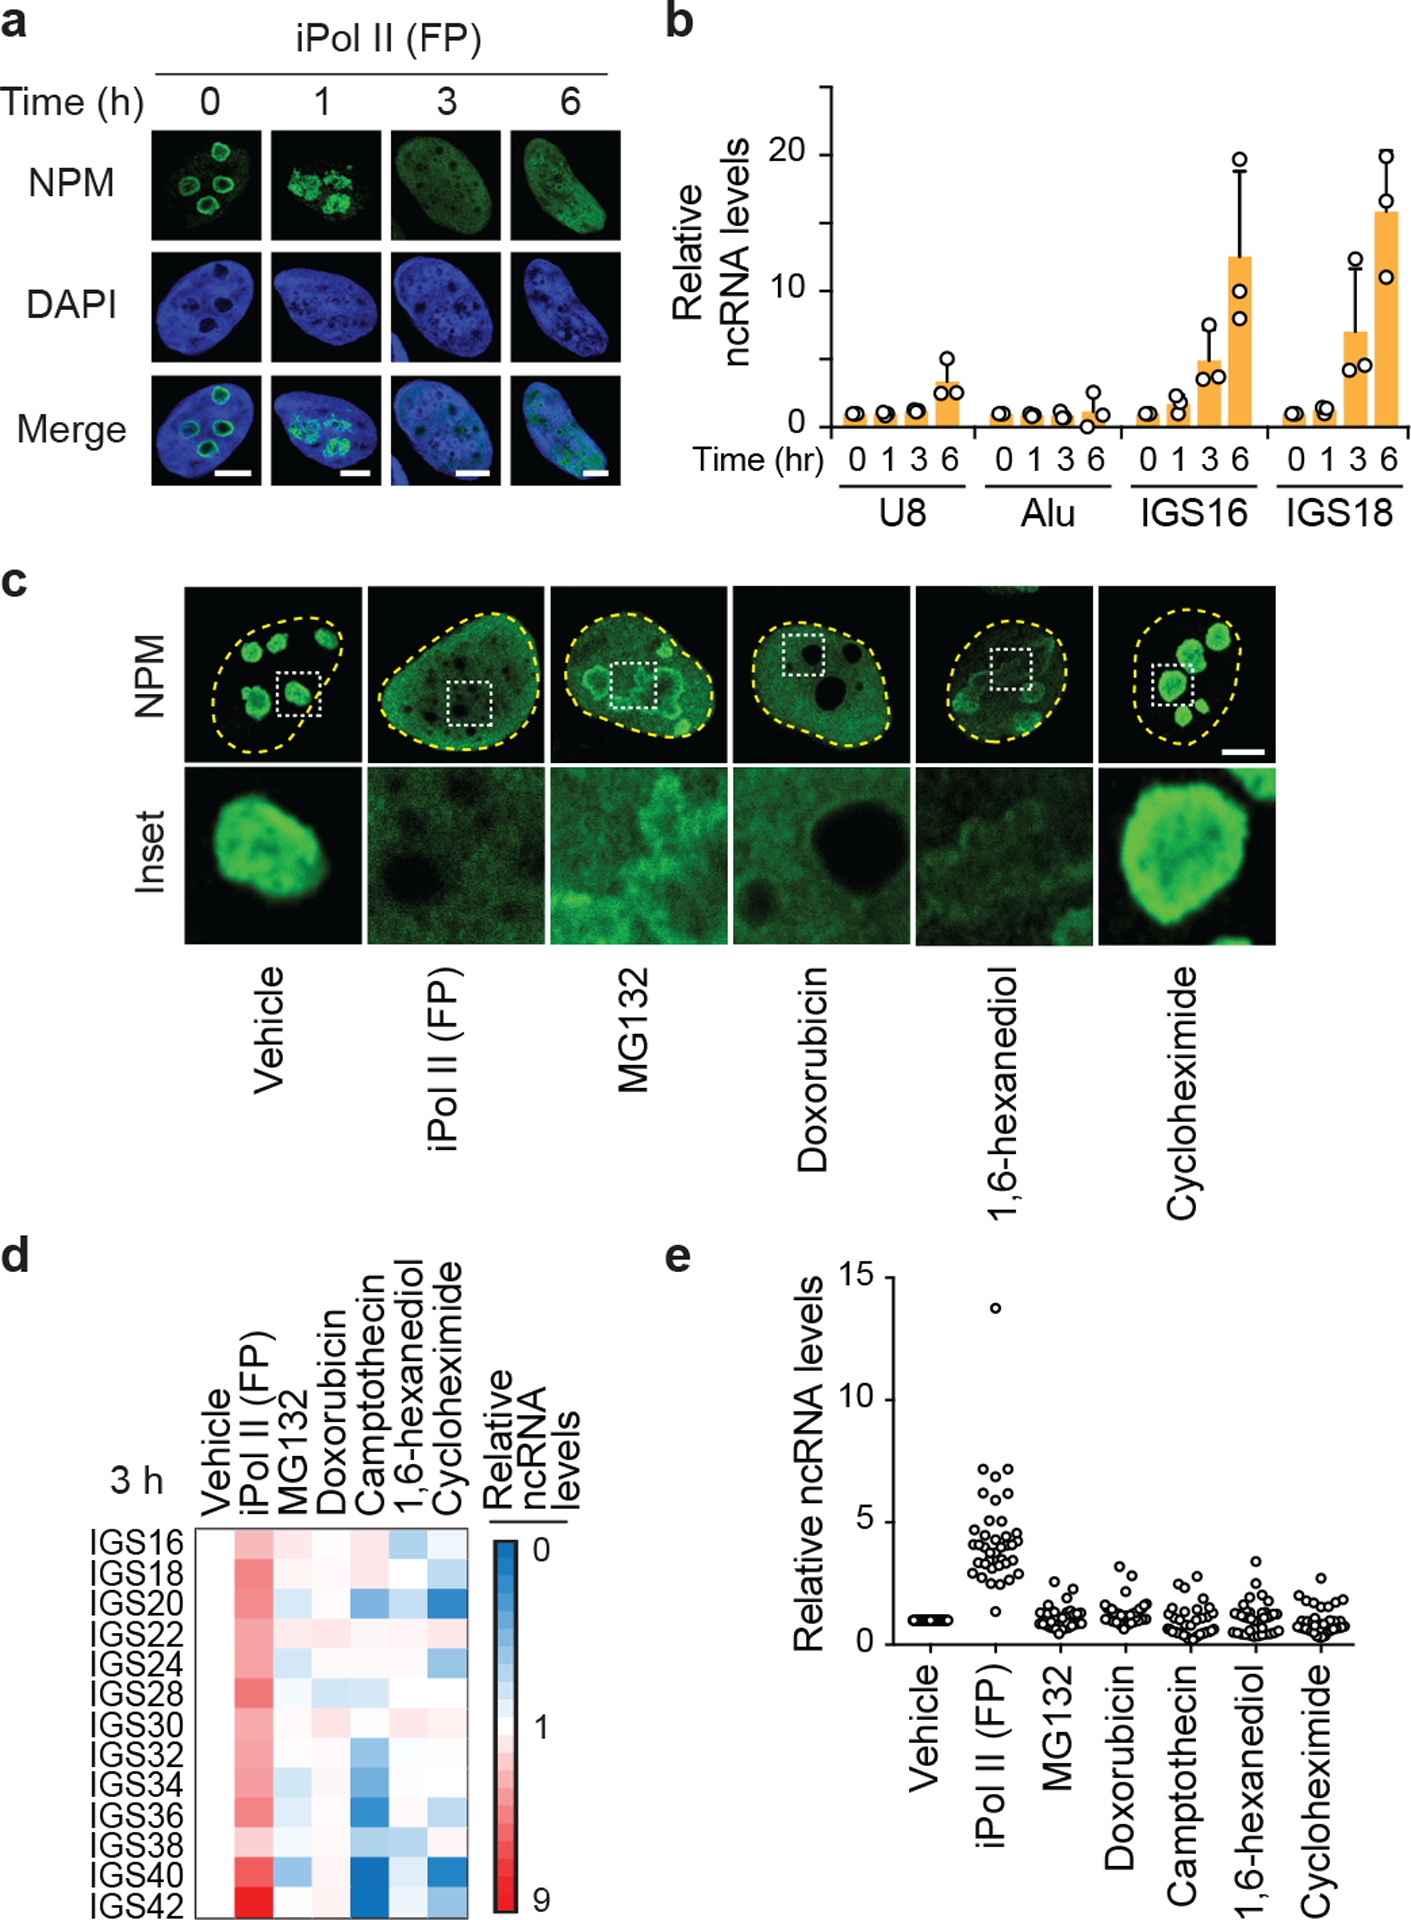
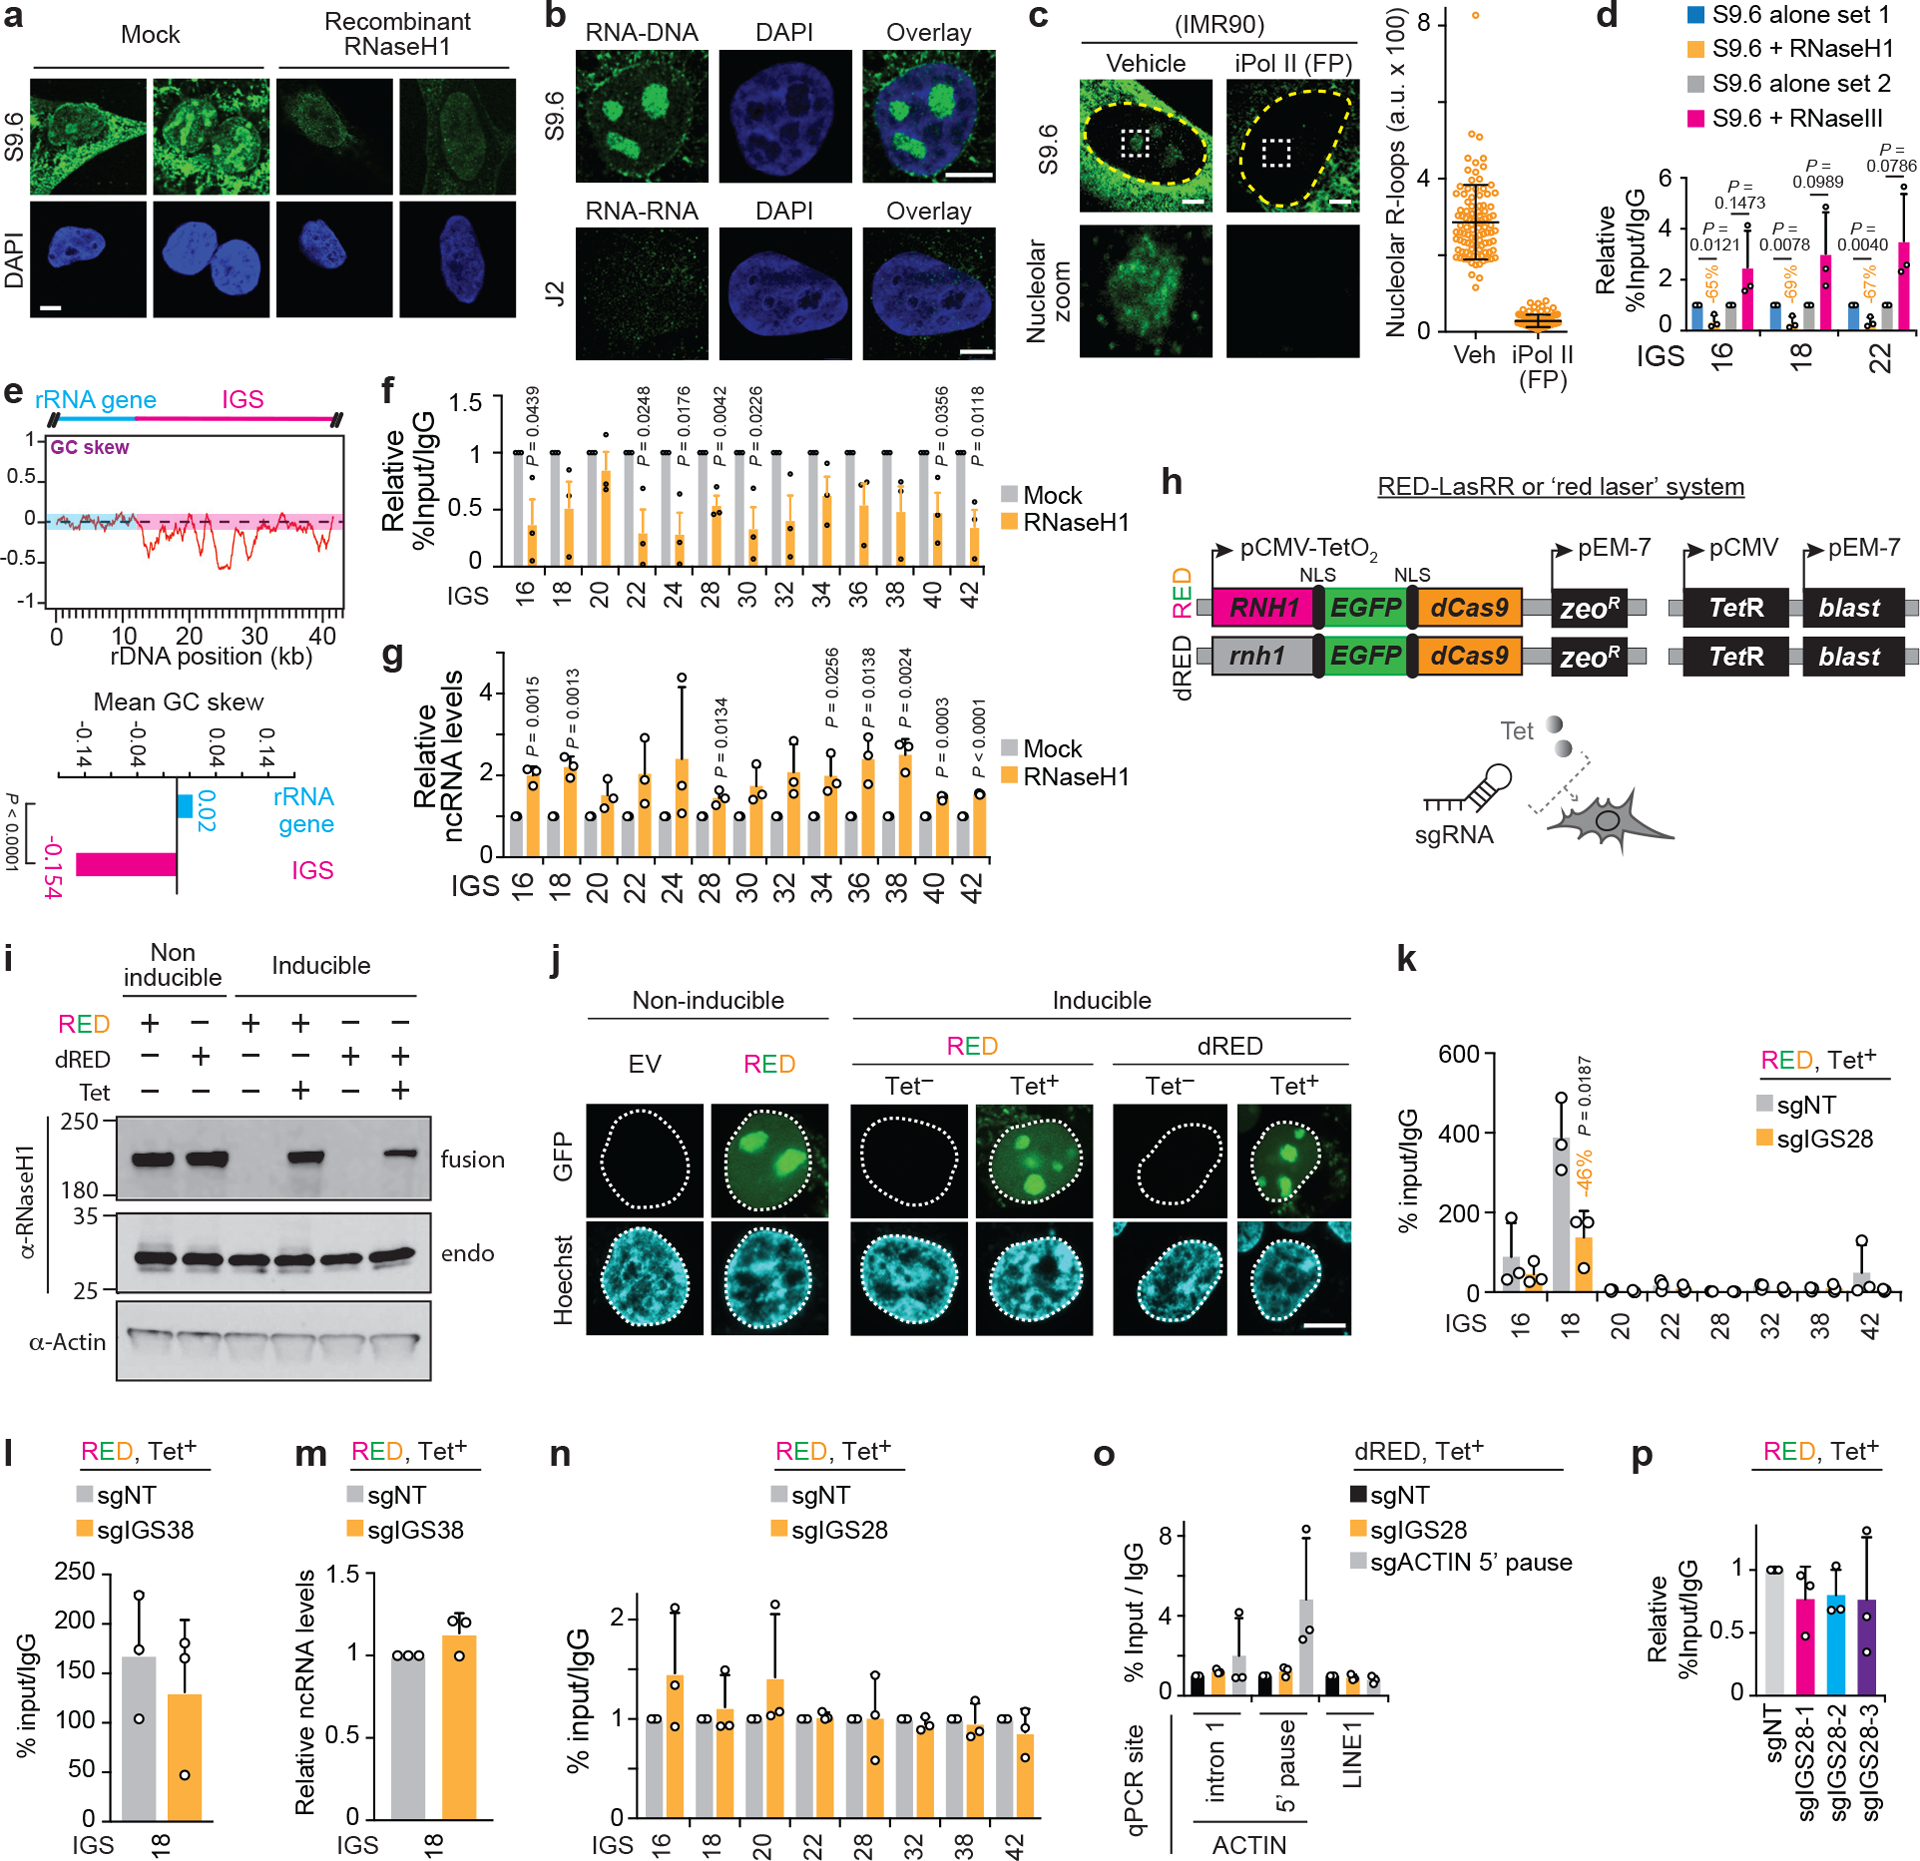
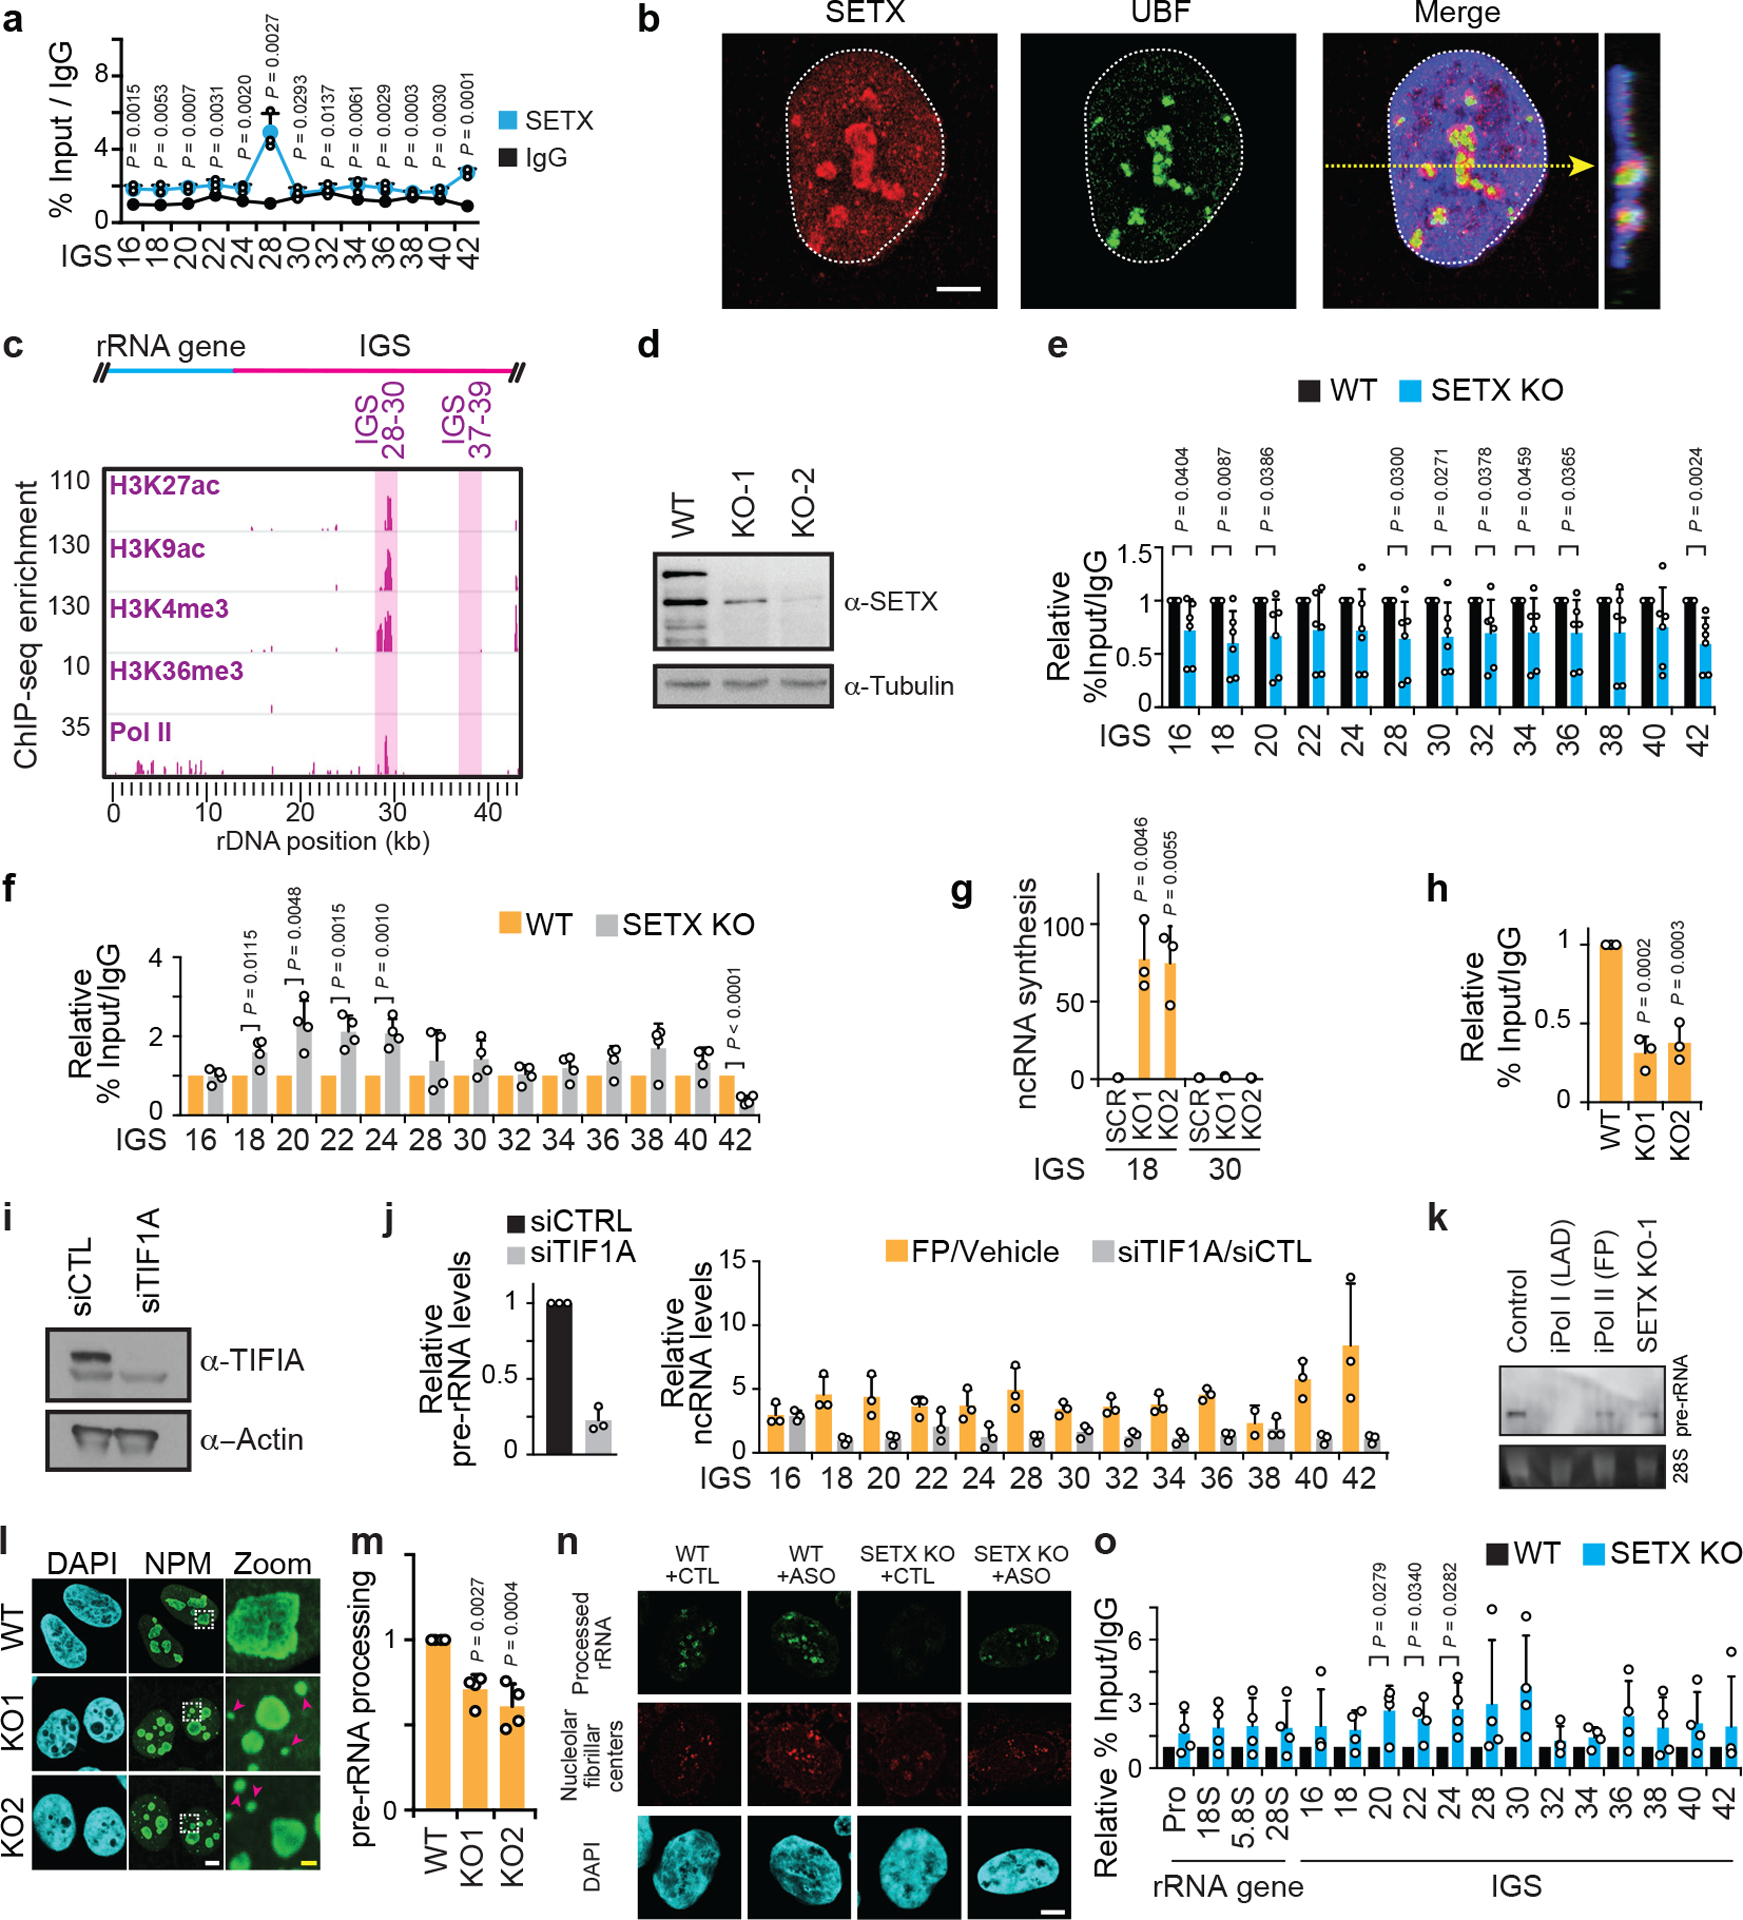
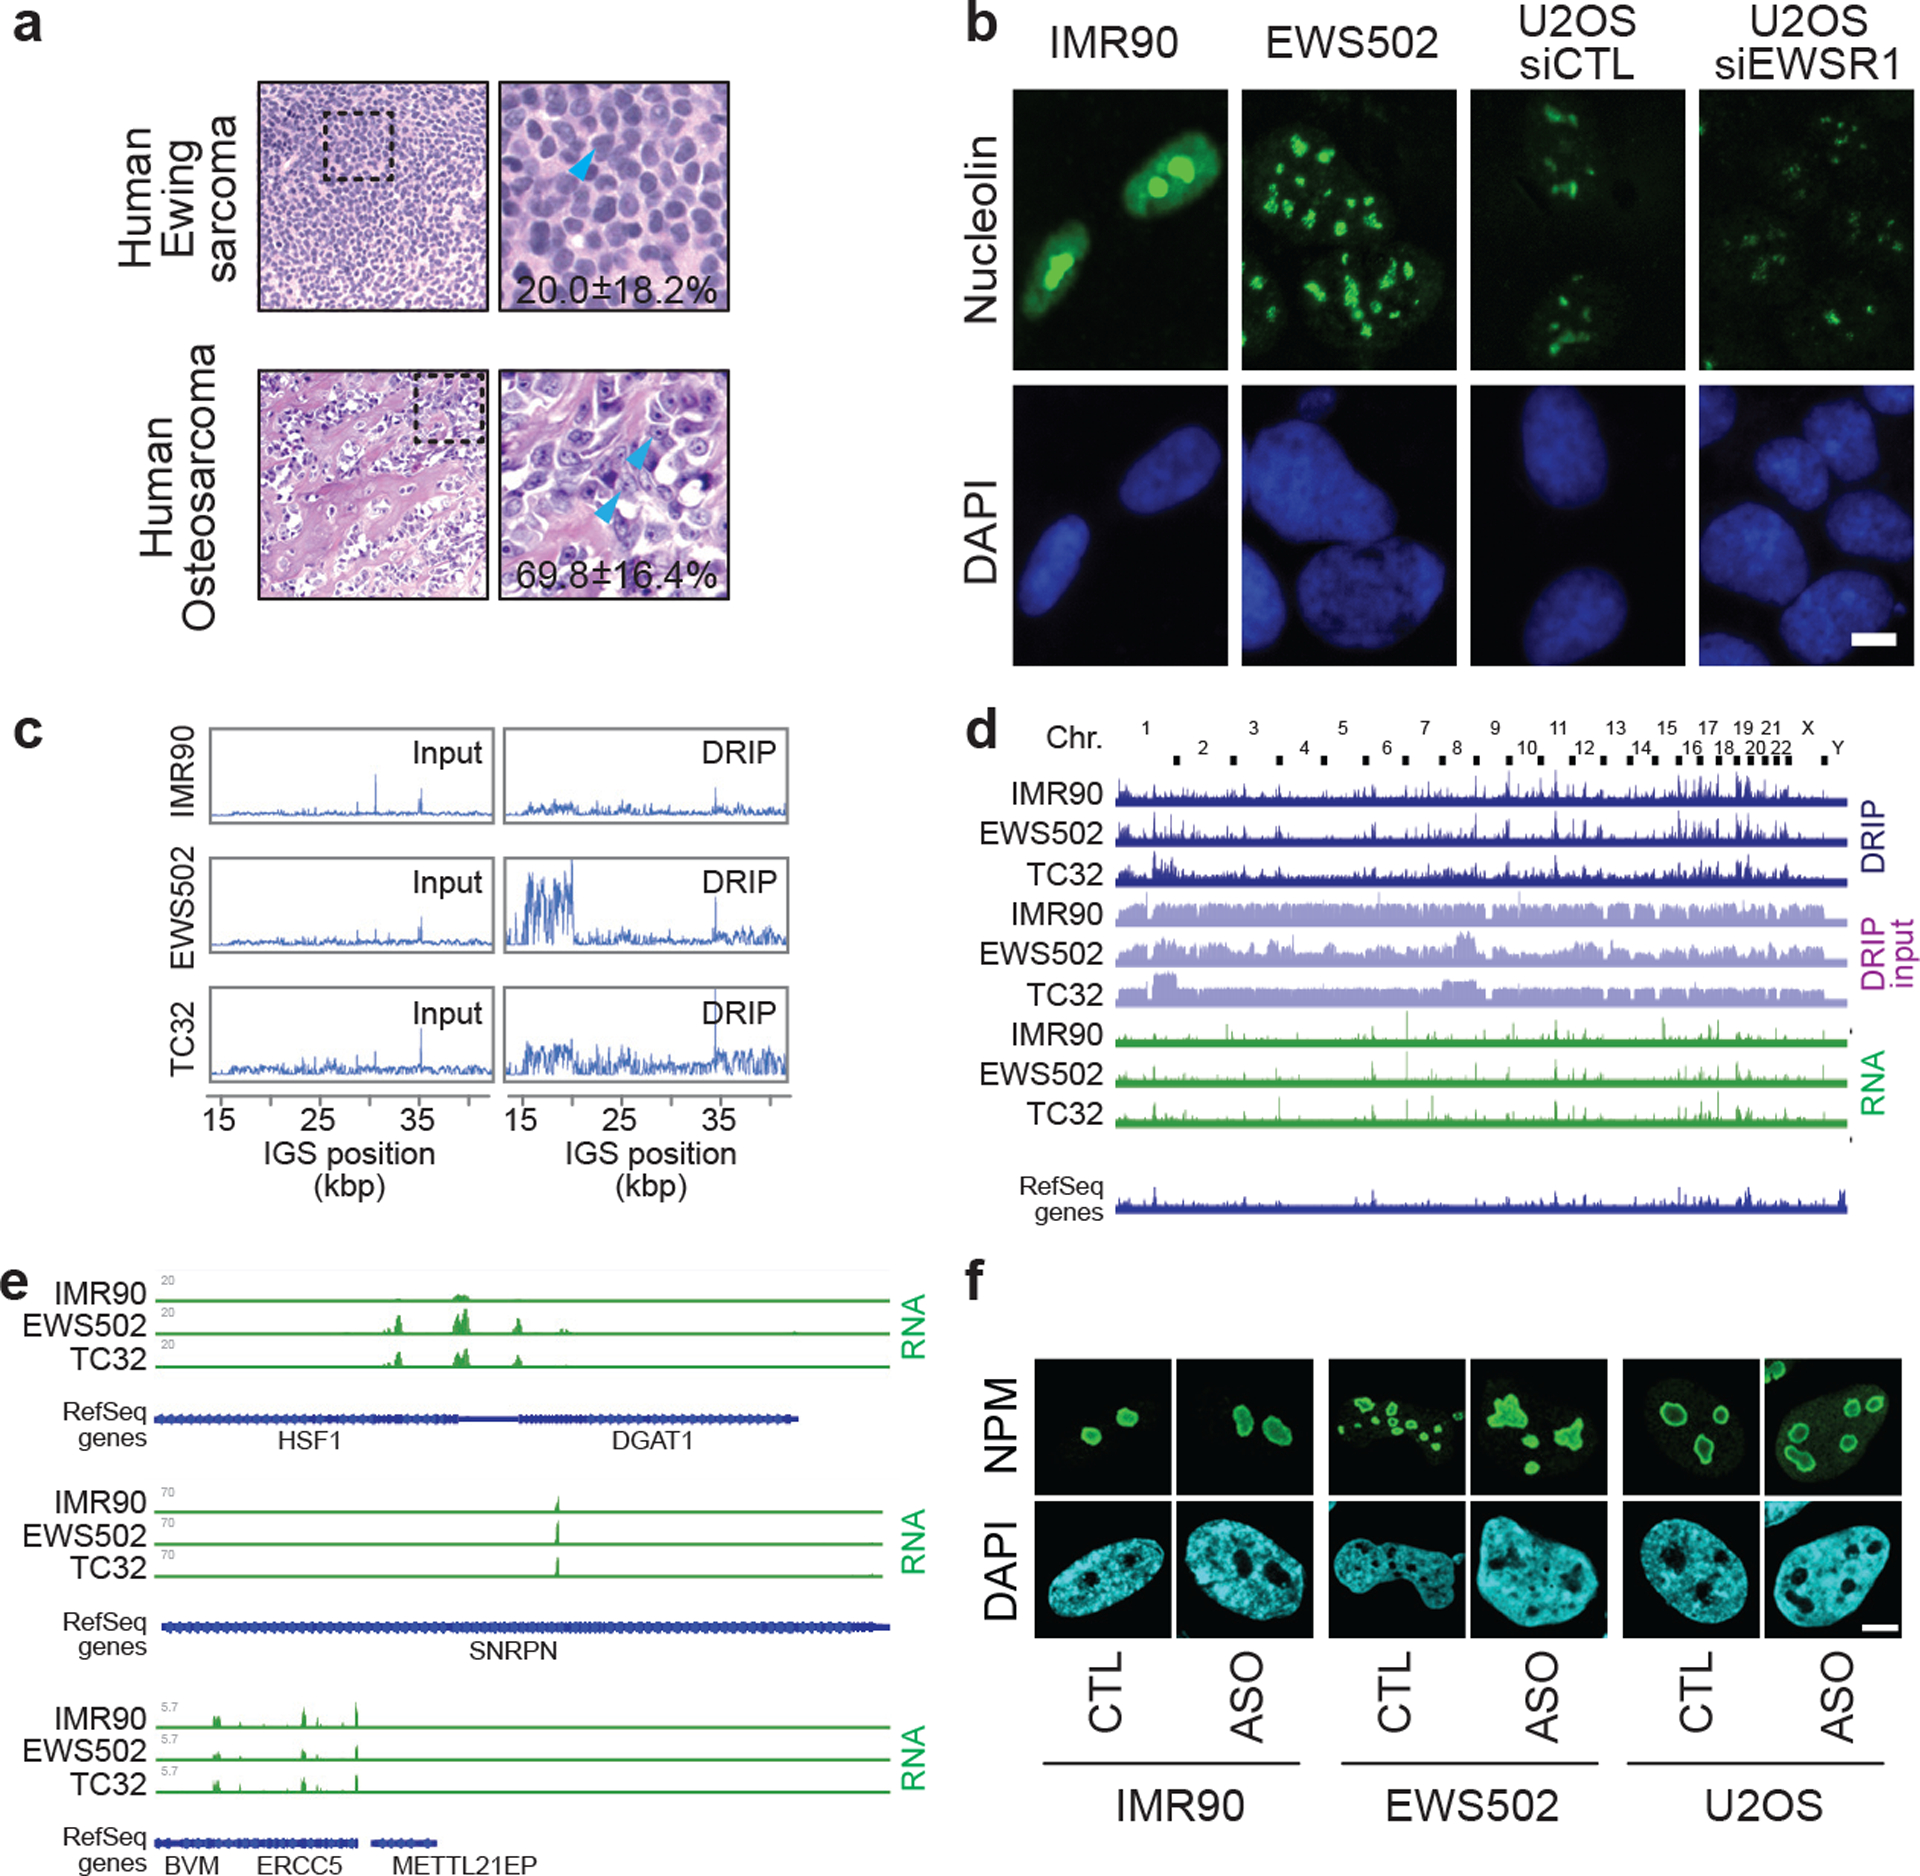
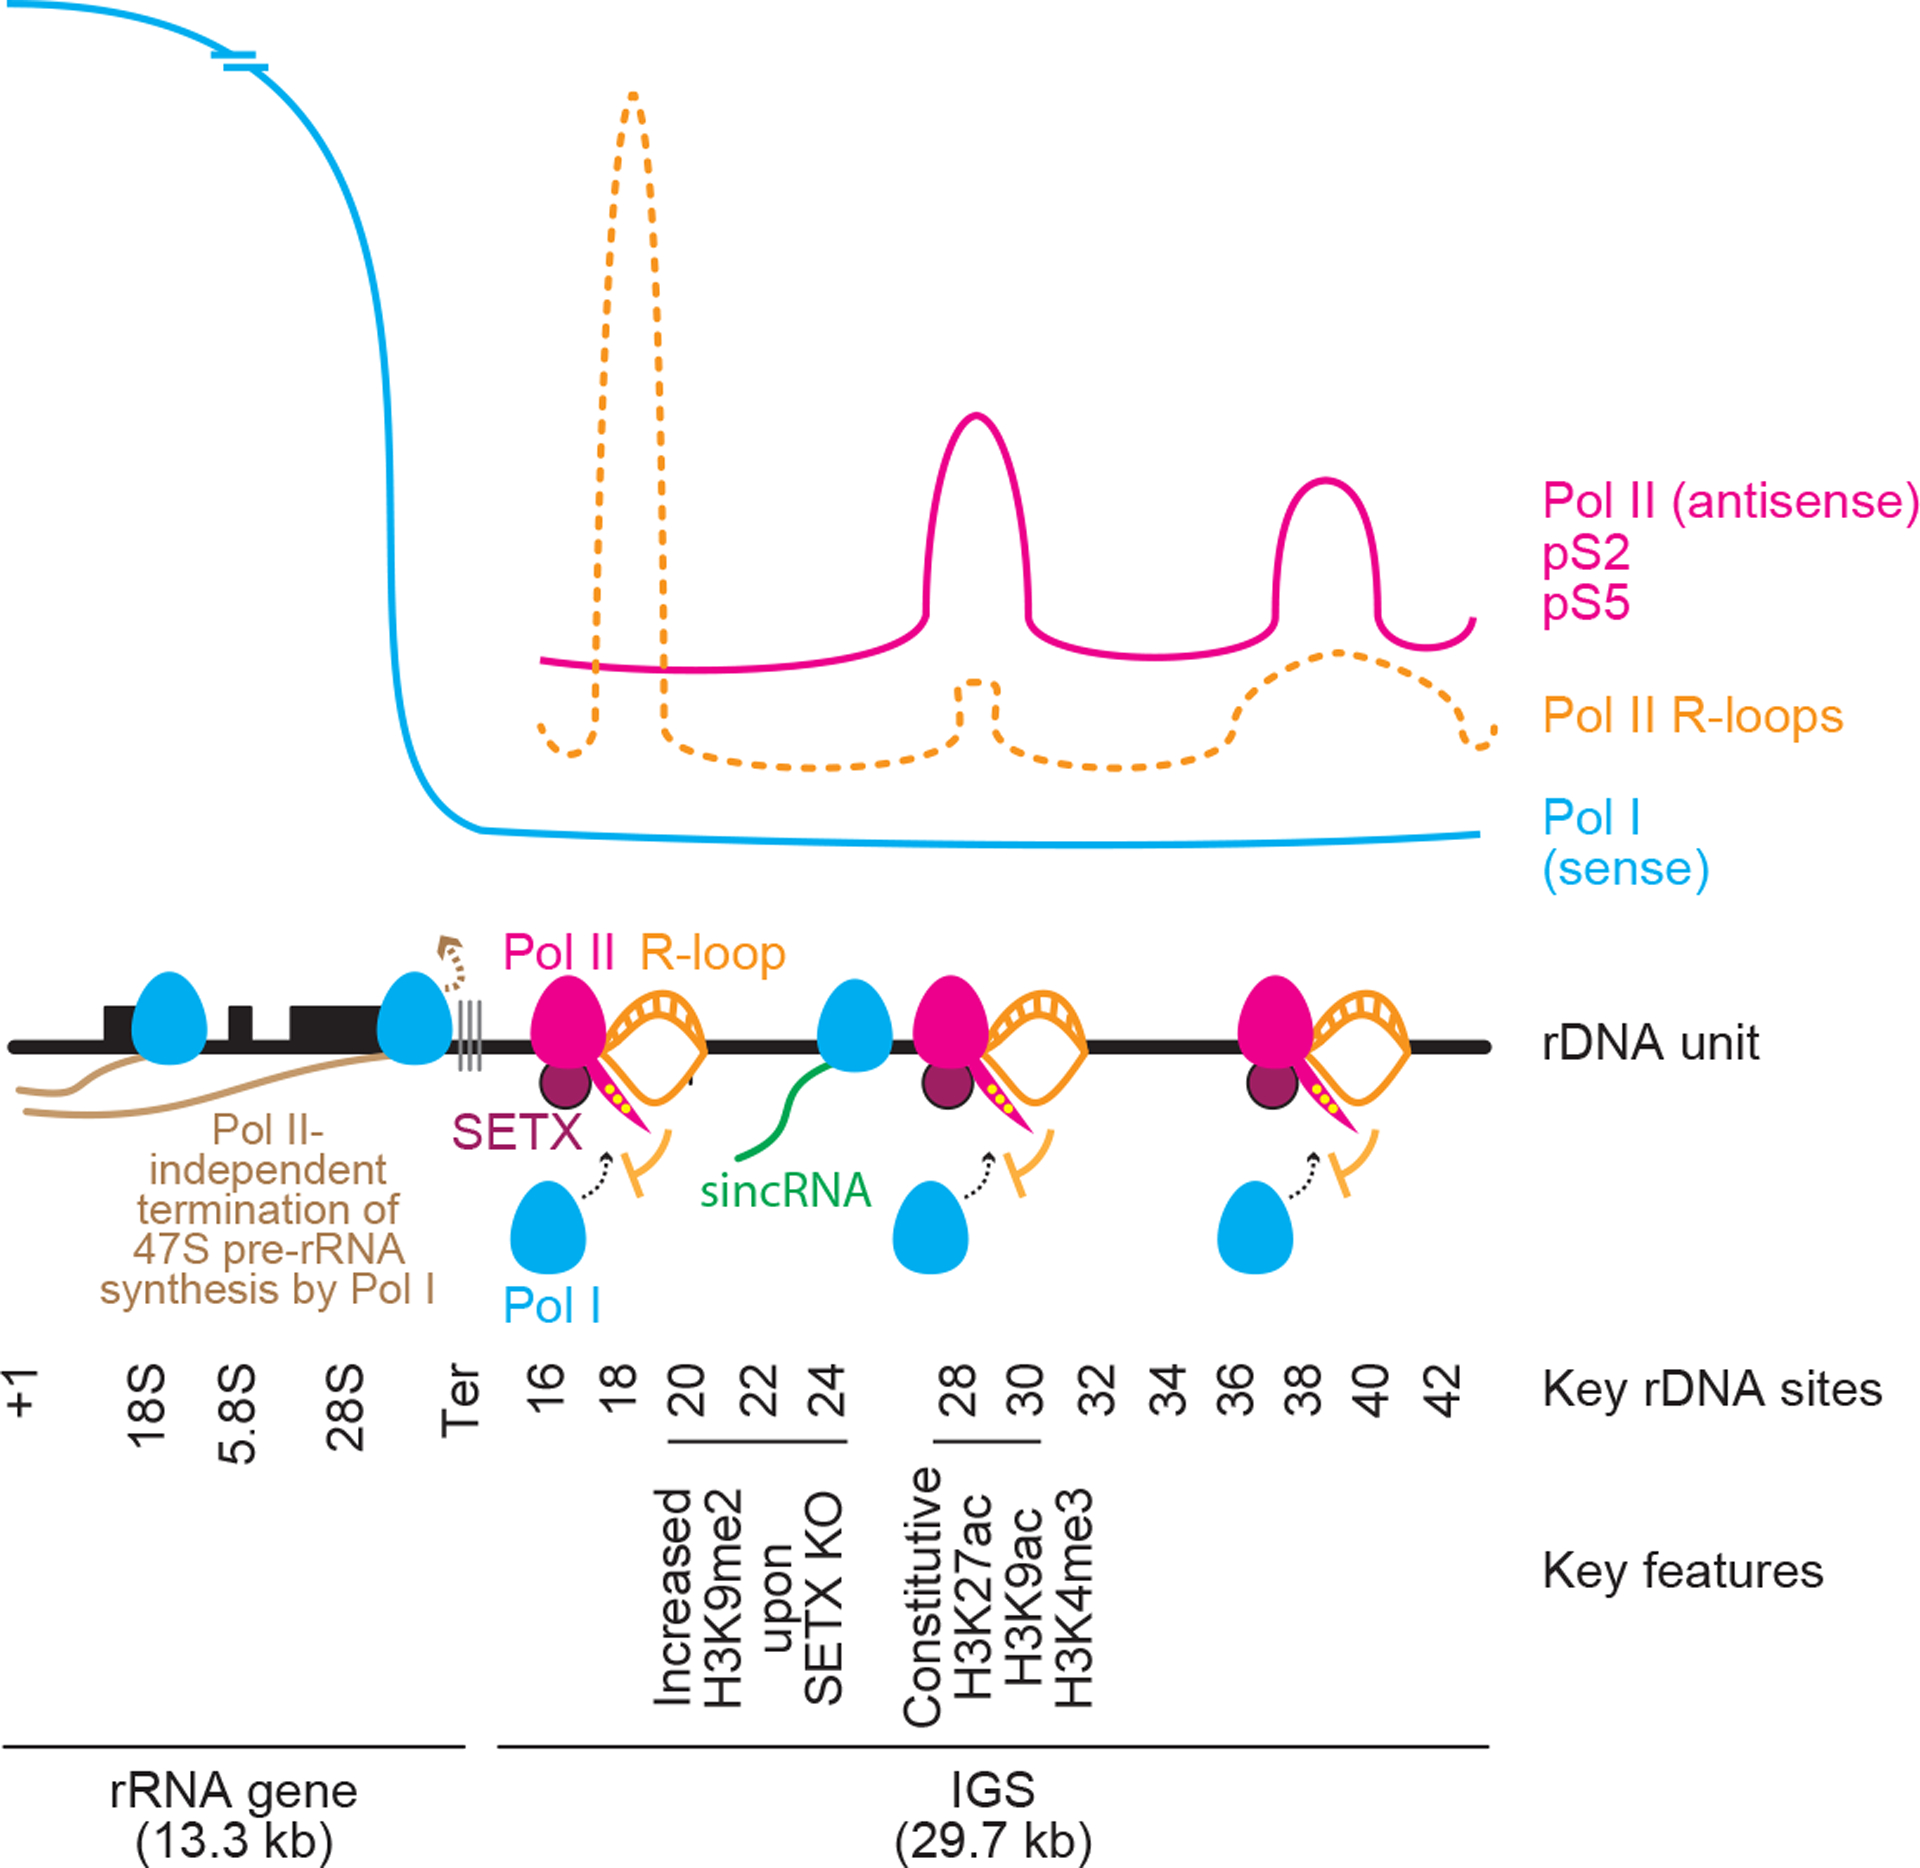
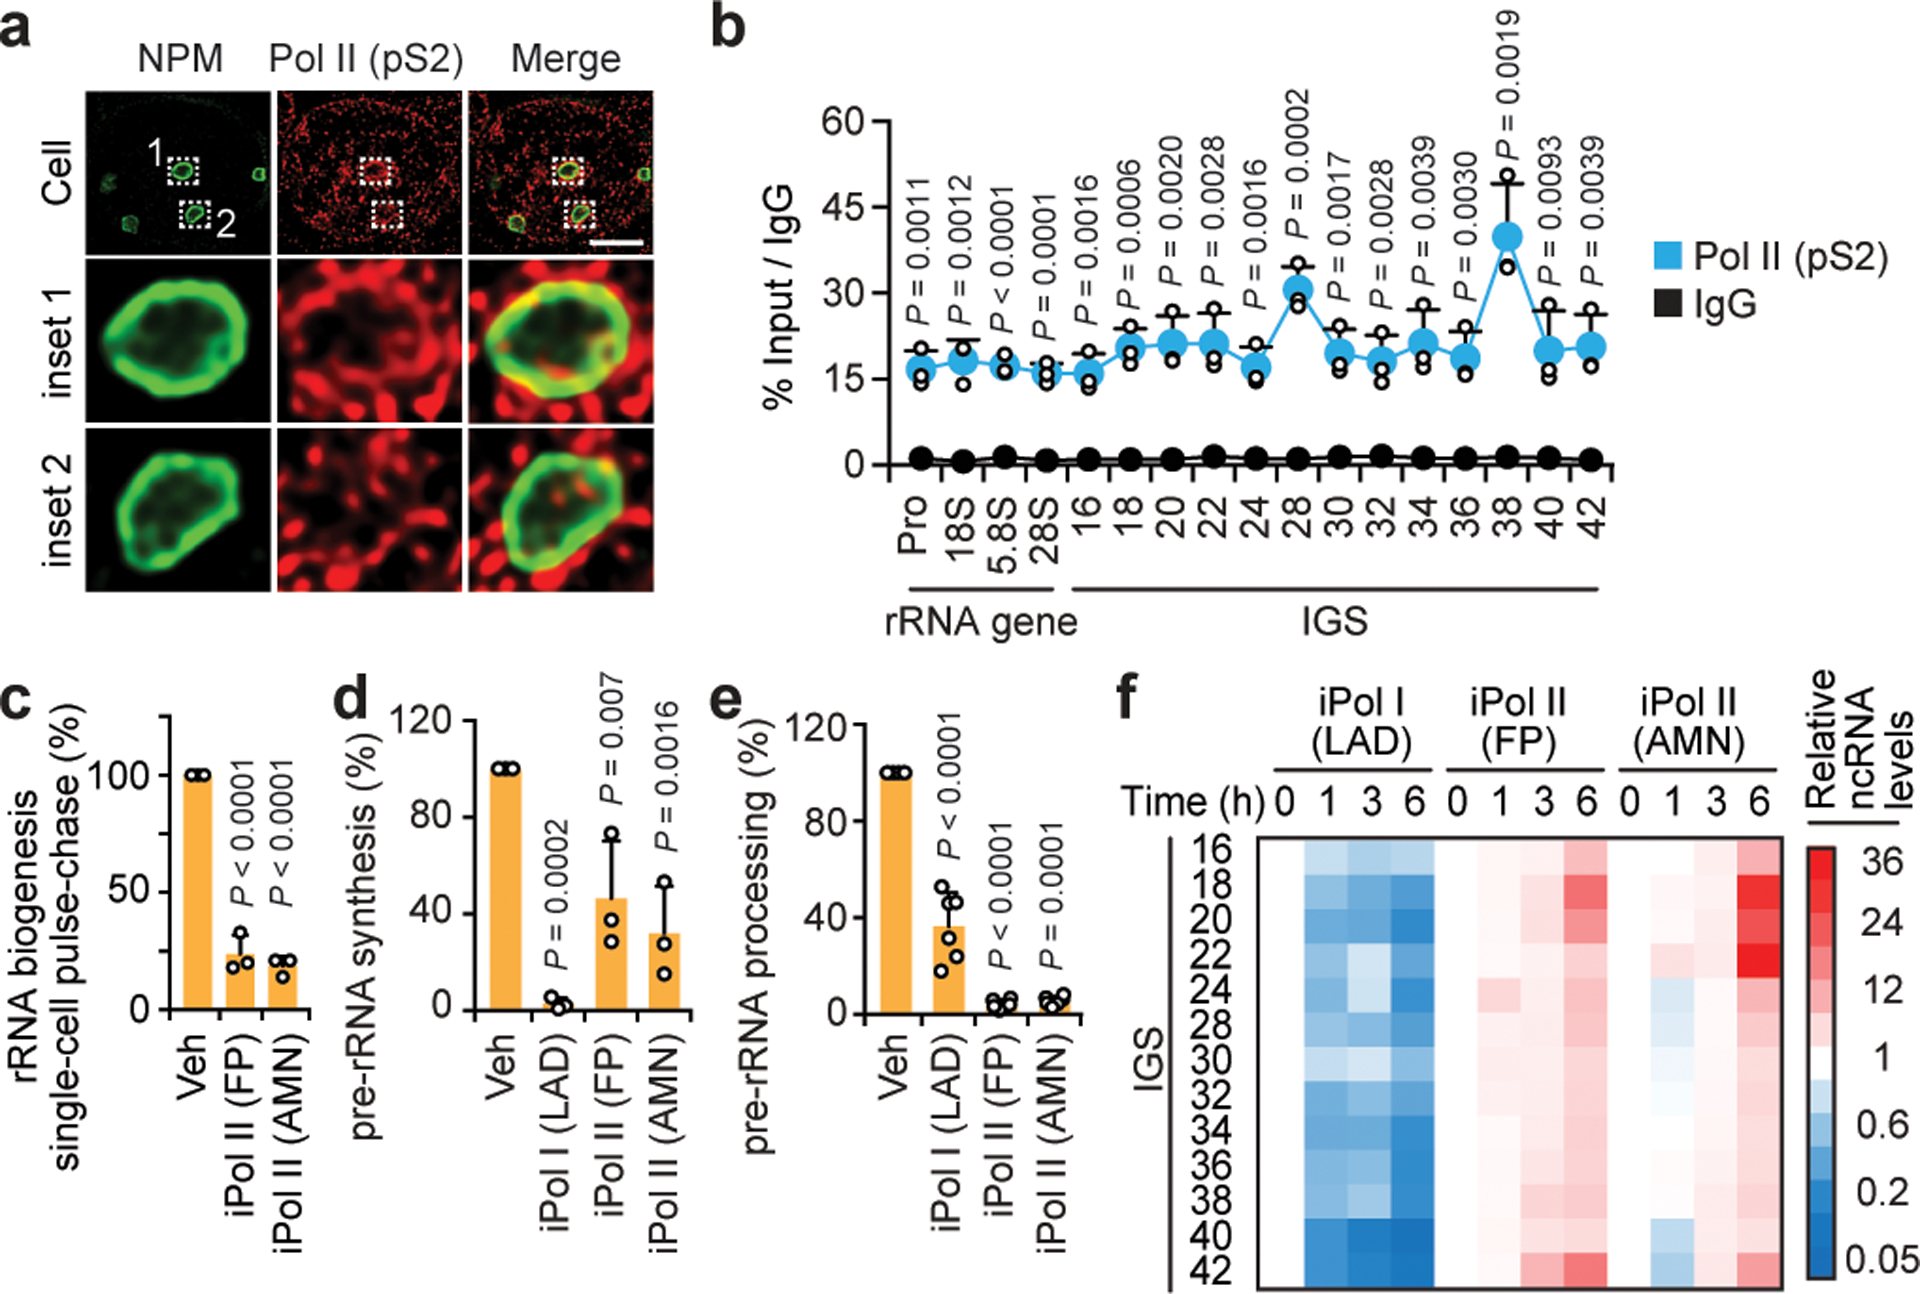
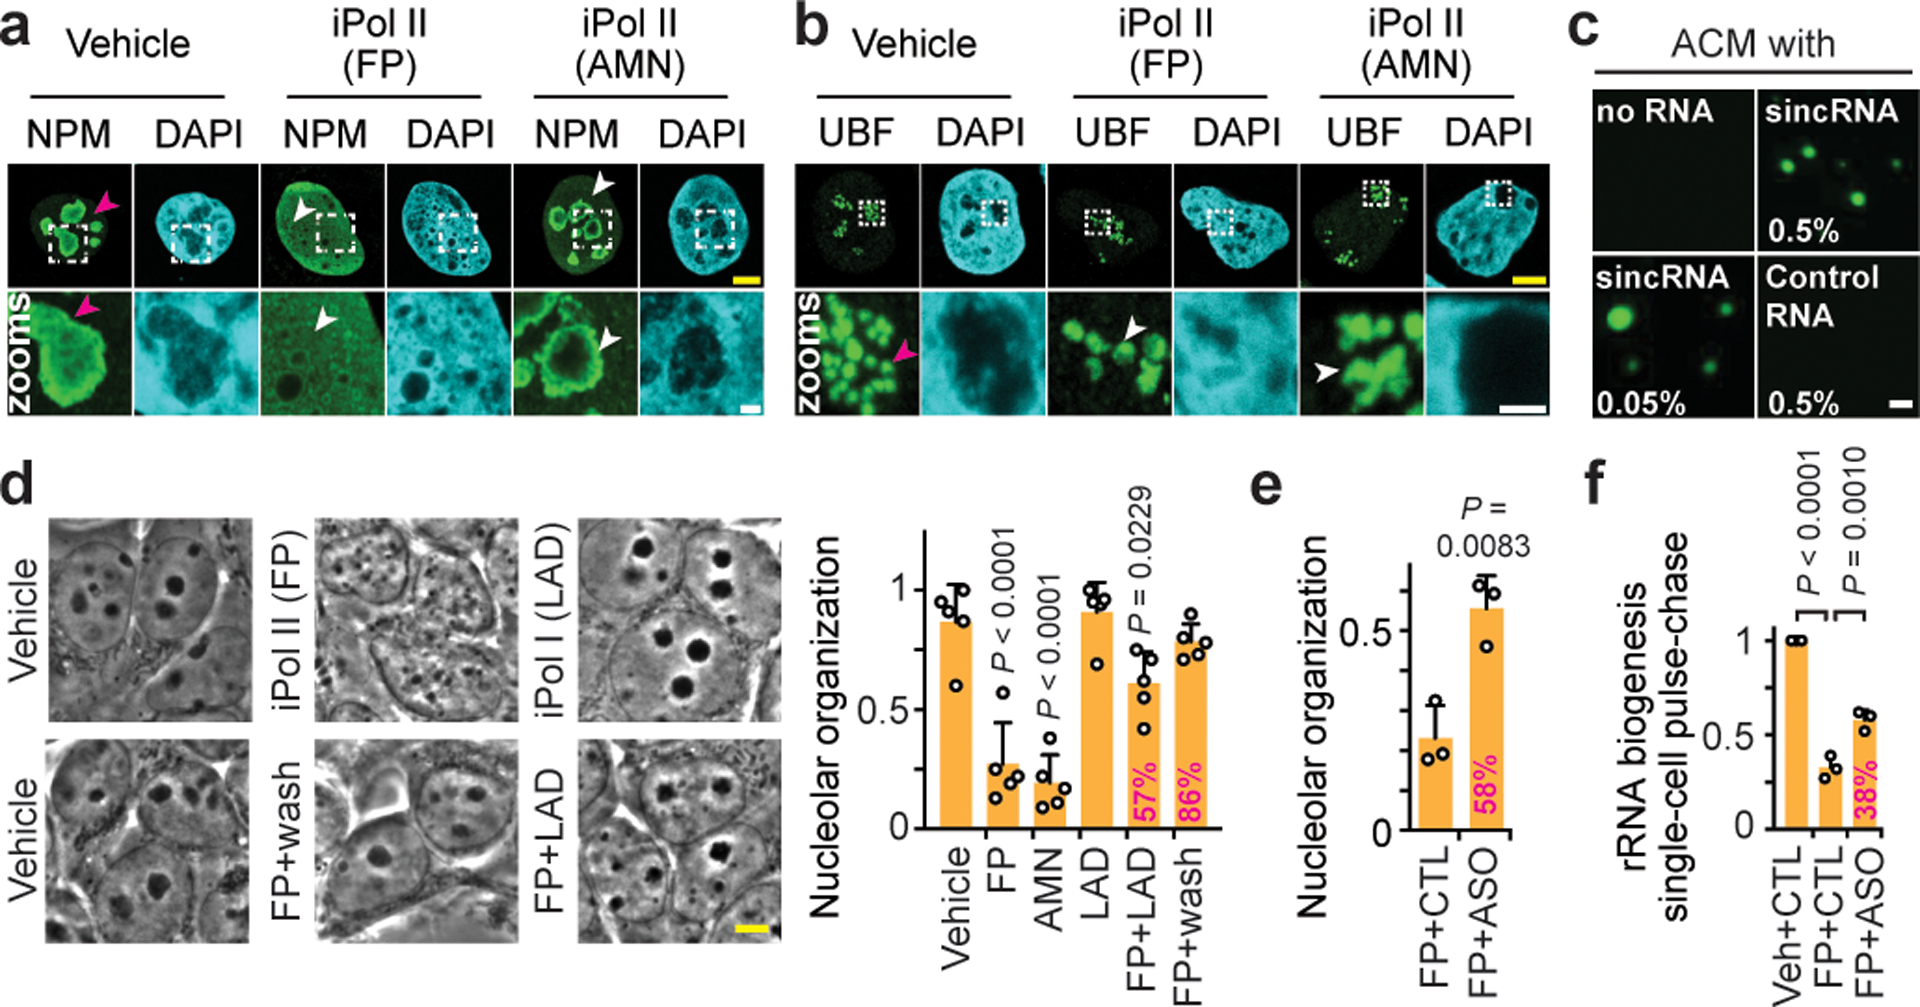
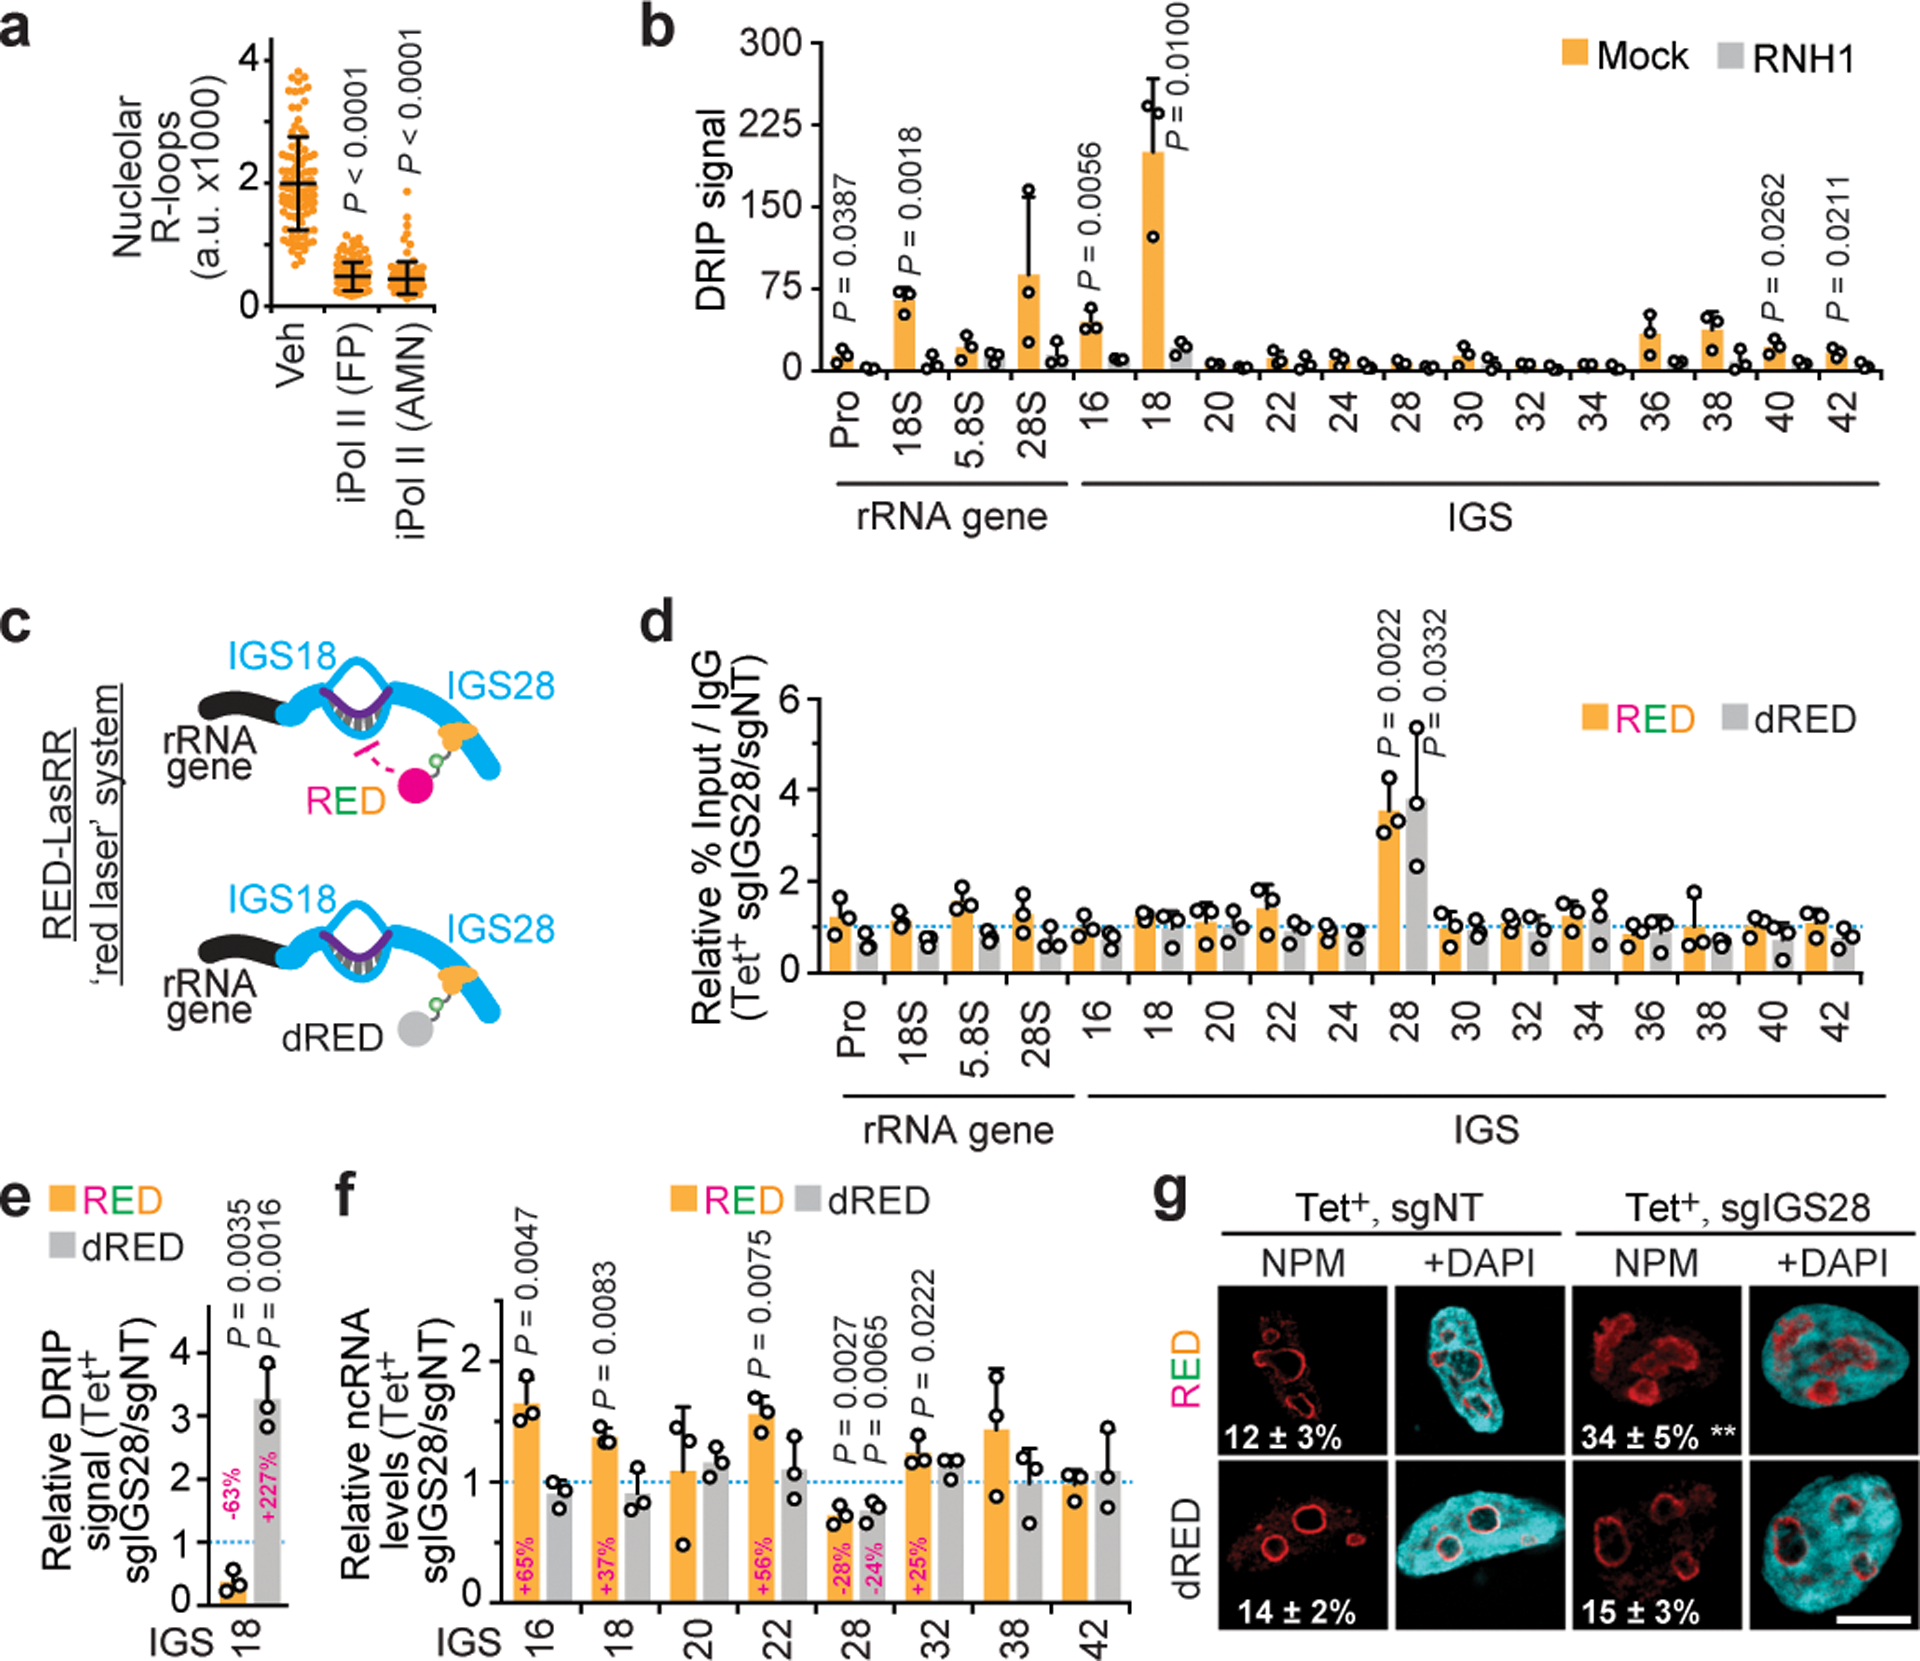
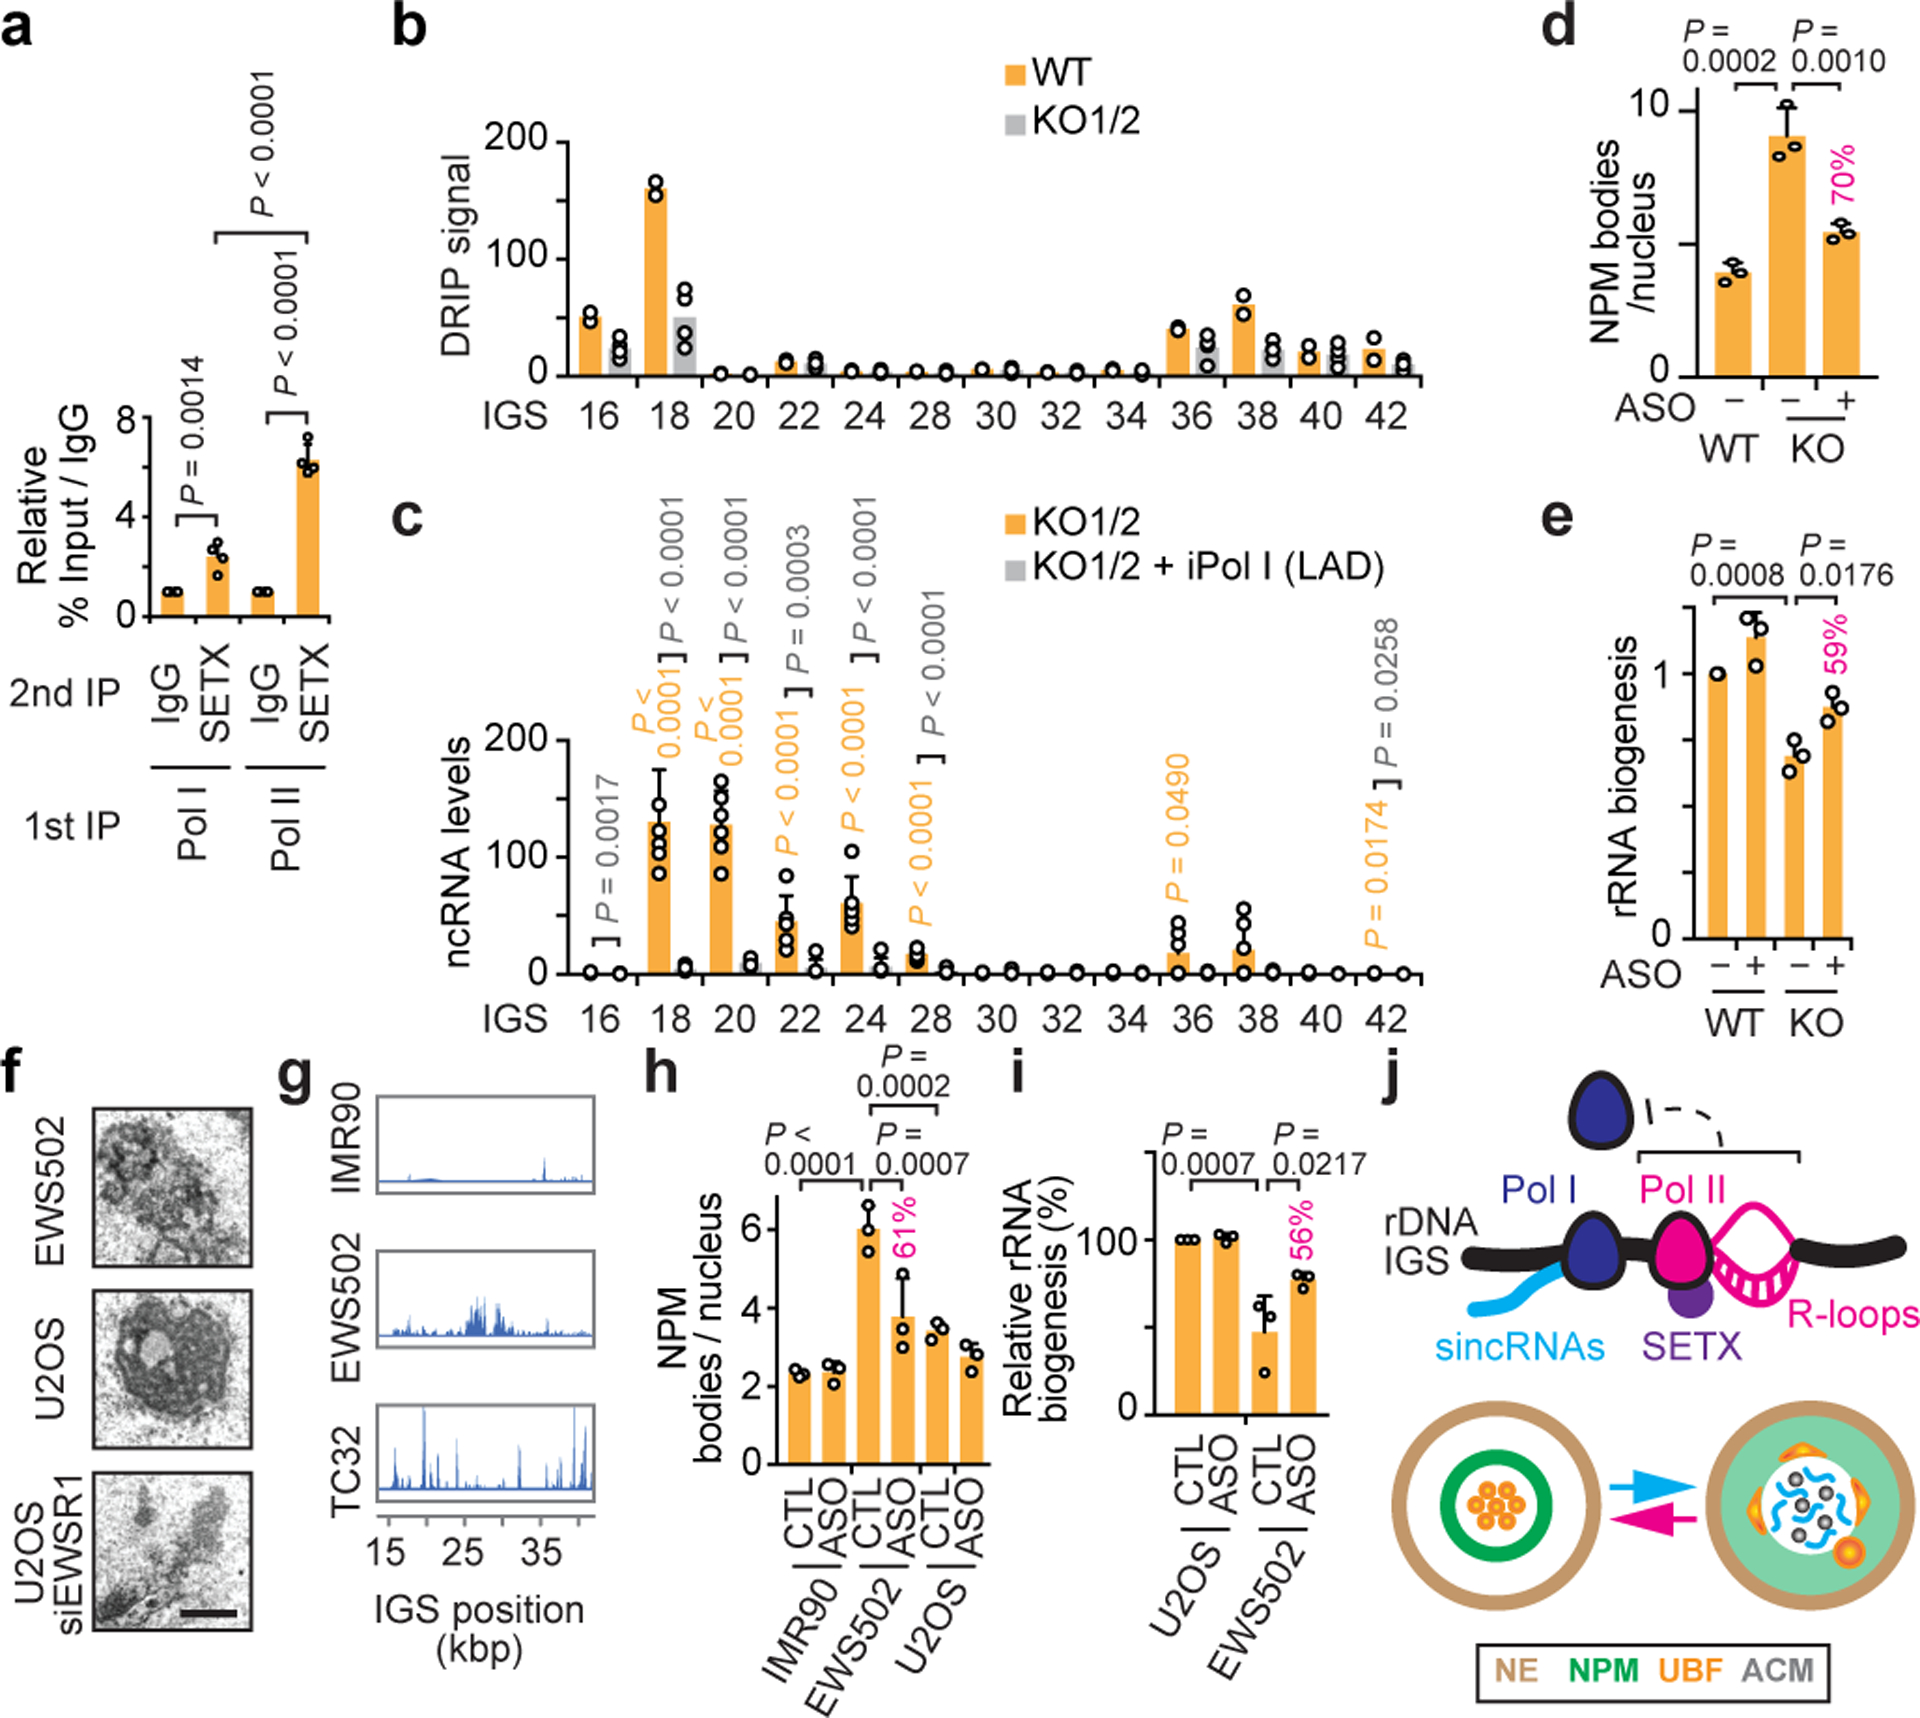
Proteins are manufactured by ribosomes-macromolecular complexes of protein and RNA molecules that are assembled within major nuclear compartments called nucleoli1,2. Existing models suggest that RNA polymerases I and III (Pol I and Pol III) are the only enzymes that directly mediate the expression of the ribosomal RNA (rRNA) components of ribosomes. Here we show, however, that RNA polymerase II (Pol II) inside human nucleoli operates near genes encoding rRNAs to drive their expression. Pol II, assisted by the neurodegeneration-associated enzyme senataxin, generates a shield comprising triplex nucleic acid structures known as R-loops at intergenic spacers flanking nucleolar rRNA genes. The shield prevents Pol I from producing sense intergenic noncoding RNAs (sincRNAs) that can disrupt nucleolar organization and rRNA expression. These disruptive sincRNAs can be unleashed by Pol II inhibition, senataxin loss, Ewing sarcoma or locus-associated R-loop repression through an experimental system involving the proteins RNaseH1, eGFP and dCas9 (which we refer to as 'red laser'). We reveal a nucleolar Pol-II-dependent mechanism that drives ribosome biogenesis, identify disease-associated disruption of nucleoli by noncoding RNAs, and establish locus-targeted R-loop modulation. Our findings revise theories of labour division between the major RNA polymerases, and identify nucleolar Pol II as a major factor in protein synthesis and nuclear organization, with potential implications for health and disease.


Conflict of interest statement

Competing interests Authors declare no competing interests.

Figures

Extended data Fig. 1 |
Extended data Fig. 1 |. Additional characterization of Pol I and Pol II occupancies at rDNA IGSs.
(a) Organization of human rDNA repeats. At each rDNA unit, Pol I transcribes an rRNA gene encoding a 47S pre-rRNA that is processed to remove transcribed spacers, such as the 5’ ETS, and generate 18S, 5.8S, and 28S rRNA molecules. The IGS constitutes the bulk of each rDNA unit. (b-c) Specificity controls indicating that targeting Pol II for degradation with a 12 h α-amanitin treatment does lower anti-Pol II (pS2) signals in both immunofluorescence (b) and immunoblotting (c). For gel source data, see Supplementary Figure 1. (d) ChIP showing Pol II-pS5 enrichment across rDNA. (e-f) The enrichment of active Pol II forms at rDNA IGS sites is higher than at LINE1 but lower than at β-ACTIN. (g-k) ChIP experiments showing the enrichment of indicated proteins across rDNA. (l) Comparison of the enrichment of RNA Pol II and Pol I across rDNA reveals the relative overrepresentation of Pol II across IGSs only. (b-l) HEK293 (b-g,j-l) or IMR90 (h,i) cells were used; data are shown as the mean±s.d.; two-tailed t-test, n=3 biologically independent experiments (d-l); images in (b-c) are representative of two independent experiments. Data in (d-f,j-l) and Fig. 1b were from large experimental sets sharing IgG controls. Data in (h,i) were from large experimental sets sharing IgG controls.
Extended data Fig. 2 |
Extended data Fig. 2 |. Impact of Pol I and Pol II on IGS ncRNA levels in various cell types.
(a) Cell population-based RNA pulse-chase assay used to assess pre-rRNA synthesis and processing. (b-c) Confirmation of the detection of pre-rRNA synthesis and processing by EU-RNA pulse-chase assays as shown in Fig. 1e,f. (d) Trypan blue exclusion assay confirms that our 3 h long Pol II inhibition regimens used in functional assays do not compromise cell viability. (e) Ponceau stain shows stable protein levels following Pol II inhibition. (f) Treatment with the fast-acting RNA Pol II inhibitor flavopiridol (FP) for 30 min is sufficient to abrogate pre-rRNA processing. (g) Human IGS ncRNAs are also detected across the IGSs of diploid HeLa cells and haploid HAP1 cells. (h) Pol I promotes and Pol II represses IGS ncRNAs in HeLa cells. (i) Nuclear run-on assay showing Pol II inhibition-mediated de novo IGS ncRNA synthesis. (j,k) RT showing the effect of combining Pol I and Pol II inhibition on IGS ncRNAs in HEK293 cells (j) and IMR90 cells (k). (l-m) Strand-specific RT-qPCR (ss-RT) showing the levels of sense and antisense intergenic ncRNAs (l) and their derived sense/antisense ratio (m) at various IGS sites. (n) ss-RT shows that Pol I inhibition decreases and Pol II inhibition increases the sense/antisense ratio of the most abundant IGS ncRNAs. (o) Despite the preferential enrichment of Pol II over Pol I across IGSs, Pol II is the least overrepresented relative to Pol I closer to IGS16 compared to all other IGSs tested. (a-o) HEK293 cells unless otherwise indicated; data are shown as the mean±s.d.; two-tailed t-test (b-d,f) or one-way ANOVA with Dunnett’s multiple comparison test (g,i-k); n=2 biologically independent experiments (b), n=4 biologically independent experiments (c,f), and n=3 biologically independent experiments (d, g-o) except sense IGS18 for which n=2 biologically independent samples (l,m); image in (e) is representative of two independent experiments.
Extended data Fig. 3 |
Extended data Fig. 3 |. Characteristics of nucleoli and nucleolar proteins in the presence or absence of Pol II inhibition.
(a-b) Schematic of a nucleolus illustrating the localization of liquid-liquid phase-separated nucleolar subcompartments marked by the resident proteins NPM and UBF (a), which are highly disordered as revealed using the predictor of natural disordered regions (PONDR) algorithm (b). (c) Effects of Pol II inhibition on NPM localization shown by immunofluorescence microscopy. Examples of normal and defective phenotypes are respectively marked by magenta and white arrowheads. (d) Quantification of the percentage of cells that have any NPM phase-separated body revealed that the fast-acting Pol II inhibitor flavopiridol (FP) completely disrupts nucleoli before the slower-acting Pol II inhibitor α-amanitin (AMN). Not depicted on the graph, is the percentage of cells with perturbed nucleolar architecture as evidenced by NPM1 ruffling, which increased from 0.6±4.6% to 63.3±5.7% following the 1 h FP treatment. (e) Pol II inhibition also disrupts NPM localization in IMR90 cells. (f) Effects of Pol II inhibition on UBF localization shown by immunofluorescence microscopy. Examples of normal and defective phenotypes are respectively marked by magenta and white arrowheads. (g) Quantification of the percentage of cells that have any punctate UBF localization confirmed that the fast-acting FP completely disrupts nucleoli before the slower-acting AMN. (h) Pol II inhibition triggers various aberrant UBF localization phenotypes as shown in representative images. (i) Global nucleolar disruption following Pol II inhibition as revealed by phase contrast microscopy. The fraction of the cells with more than three black nucleolar bodies is indicated. (j) Live-cell UBF fluorescence recovery after photobleaching (FRAP). Mock control cells were continuously imaged without a photobleaching step. FRAP FP/Vehicle rate constant ratio = 2.3. (k) Formerly nucleolar space became Congo Red positive after Pol II inhibition. (c-k) HEK293 cells were used unless otherwise indicated; data are shown as the mean±s.d.; one-way ANOVA with Dunnett’s multiple comparisons test, n=3 biologically independent experiments (d, g) or n=5 biologically independent experiments (i); For (j), vehicle FRAP cells n=30, vehicle control cells n=4, FP FRAP cells n=15, and FP control cells n=6; images in (e,h,k) are representative of two independent experiments. Scale bars, 5 μm (yellow) or 1 μm (white).
Extended data Fig. 4 |
Extended data Fig. 4 |. Heat shock limits asincRNAs and triggers sincRNA-dependent nucleolar phase transitions.
(a) Heat shock (43°C) rapidly induces the formation of intranucleolar liquid droplets harbouring the amyloid-converting protein motif (ACM)-containing VHL protein. (b) Gradual amyloid body (A-body) formation. The stress-induced, mobile, and spherical liquid-like foci (yellow arrowhead) gradually transition into irregularly shaped solid-like amyloid bodies (cyan arrowhead) in cells subjected to heat shock (43°C). (c) The appearance of early stage ACM-marked liquid-like foci, in cells subjected to a 15 min heat shock treatment is abrogated upon siRNA-mediated knockdown of either sincRNA16 or sincRNA22. (d) In a cell-free in vitro system, the low-complexity sincRNA forms liquid droplets when mixed with the ACM of human VHL or β-amyloid proteins. Droplets were detected using fluorescently labelled RNA (5’FAM) and differential interference contrast (DIC). (e) Strand-specific RNA-seq (ss-RNA-seq) reveals that sincRNA levels increase while asincRNA levels decrease across the IGS following a 30 min heat shock. Heat shock increases sincRNA levels by 607% and decreases asincRNA levels by 38%. (a-e) Nucleolar stress hyper-responsive MCF7 cells were used where applicable; images are representative of two independent experiments; scale bars, 5 μm.
Extended data Fig. 5 |
Extended data Fig. 5 |. Artificial and natural modulation of sincRNA levels.
(a) In HEK293 cells treated with the Pol II inhibitor flavopirodol (FP), introduction of antisense oligonucleotides (ASO) targeting sincRNAs does lower IGS ncRNA levels relative to ASO control-treated cells (CTL). ASO-dependent percent decreases in sincRNA levels are indicated for each IGS site and the average decrease in total sincRNA levels is 49%. Data are shown as the mean±s.d.; two-tailed t-test, n=3 biologically independent experiments. (b-d) In the absence of heat shock, artificial overexpression of sincRNA22 (psincRNA) in the nucleolar stress hyper-responsive MCF7 cells failed to repress rRNA biogenesis (b) or rRNA levels (c) despite the enrichment of the sincRNA22 in the nucleolar fraction (d). Plasmid (pCTL), iPol I (LAD), vehicle (DMSO), and GAPDH cell fractionation controls were included. Data are shown as the mean±s.d.; n=2 biologically independent experiments (b, d); two-tailed t-test, n=3 biologically independent experiments (c); (e) Quantification of the number of distinct NPM foci per cell in different cell types. Data are shown as the mean±s.d.; one-way ANOVA with Tukey’s multiple comparisons test, n=5 biologically independent experiments.
Extended data Fig. 6 |
Extended data Fig. 6 |. Controls related to the disruption of nucleolar structure following Pol II inhibition.
(a,b) The disruption of NPM phase separation following Pol II inhibition (a) coincide with time points at which the levels of IGS ncRNAs greatly increased (b; mean±s.d., n=3 biologically independent experiments). At these time points, no reductions in the levels of the snoRNA U8 or Alu RNA were observed. (c-e) Treating cells with the Pol II inhibitor flavopiridol (FP), with various drugs that disrupt nucleolar morphology through unclear mechanisms (MG132, Doxorubicin), with the LLPS/nucleolus disruptor 1,6-hexanediol, or with the global translation inhibitor (Cycloheximide) revealed that only Pol II inhibition simultaneously disrupted NPM phase separation (c) and induced IGS ncRNA levels (d,e). Shown are representative anti-NPM immunofluorescence images (c) and two different visual representations of ncRNA levels as detected by RT-qPCR (d,e); n=3 biologically independent experiments). In the scatter plot (e), each circle represents the value of one IGS site from one of the three biological replicates. Scale bars, 5 μm.
Extended data Fig. 7 |
Extended data Fig. 7 |. Nucleolar R-loops and their modulation.
(a) In vitro treatment with recombinant RNase H1 greatly decreases nuclear immunofluorescence signals obtained with the anti-DNA-RNA hybrid S9.6 antibody. Signals remaining following RNase H1 treatment may reflect resistant hybrid structures or other nucleic acid structures. (b) Immunofluorescence employing the anti-RNA-DNA hybrid antibody S9.6, but not the anti-dsRNA antibody J2, revealed nucleolar signal under standard cell culture conditions. (c) Anti-RNA-DNA hybrid immunofluorescence employing the S9.6 antibody and IMR90 cells also showed nucleolar signals that were repressed upon Pol II inhibition (n=100 cells). (d) In our DRIP assays, in vitro treatment with RNase H1, but not RNase III, consistently lowers DRIP signals. (e) Bioinformatic analysis of the rDNA GC skew distribution and mean showed that the IGSs, but not rRNA genes, displayed a strongly negative GC skew, Welch’s two-tailed t-test, n=14 (rRNA gene) and n=30 (IGS) (f-g) RNase H1 overexpression partly lowers R-loop levels (f) and increases ncRNA levels (g) at the IGS. (h) Design details of the RED/dRED-LaSRR systems created to achieve inducible locus-associated R-loop repression. (i,j) Validation of non-inducible and tetracycline RED and dRED protein expression using immunoblotting (i) and microscopy (j). For gel source data, see Supplementary Figure 1. (k) Using RED together with sgIGS28 decreased R-loop levels at IGS18. (l-m) Using RED together with sgIGS38 fails to alter R-loop (l) or ncRNA levels (m) at IGS18. (n) Using RED together with sgIGS28 does not alter Pol II enrichments across the IGS. (o) The fusion protein system can be used to preferentially enrich the dRED fusion protein at the 5’ pause site of the ACTIN locus. (p) Use of the non-overlapping sgRNAs targeting IGS28, individually instead of as a pool, failed to significantly repress R-loop levels at IGS18, arguing against non-specific effects related to the RNase H1 moiety of RED or any of the gRNAs used. (a-p) HEK293 cells were used. Data are presented as the mean±s.d.; one-way ANOVA with Dunnett’s multiple comparisons test (p, n=3 biologically independent experiments) or two-tailed t-test (d, f-g, k, l-n; n=3 biologically independent experiments); n=3 biologically independent experiments (o); images in (a-b,i-j) are representatives of two independent experiments. Scale bars, 5 μm.
Extended data Fig. 8 |
Extended data Fig. 8 |. Nucleolar and IGS features of wild-type and SETX KO cells.
(a) ChIP showing SETX enrichment at the IGS. (b) SETX had a nucleolar/nucleoplasmic localization. (c) Bioinformatic analysis of ENCODE-K562 data showing co-enrichment of epigenetic marks consistent with transcriptional activation near IGS28. (d) Immunoblot showing CRISPR/Cas9-mediated SETX KO. (e) ChIP showing Pol II enrichment across rDNA in wild-type and SETX KO cells. (f) ChIP reveals that SETX KO, in two clones, enriched RNA Pol I at the IGSs. (g-h) SETX KO induced IGS ncRNA synthesis (g) and decreased Pol I enrichment at the rRNA gene (5’ETS region) (h). (i-j) siRNA-mediated knockdown of TIF1A lowered Pol I-dependent pre-rRNA levels but failed to induce IGS ncRNAs. For experimental design differences, FP/Vehicle data (j) were from a different experiment (extended data Fig. 6d) but are shown here on the same graph for better visual comparison. (k) Northern blotting revealed that Pol II or SETX disruption did not induce rRNA gene read-through transcripts. Probe for the 5’-ETS of pre-rRNA was used. (l-m) SETX KO disrupted nucleolar organization as indicated by NPM immunofluorescence (e) and decreased pre-rRNA processing in pulse-chase assays (f). (n) ASO-mediated knockdown of sincRNAs increases rRNA biogenesis, as indicated by single cell rRNA biogenesis assays. Shown are nucleolar fibrillar centre-associated RNA rings revealed by single-cell FU-RNA pulse-chase immunofluorescence. Quantification shown in Fig. 4e. (o) ChIP showing H3K9me2 enrichment across rDNA in wild-type and SETX KO cells. (a-o) HEK293 cells were used unless otherwise indicated. Data in (e,o) were from large experimental sets sharing IgG controls. Data are shown as the mean±s.d.; two-tailed t-test, n=3 biologically independent experiments (a, j), n=6 biologically independent experiments (e), and n=4 biologically independent experiments (f, o); one-way ANOVA with Dunnett’s multiple comparisons test, n=3 biologically independent experiments (g,h) and n=4 biologically independent experiments (m); images in (b-d,k) are representative of two independent experiments. Scale bars, 5 μm. For gel source data (d, i, k), see Supplementary Figure 1.
Extended data Fig. 9 |
Extended data Fig. 9 |. Additional nucleolar organization and sequencing analyses related to Ewing sarcoma.
(a) Representative tissue sections of human Ewing sarcoma and osteosarcoma (haematoxylin and eosin, x400). Materials were obtained following Institutional Research Ethics Board approval (Sinai Heath Systems, 17–0103-E). The percentage of cells with one or two distinct nucleoli per nucleus is shown. Data are shown as the mean±s.d.; per cancer type, n=5 cases (100 cells each); two-tailed t-test P=0.0019. (b) Ewing sarcoma cells (EWS502), and U2OS cells with siEWSR1 display disrupted nucleoli, as indicated by the nucleolin protein, compared to their respective control IMR90 and U2OS siControl (siCTL) cells. Scale bar, 5 μm. (c) Ewing sarcoma (EWS502, TC32) cells showed increased R-loop levels across IGSs in DRIP-seq. (d) Genome-wide view of sequence read alignments for DRIP-seq and RNA-seq. Chr., chromosome. (e) IMR90, EWS502, and TC32 cells can exhibit similarities and differences at non-rDNA loci in sequencing read alignments from RNA-seq. (f) ASO targeting sincRNAs ameliorates nucleolar organization. Shown are representative images related to quantifications in Fig. 4d. Images are representative of two independent experiments. Scale bar, 5 μm.
Extended data Fig. 10 |
Extended data Fig. 10 |. Detailed model illustrating how nucleolar RNA Pol II-dependent R-loops shield the IGS from sincRNA synthesis by Pol I.
RNA Pol II at rDNA intergenic spacers (IGSs) synthesizes antisense intergenic ncRNAs (asincRNAs) that constitutively engage in DNA-RNA hybrid-containing R-loops. Nucleolar RNA Pol II function is promoted by the neurodegeneration-linked SETX. Disruption of nucleolar Pol II enables the recruitment of RNA Pol I to the IGS. There, Pol I synthesizes sense intergenic ncRNAs (sincRNAs) that mimic environmental stress, disrupting nucleolar liquid-liquid phase separation and triggering aberrant nucleolar liquid-to-solid phase transition. This unscheduled activation of nucleolar stress responses compromises the natural organization of nucleoli, leading to defects in pre-rRNA biogenesis, especially at the processing level. Nucleolar sincRNA levels are naturally elevated in Ewing sarcoma cells, explaining the indistinct nucleoli often seen in this cancer. In the context of Pol II inhibition, SETX loss, or Ewing sarcoma, sincRNA repression ameliorates nucleolar organization and rRNA biogenesis.
Fig. 1.
Fig. 1.. Pol I and Pol II localize to the rDNA IGS and compete to modulate IGS ncRNA levels.
(a) Representative immunofluorescence (IF) and super-resolution microscopy images showing Pol II-pS2 localization within the NPM-indicated nucleoli. Scale bar, 5 μm. (b) Pol II-pS2 enrichments across rDNA as revealed by chromatin immunoprecipitation (ChIP). (c) Effect of a 3 h Pol II inhibition (iPol II) using flavopiridol (FP) or α-amanitin (AMN) on rRNA biogenesis as measured in live single-cell FU-RNA pulse-chase assays. (d-e) Cell population-based RNA pulse-chase assays were used to assess pre-rRNA synthesis (d) and processing (e) following a 3 h inhibition of Pol I or Pol II (iPol I/II). (f) Pol I promotes and Pol II represses IGS ncRNAs, as shown by reverse-transcriptase qPCR (RT). (a-h) HEK293 cells; data are shown as the mean±s.d.; data in (b) and extended data Fig. 1d–f,j–l were from large experimental sets sharing IgG controls; n=3 biologically independent experiments (b-f); two-tailed t-test (b); one-way ANOVA with Dunnett’s multiple comparisons test (c-e); image in (a) is representative of two independent experiments.
Fig. 2.
Fig. 2.. Pol II represses sincRNAs to maintain nucleolar structure and function.
(a-b) Effects of 3 h Pol II inhibition on NPM (a) and UBF (b) localization shown by immunofluorescence microscopy. Examples of normal and defective phenotypes are respectively marked by magenta and white arrowheads. (c) Low-complexity sincRNA, not high-complexity control RNA, promoted liquid droplets in the presence of amyloid-converting motif (ACM) peptides. RNA percent concentrations are shown. (d-f) Nucleolar organization was restored by Pol I co-inhibition (d), FP removal (d), or treatment with sincRNA-repressing ASO (e), which also restored rRNA biogenesis as indicated by live single-cell FU-RNA pulse-chase assays (f). Percentages indicating phenotypic rescue relative to FP-treated cells are shown onto graph bars where applicable. (a-f) HEK293 cells; data are shown as the mean±s.d.; one-way ANOVA with Dunnett’s multiple comparisons test (d,f), two-tailed t-test (e), n=5 biologically independent experiments (d), n=3 biologically independent experiments (e,f); images in (a-c) are representative of two independent experiments; scale bars, 5 μm (yellow) or 1 μm (white).
Fig. 3.
Fig. 3.. Repression of an IGS R-loop shield disrupts nucleoli.
(a) Pol II inhibition repressed nucleolar R-loops. (b) DRIP showing RNase H1-sensitive R-loop peaks at rDNA. (c) The RED-LasRR system created to achieve inducible locus-associated R-loop repression. (d) The short guide RNA for IGS28 (sgIGS28) enriched RED or dRED at IGS28 in anti-GFP ChIP. Enrichments are normalized to a non-targeting control (sgNT). RED and dRED data were from different experiments but are shown on the same graph as a space-saving measure. (e) Using RED or dRED together with sgIGS28 decreased and increased R-loop levels at IGS18, respectively. (f,g) RED sgIGS28 induced ncRNA levels (f) and disrupted NPM localization (g). The percentage of cells exhibiting ruffled NPM localization is indicated on images (g). (a-g) HEK293 cells; data are shown as the mean±s.d.; two-tailed Mann-Whitney U test, n=100 cells (a), or two-tailed t-test, n=3 biologically independent experiments (b, d-f); scale bar, 5 μm. Percent changes relative to respective sgNT samples are indicated above or onto bars (e-f).
Fig. 4.
Fig. 4.. Nucleolar Pol II reinforcement by SETX and nucleolus-disrupting sincRNAs in cancer.
(a) Sequential immunoprecipitations (IPs) revealed preferential SETX co-enrichment with Pol II at IGSs. (b-c) SETX KO in two clones decreased R-loops (b) and induced IGS ncRNAs (c). (d-e) In SETX KO cells, single cell analysis showed that ASO-mediated repression of Pol I-dependent sincRNAs partly rescues nucleolar organization (d) and pre-rRNA processing (e). Percentages indicating the magnitude of ASO-mediated phenotypic rescue are shown above graph bars where applicable. (f-g) Ewing sarcoma (EWS502, TC32) cells showed both disrupted nucleoli by electron microscopy (f) and increased ncRNA levels across IGSs (g). (h,i) Single-cell analysis showed that sincRNA knockdown partly restores nucleolar organization (h) and pre-rRNA processing (i) in EWS502 cells. (j) Model showing Pol II-dependent R-loop shield limiting Pol I-dependent sincRNAs, which compromise nucleolar organization and function. NE, nuclear envelope; ACM, amyloid-converting motif. (a-i) HEK293 cells; data are shown as the mean±s.d.; one-way ANOVA with Dunnett’s multiple comparisons test (a, d-e, h-i) and one-way ANOVA with Tukey’s multiple comparisons test (c); n=4 biologically independent experiments (a), n=2 biologically independent experiments (b, duplicates for each of WT, KO1, and KO2), n=6 biologically independent experiments (c, triplicates for each KO), n=3 biologically independent experiments (d-e,h-i); images in (f-g) are representatives of two independent experiments, scale bar, 1 μm.

References

    1. Boisvert FM, van Koningsbruggen S, Navascues J & Lamond AI The multifunctional nucleolus. Nat Rev Mol Cell Biol 8, 574–85 (2007). - PubMed
    1. Feric M et al. Coexisting Liquid Phases Underlie Nucleolar Subcompartments. Cell 165, 1686–97 (2016). - PMC - PubMed
    1. Mekhail K & Moazed D The nuclear envelope in genome organization, expression and stability. Nat Rev Mol Cell Biol 11, 317–28 (2010). - PMC - PubMed
    1. Kobayashi T & Ganley AR Recombination regulation by transcription-induced cohesin dissociation in rDNA repeats. Science 309, 1581–4 (2005). - PubMed
    1. Kaeberlein M, McVey M & Guarente L The SIR2/3/4 complex and SIR2 alone promote longevity in Saccharomyces cerevisiae by two different mechanisms. Genes Dev 13, 2570–80 (1999). - PMC - PubMed

Publication types

MeSH terms