. 2020 Aug;584(7821):470-474.
doi: 10.1038/s41586-020-2505-4. Epub 2020 Jul 15.

A universal trade-off between growth and lag in fluctuating environments

Affiliations

A universal trade-off between growth and lag in fluctuating environments

Markus Basan et al. Nature. 2020 Aug.

Abstract

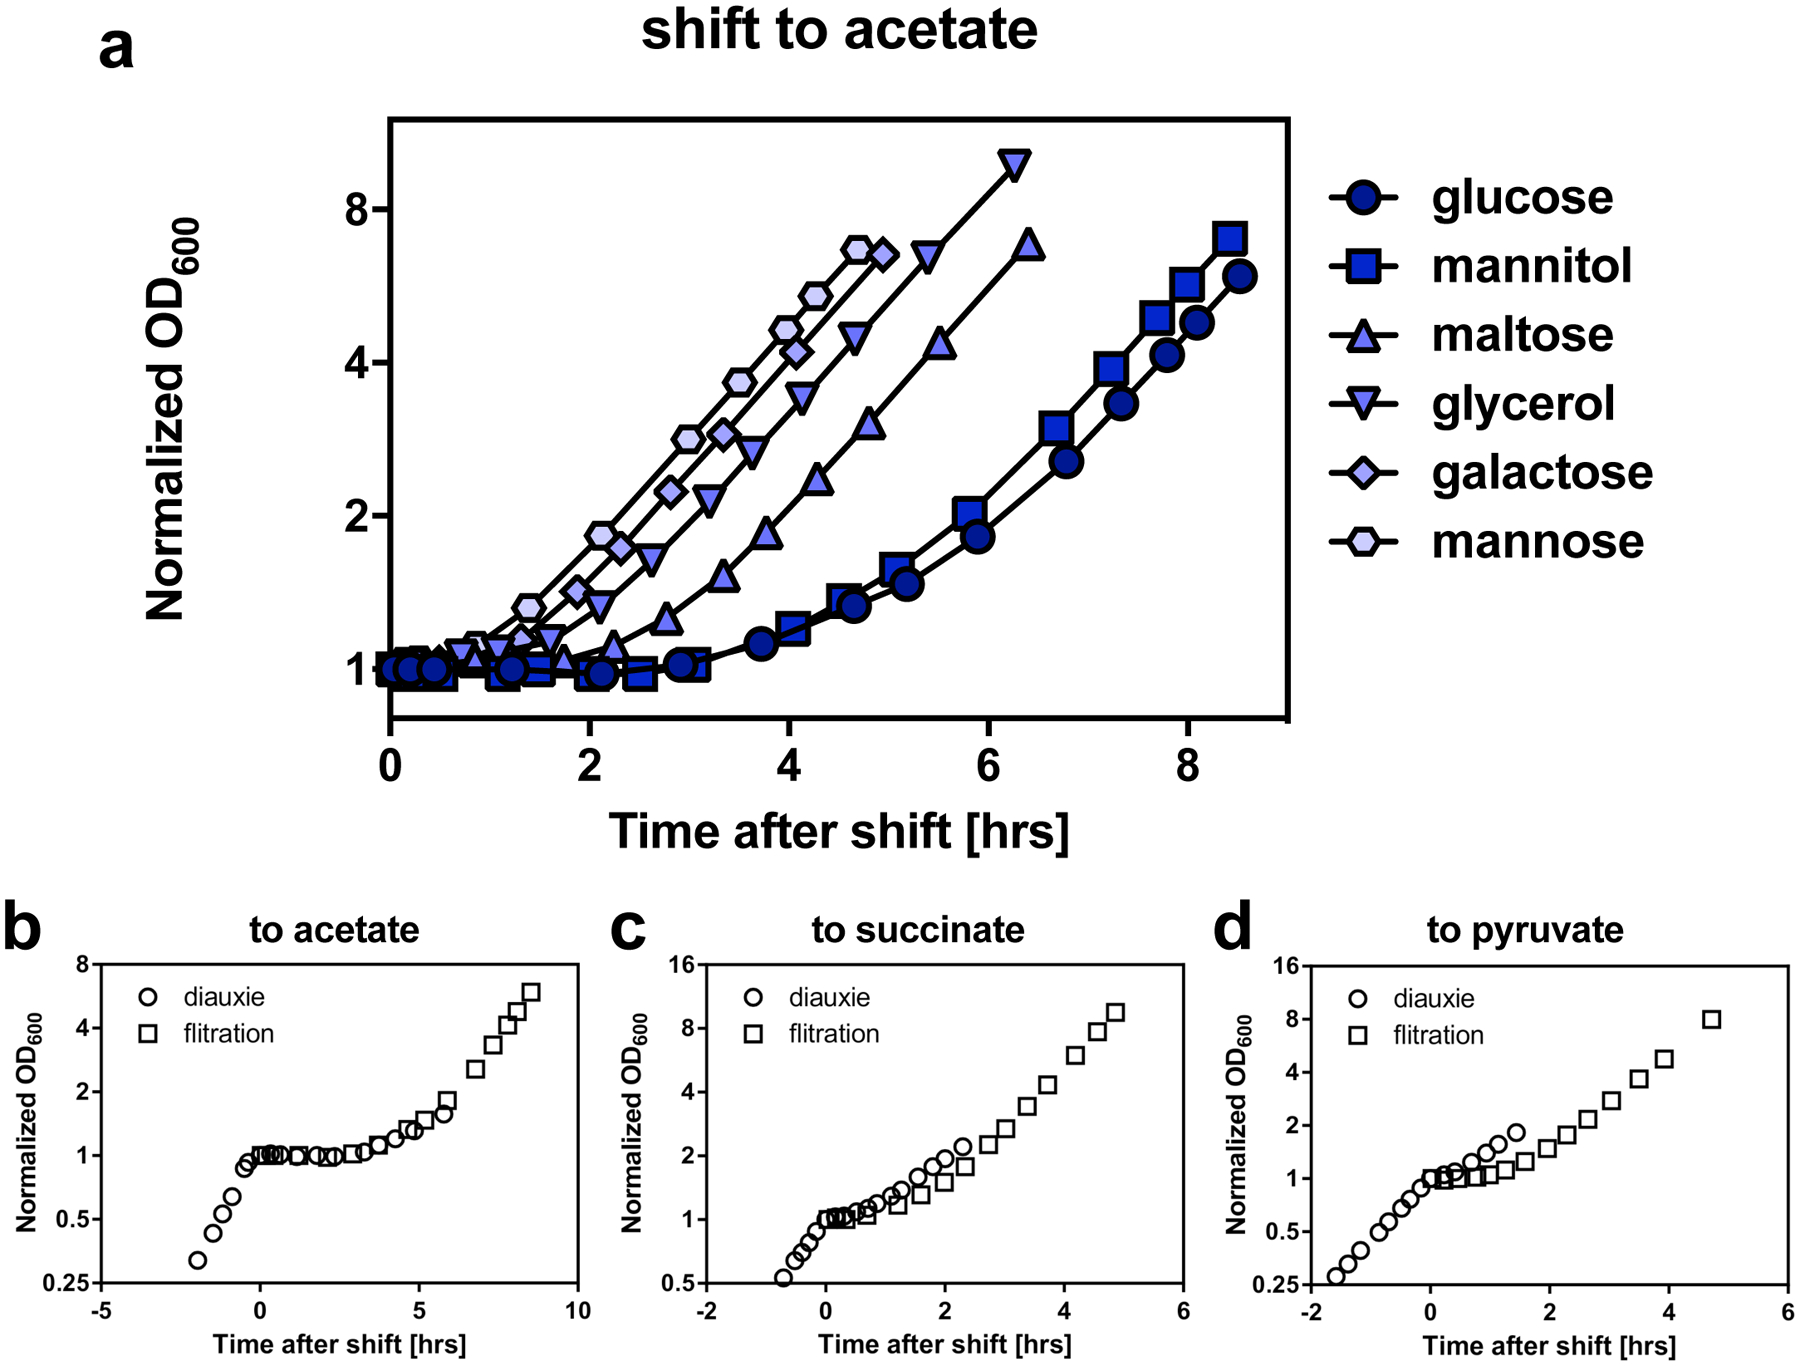
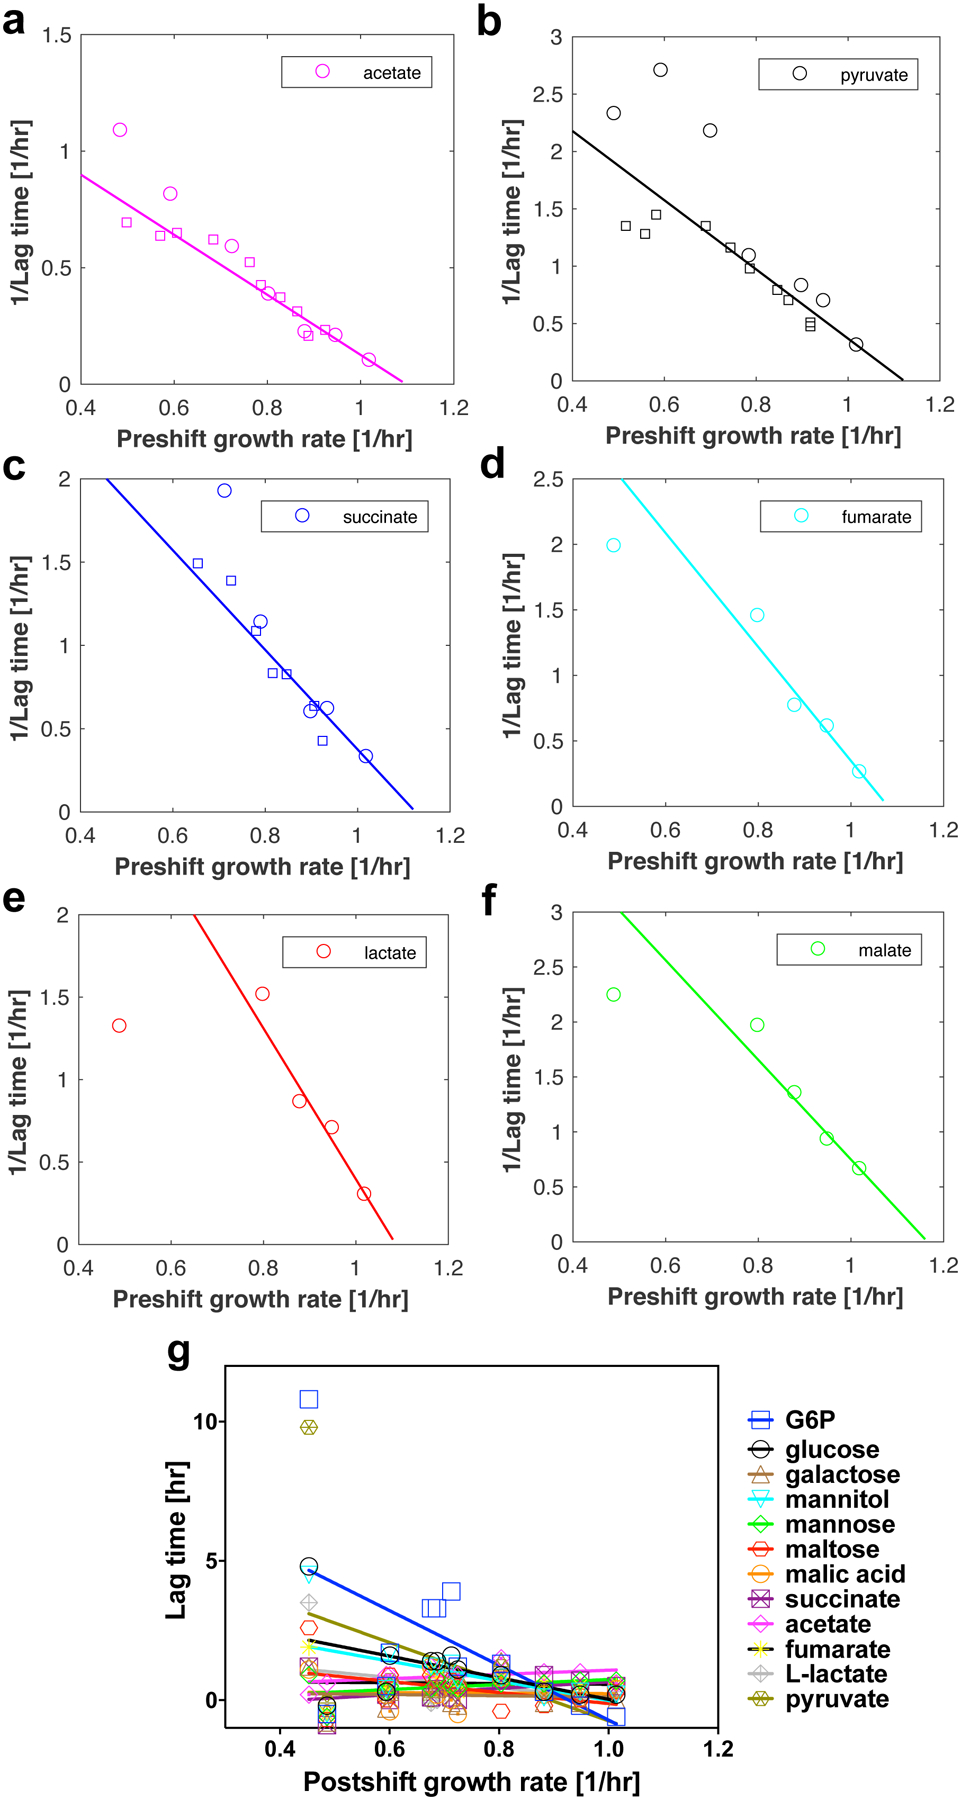
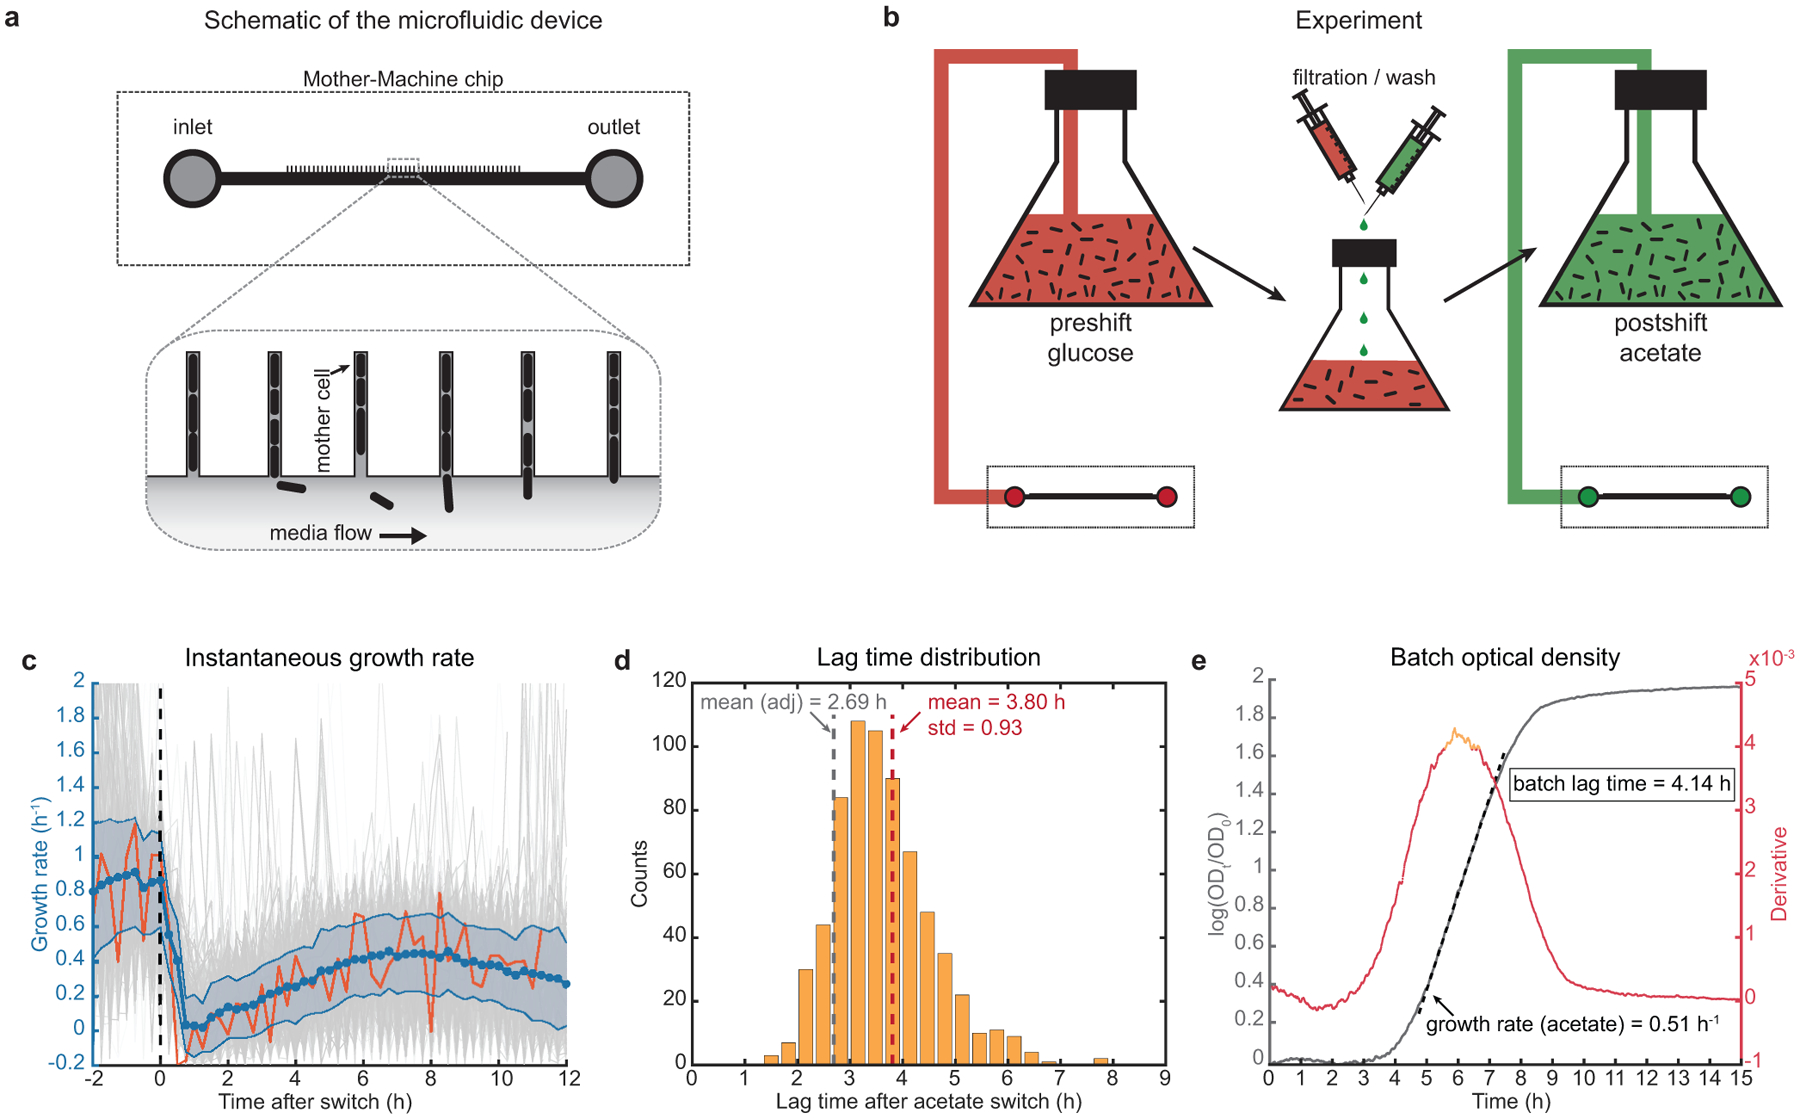
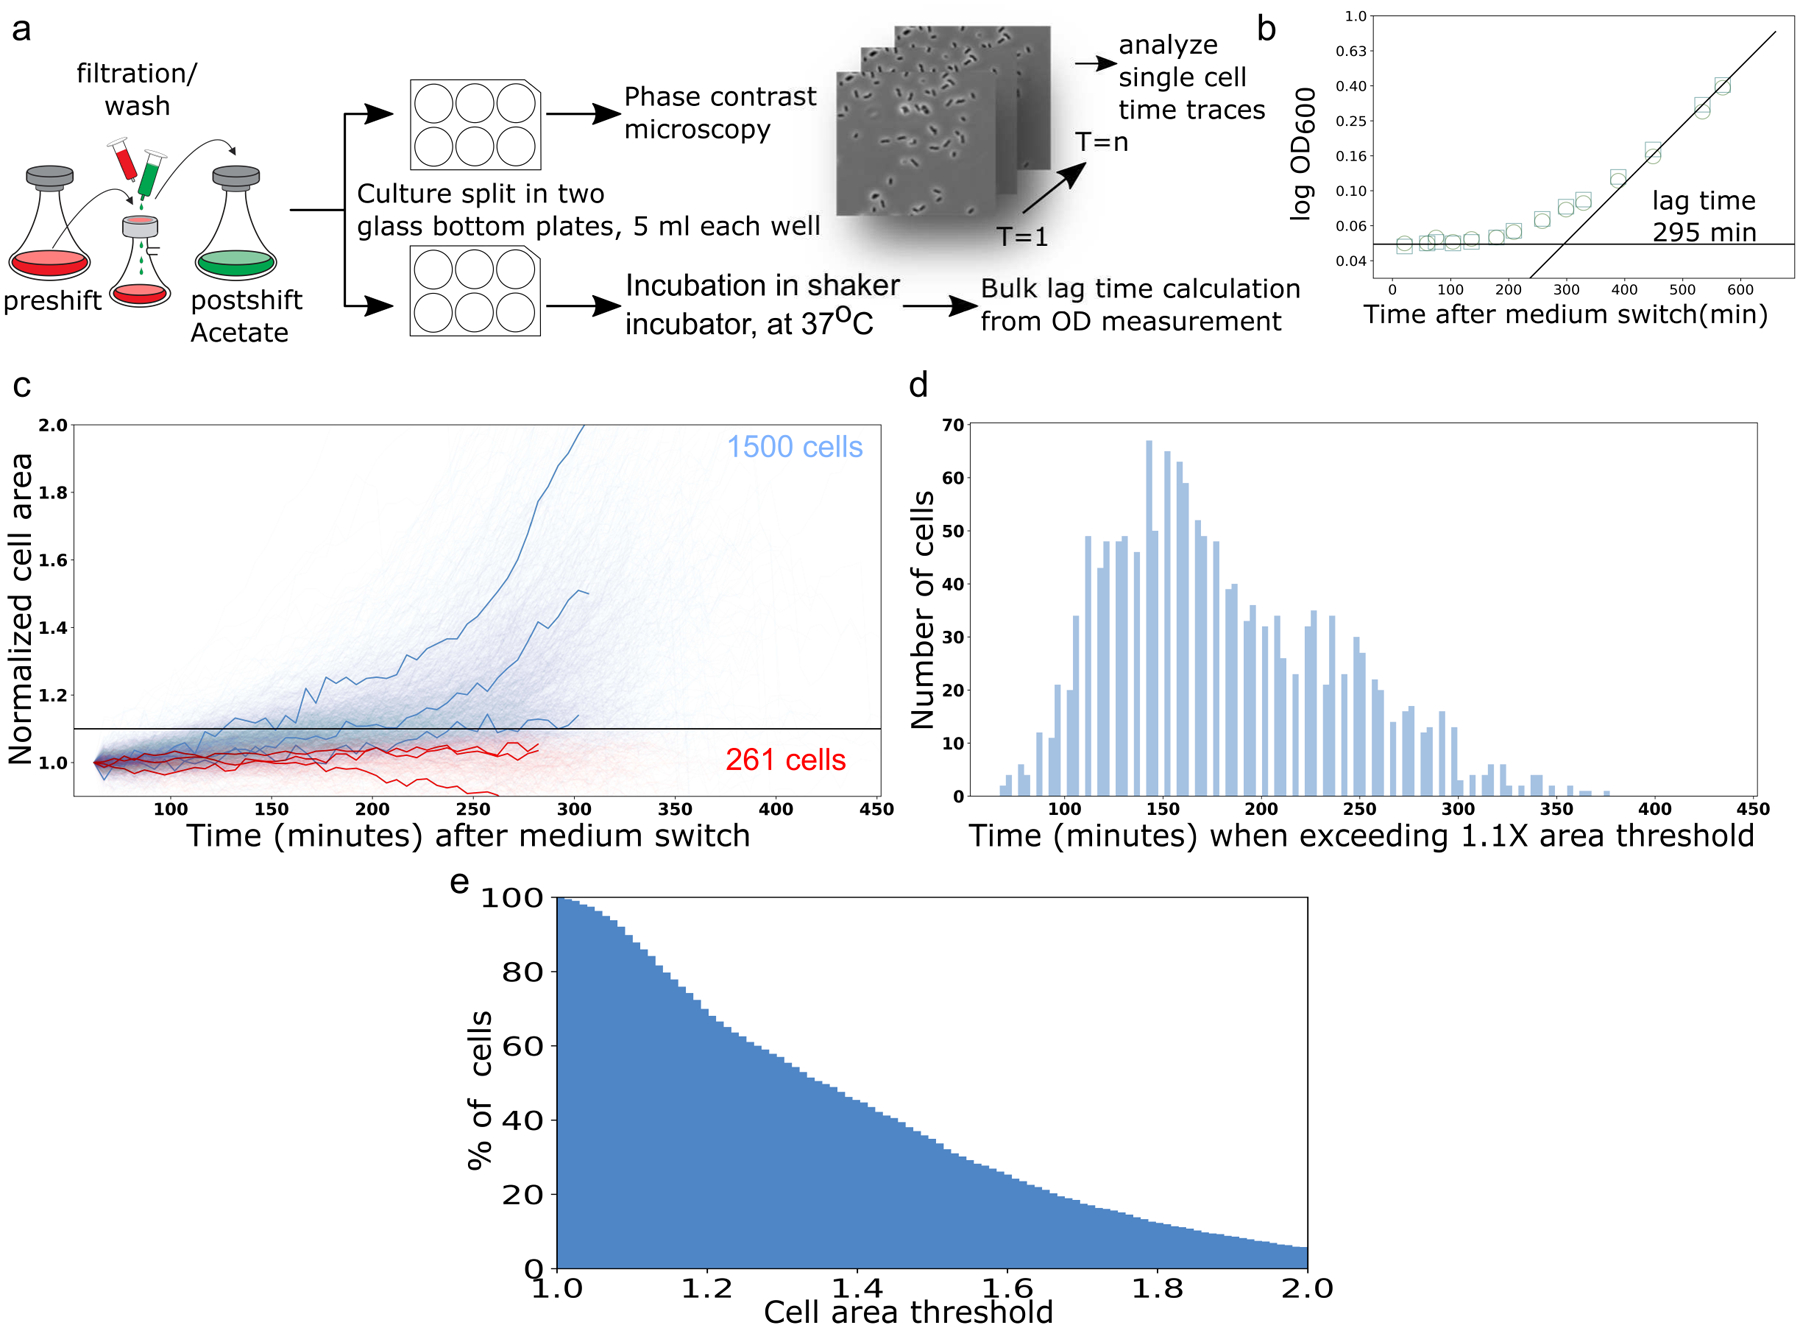
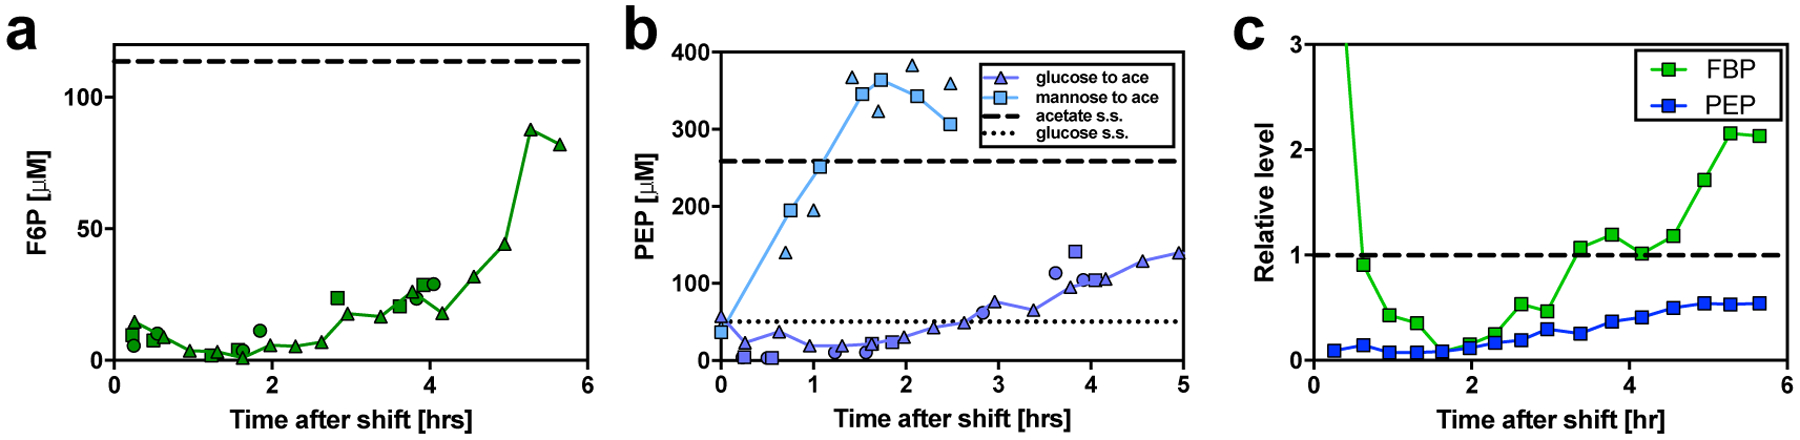
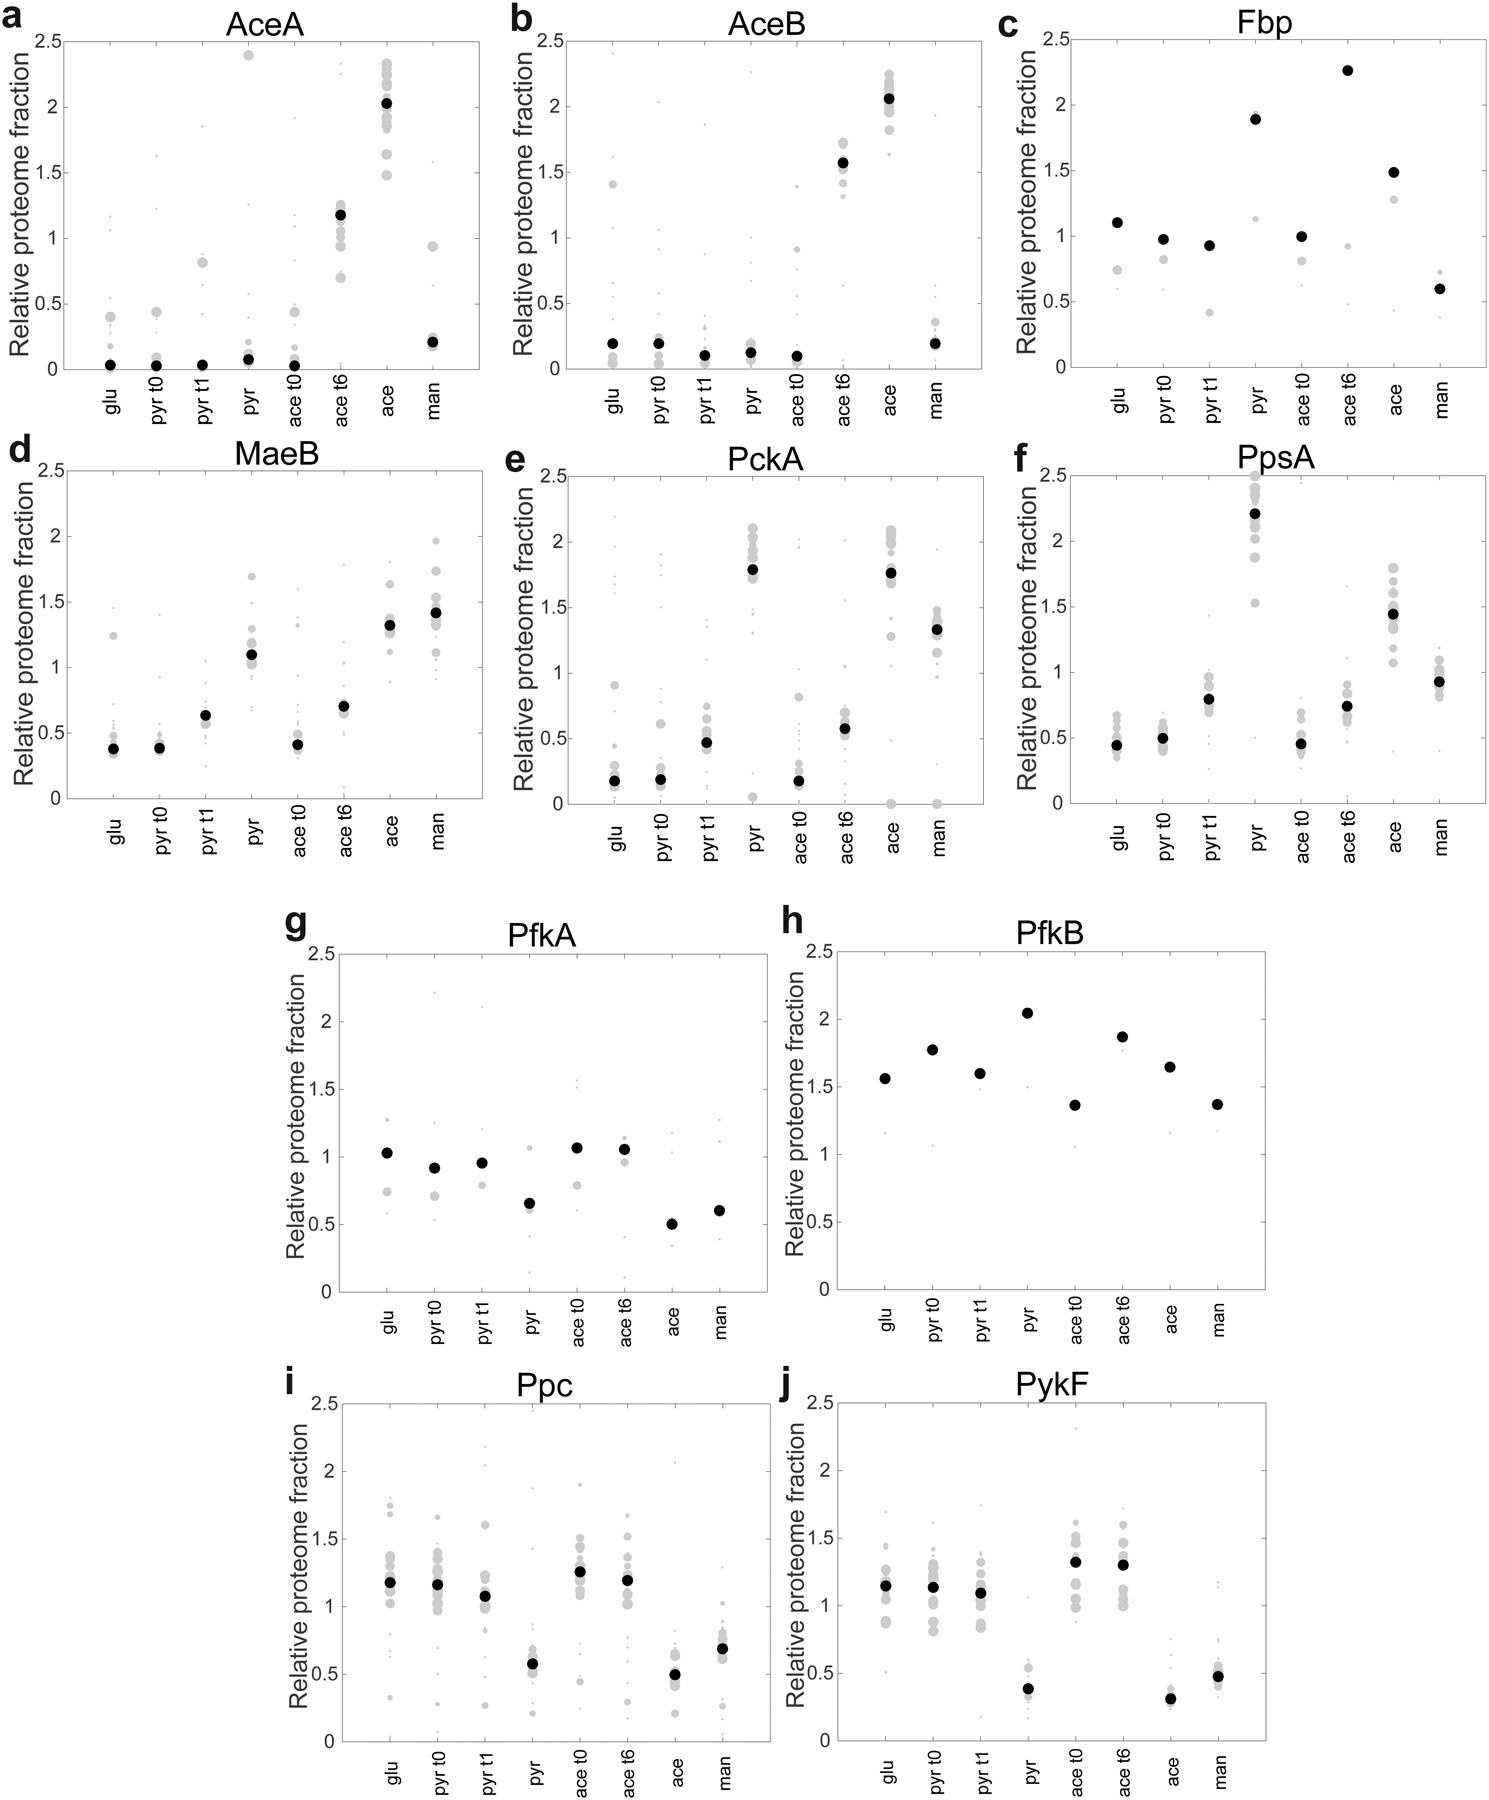
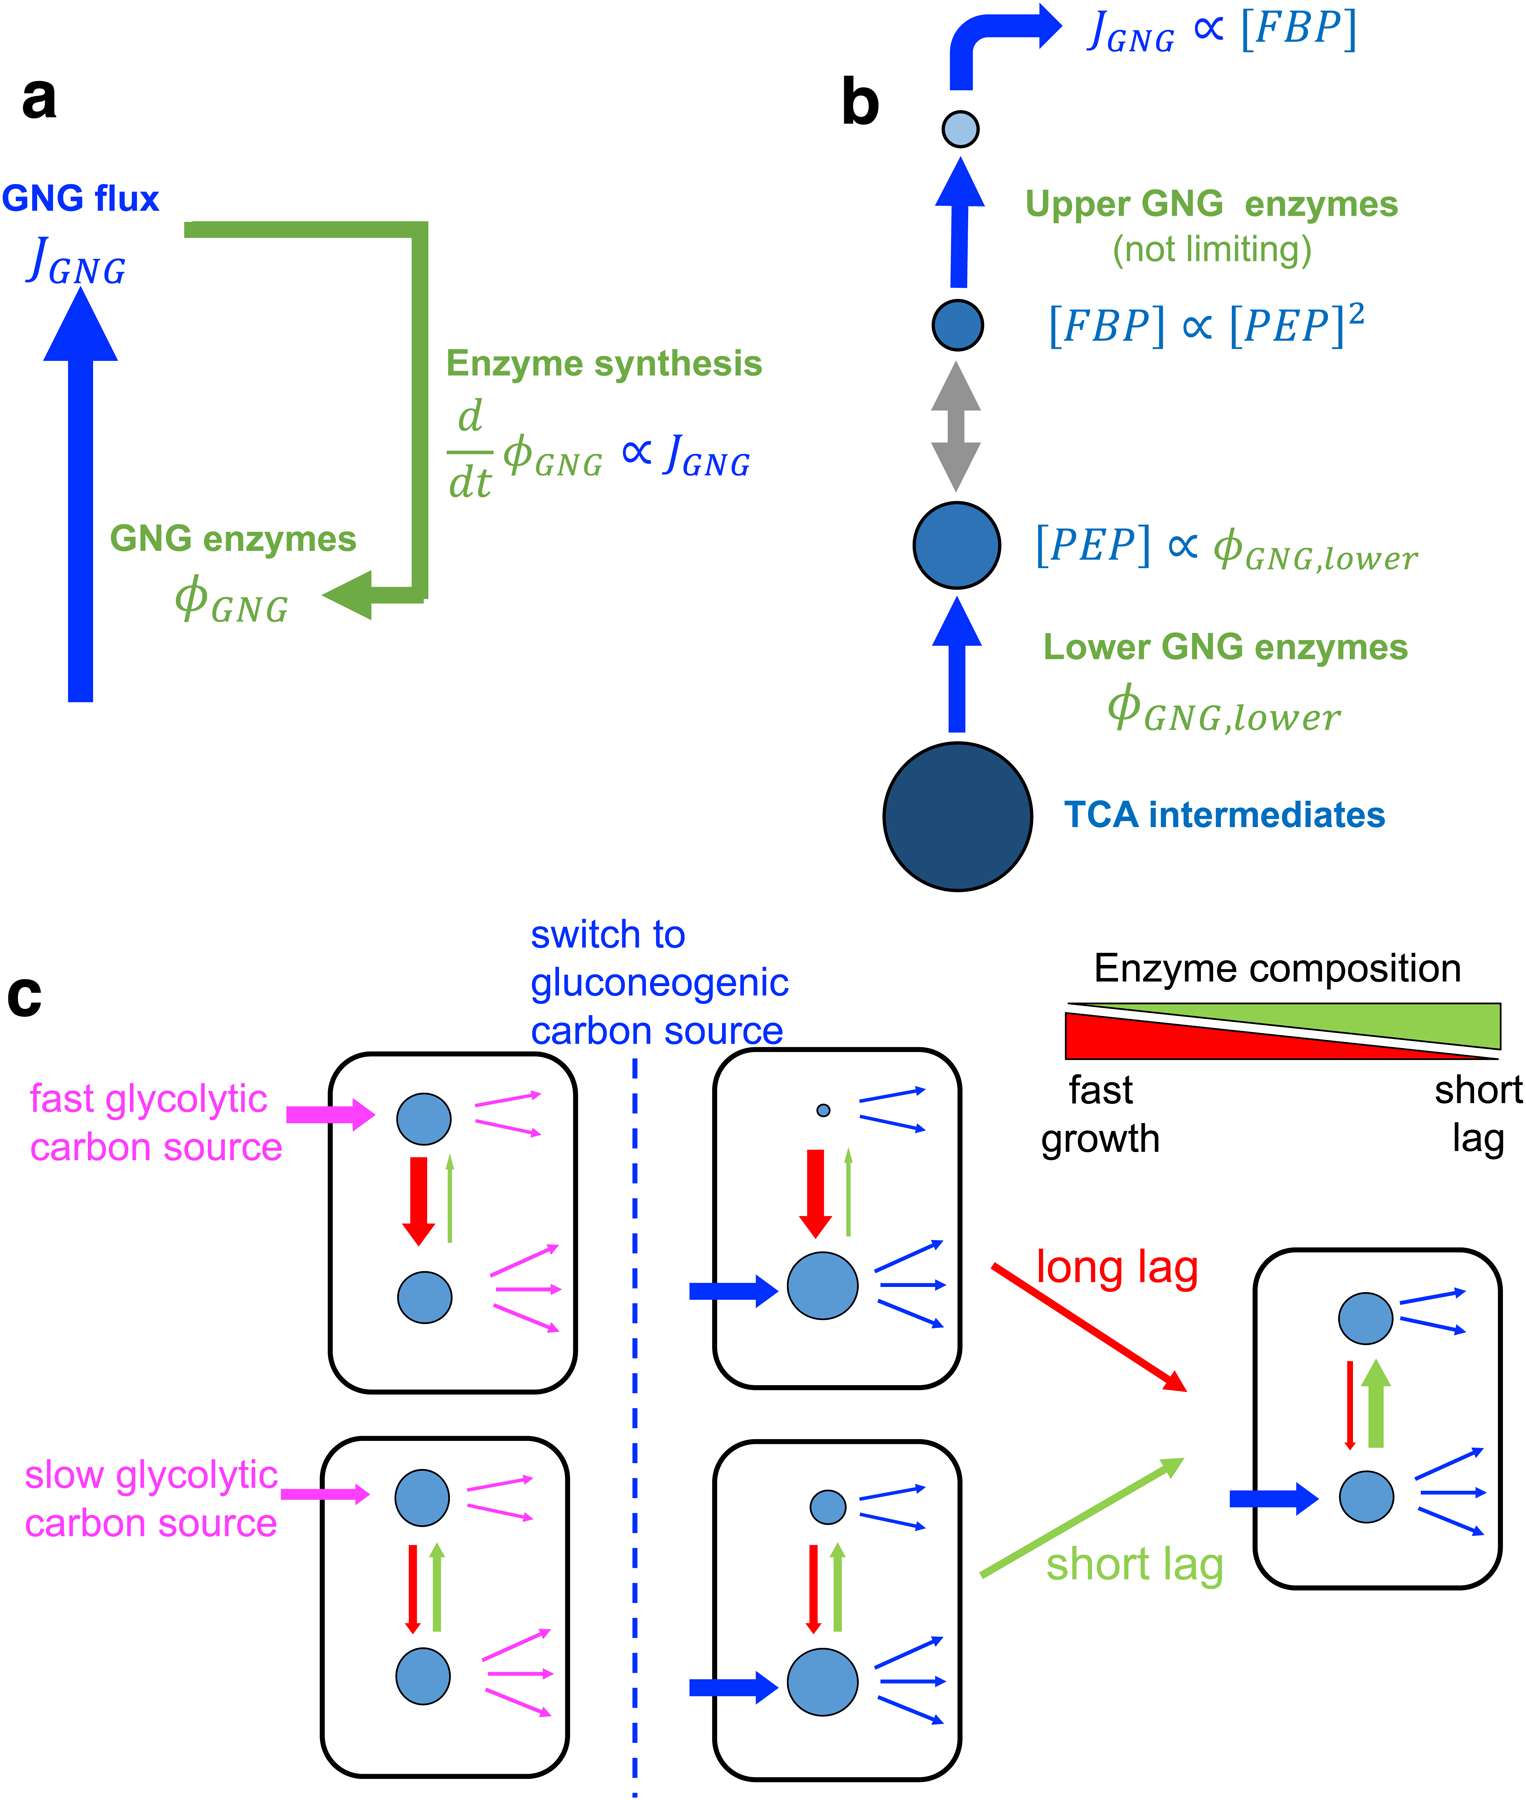
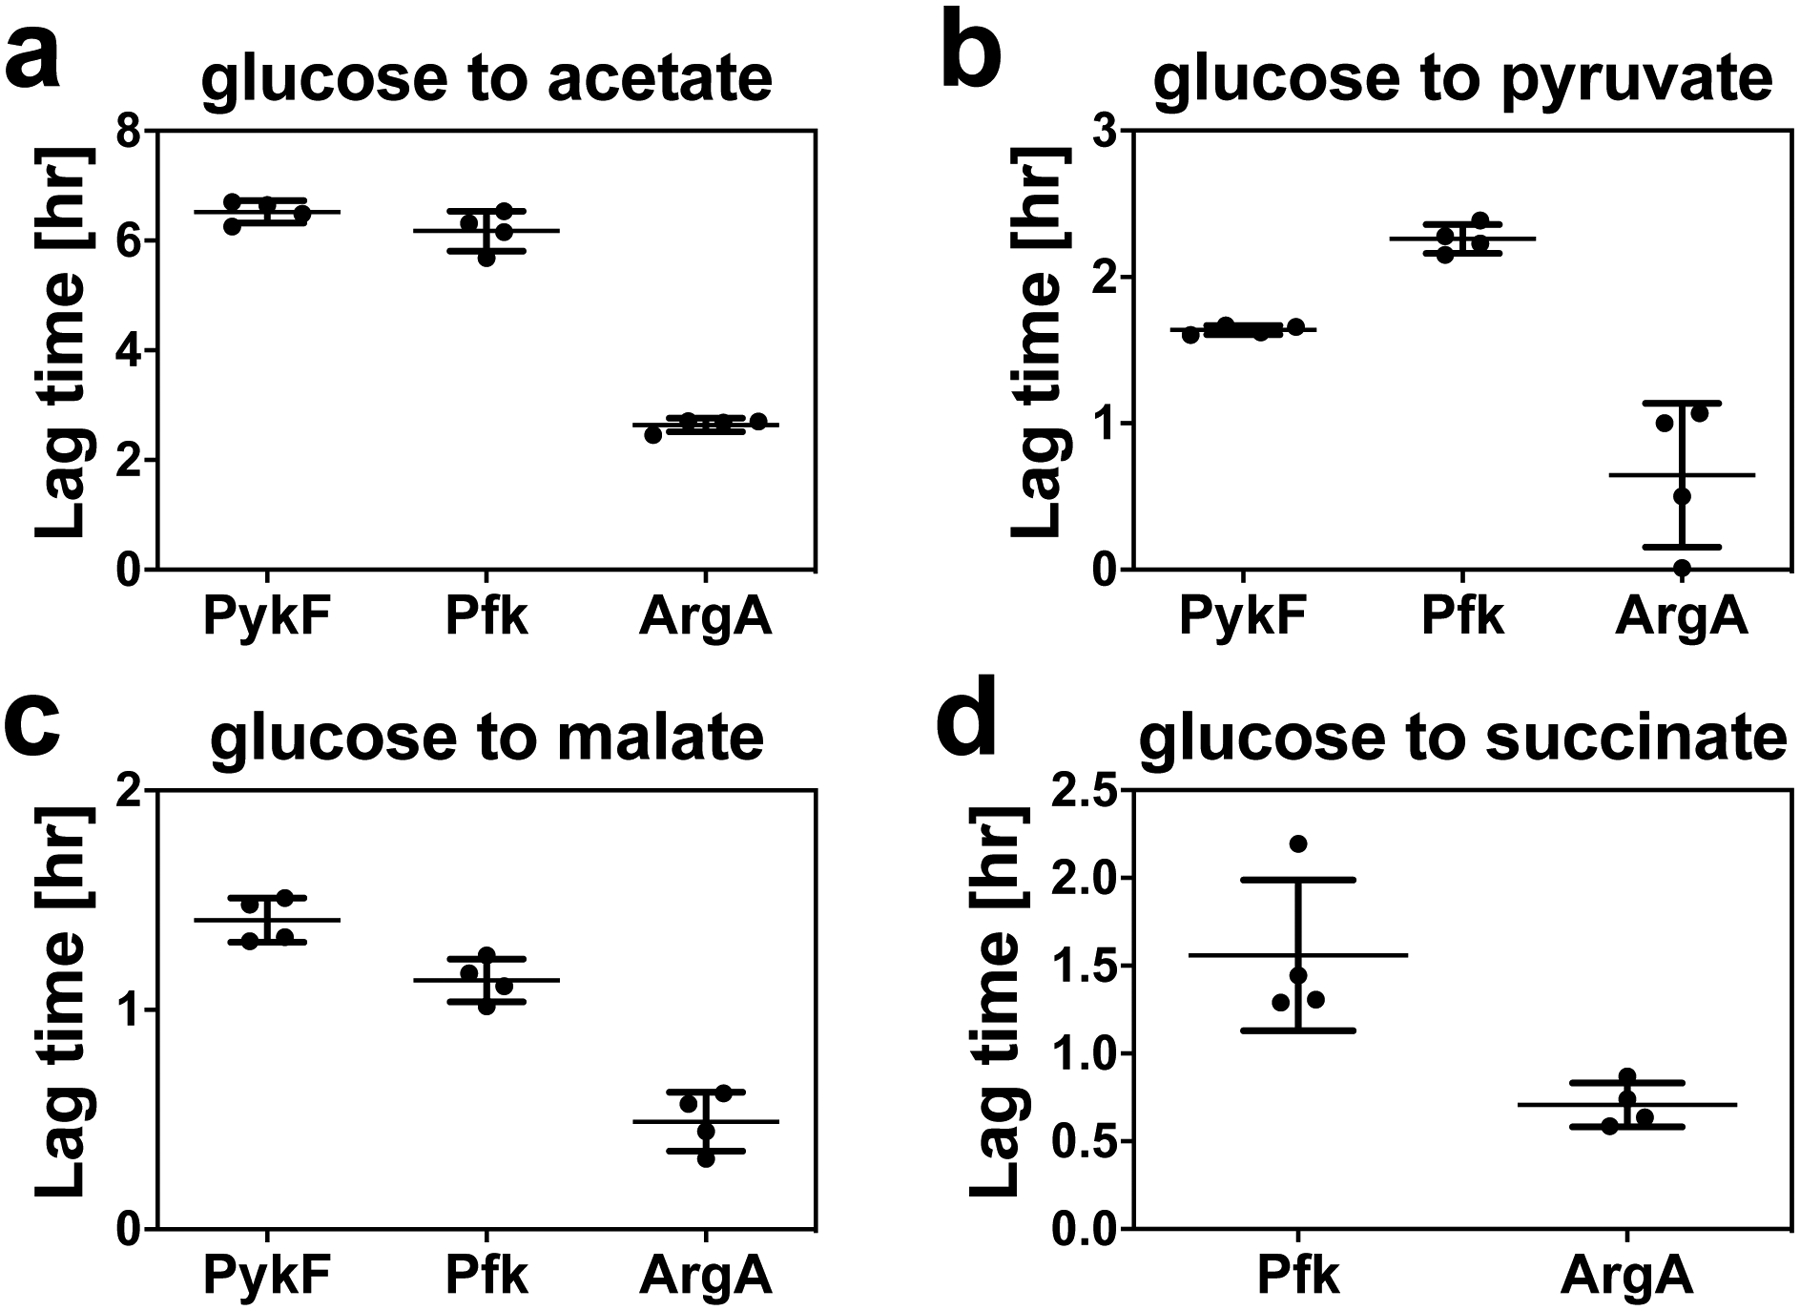
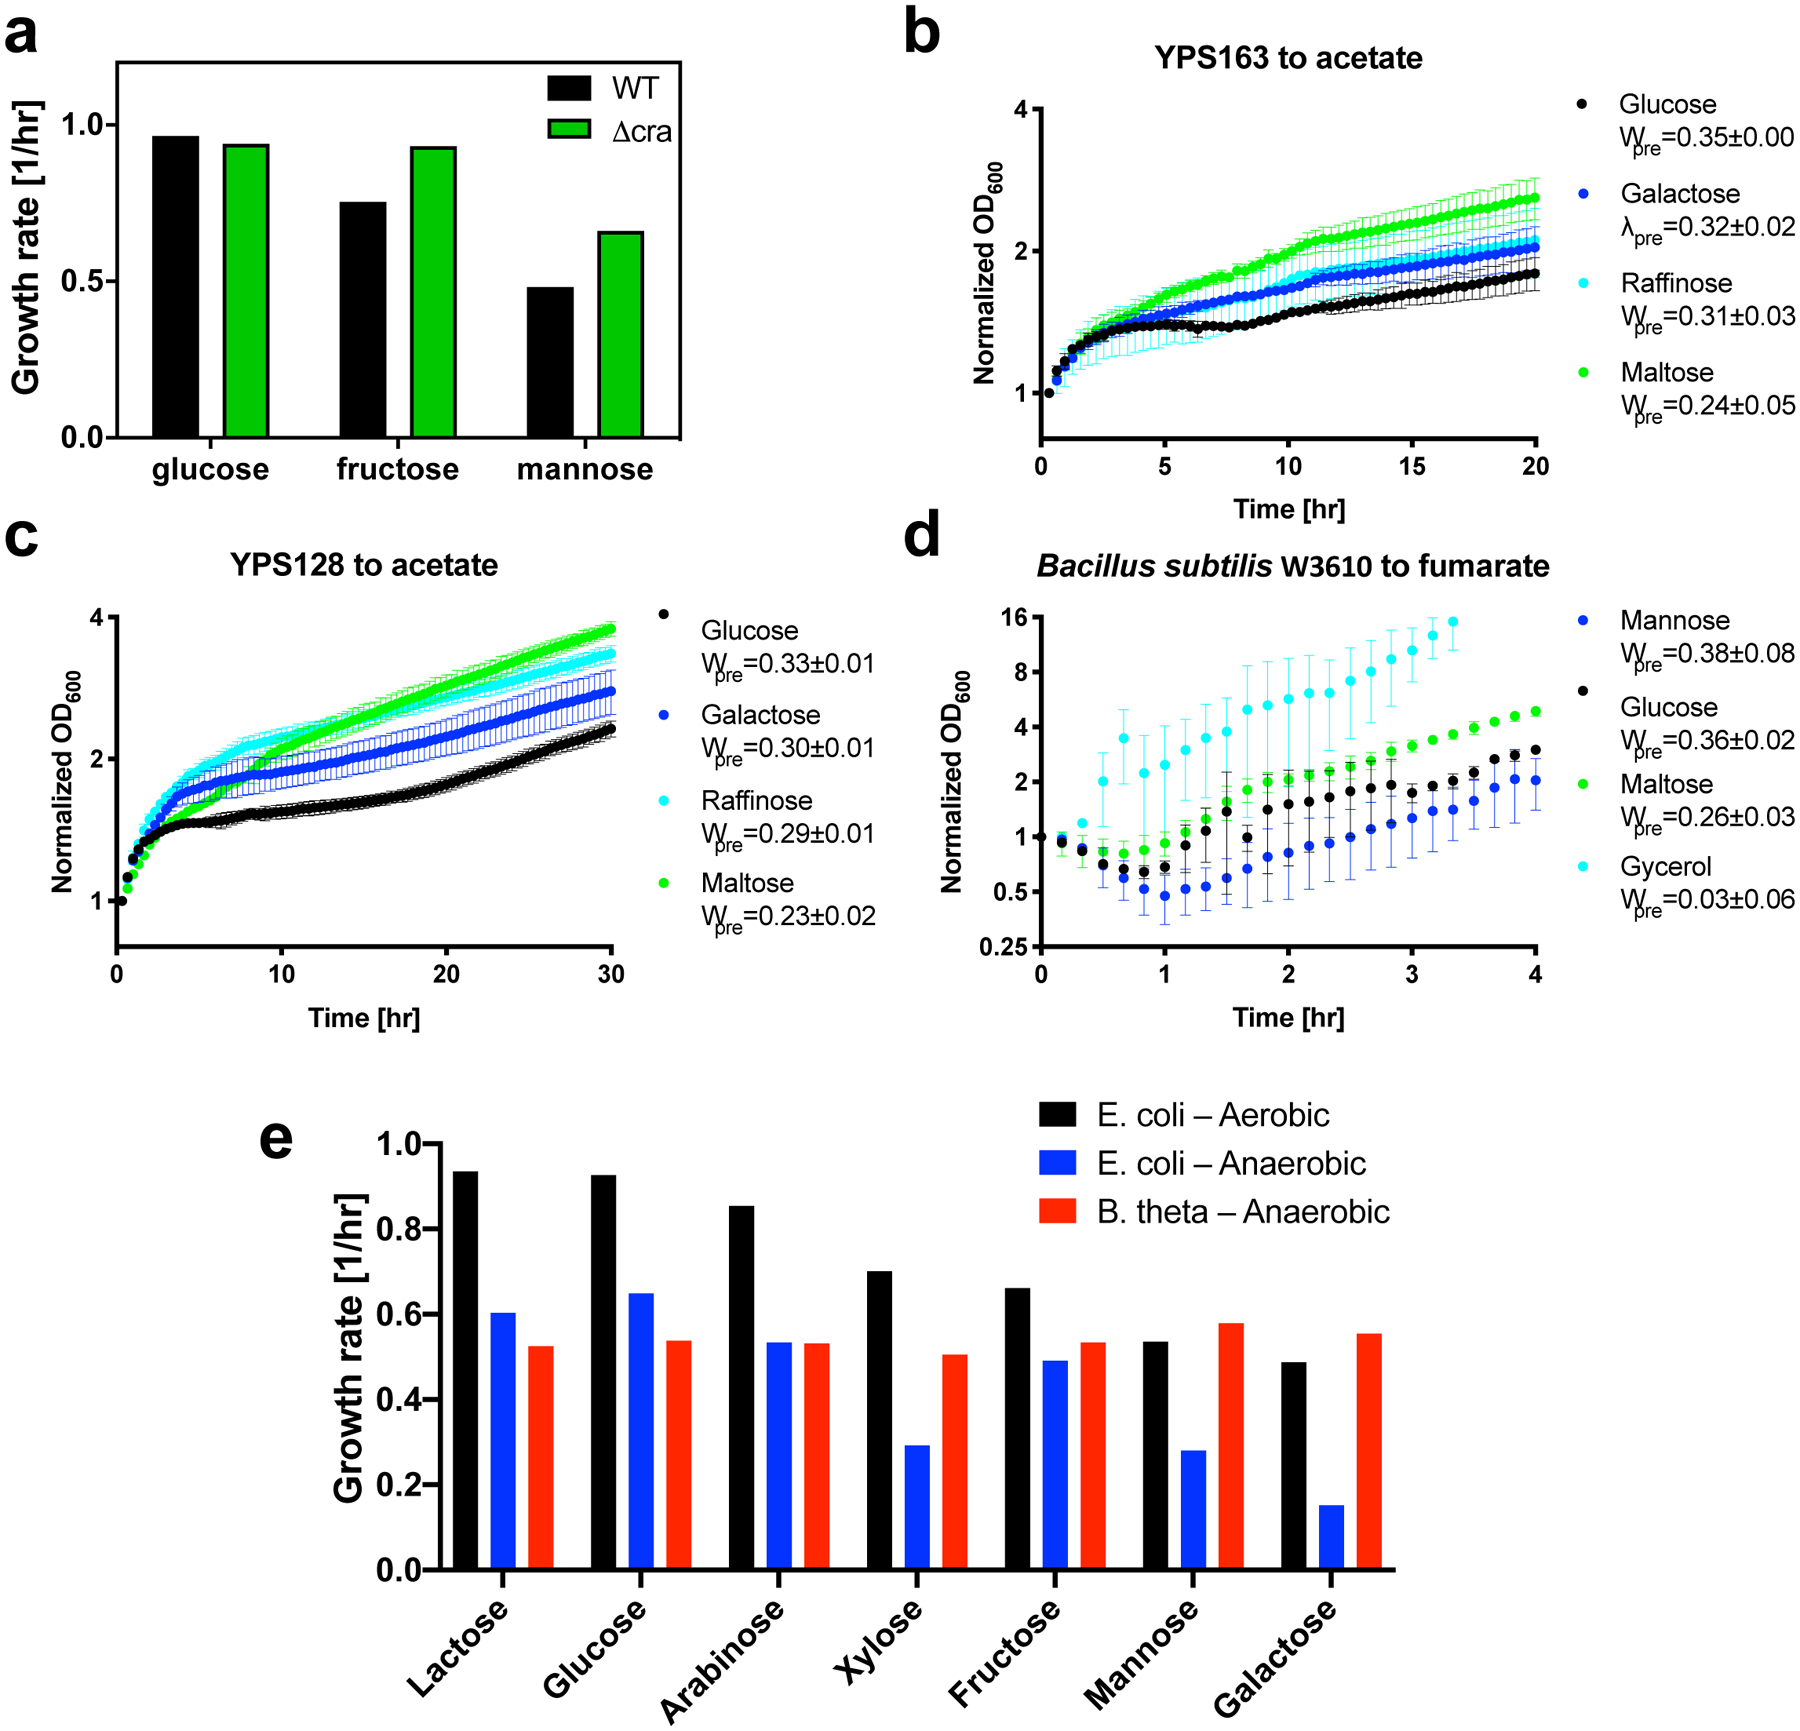
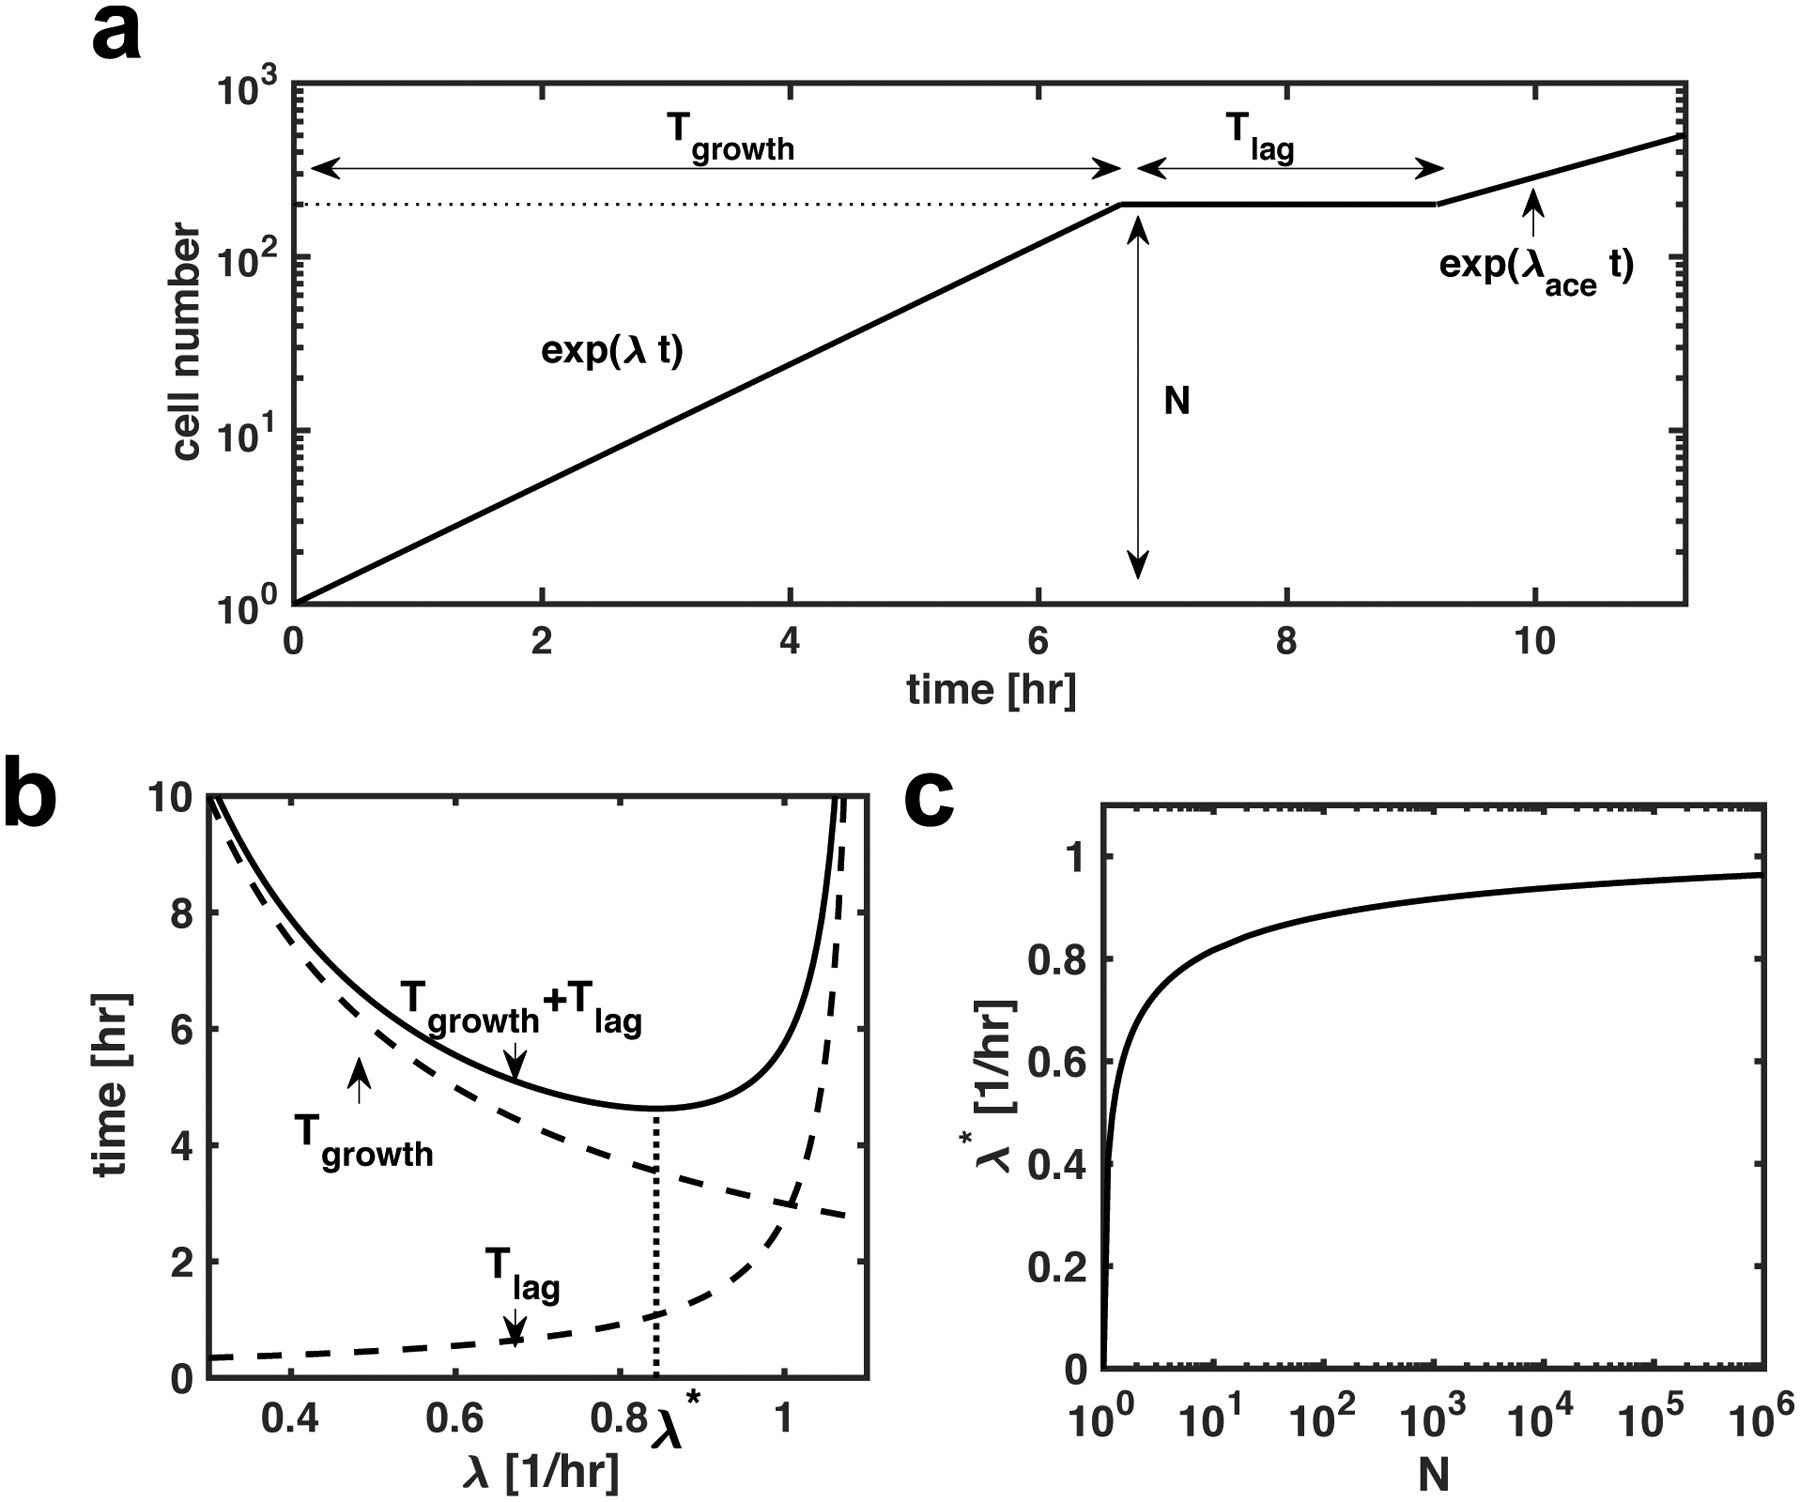
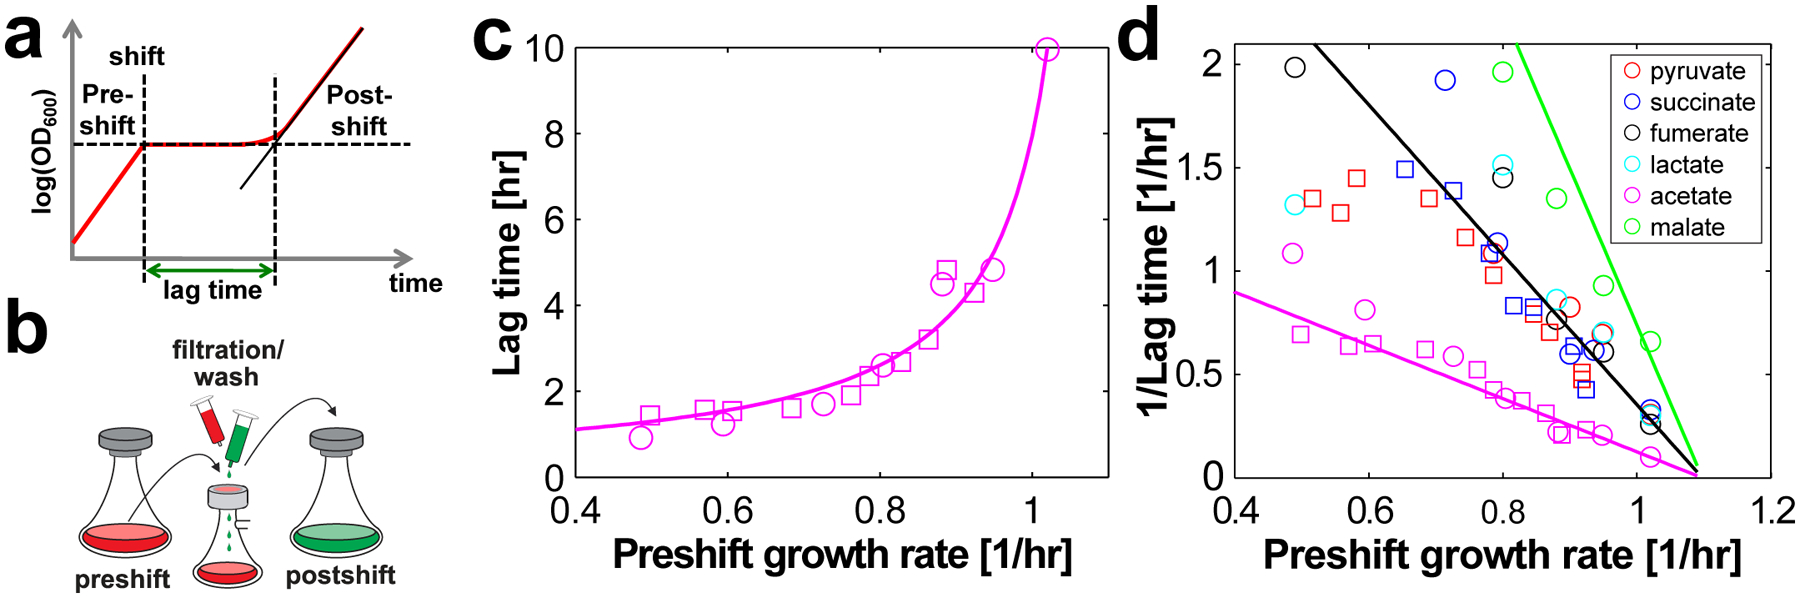
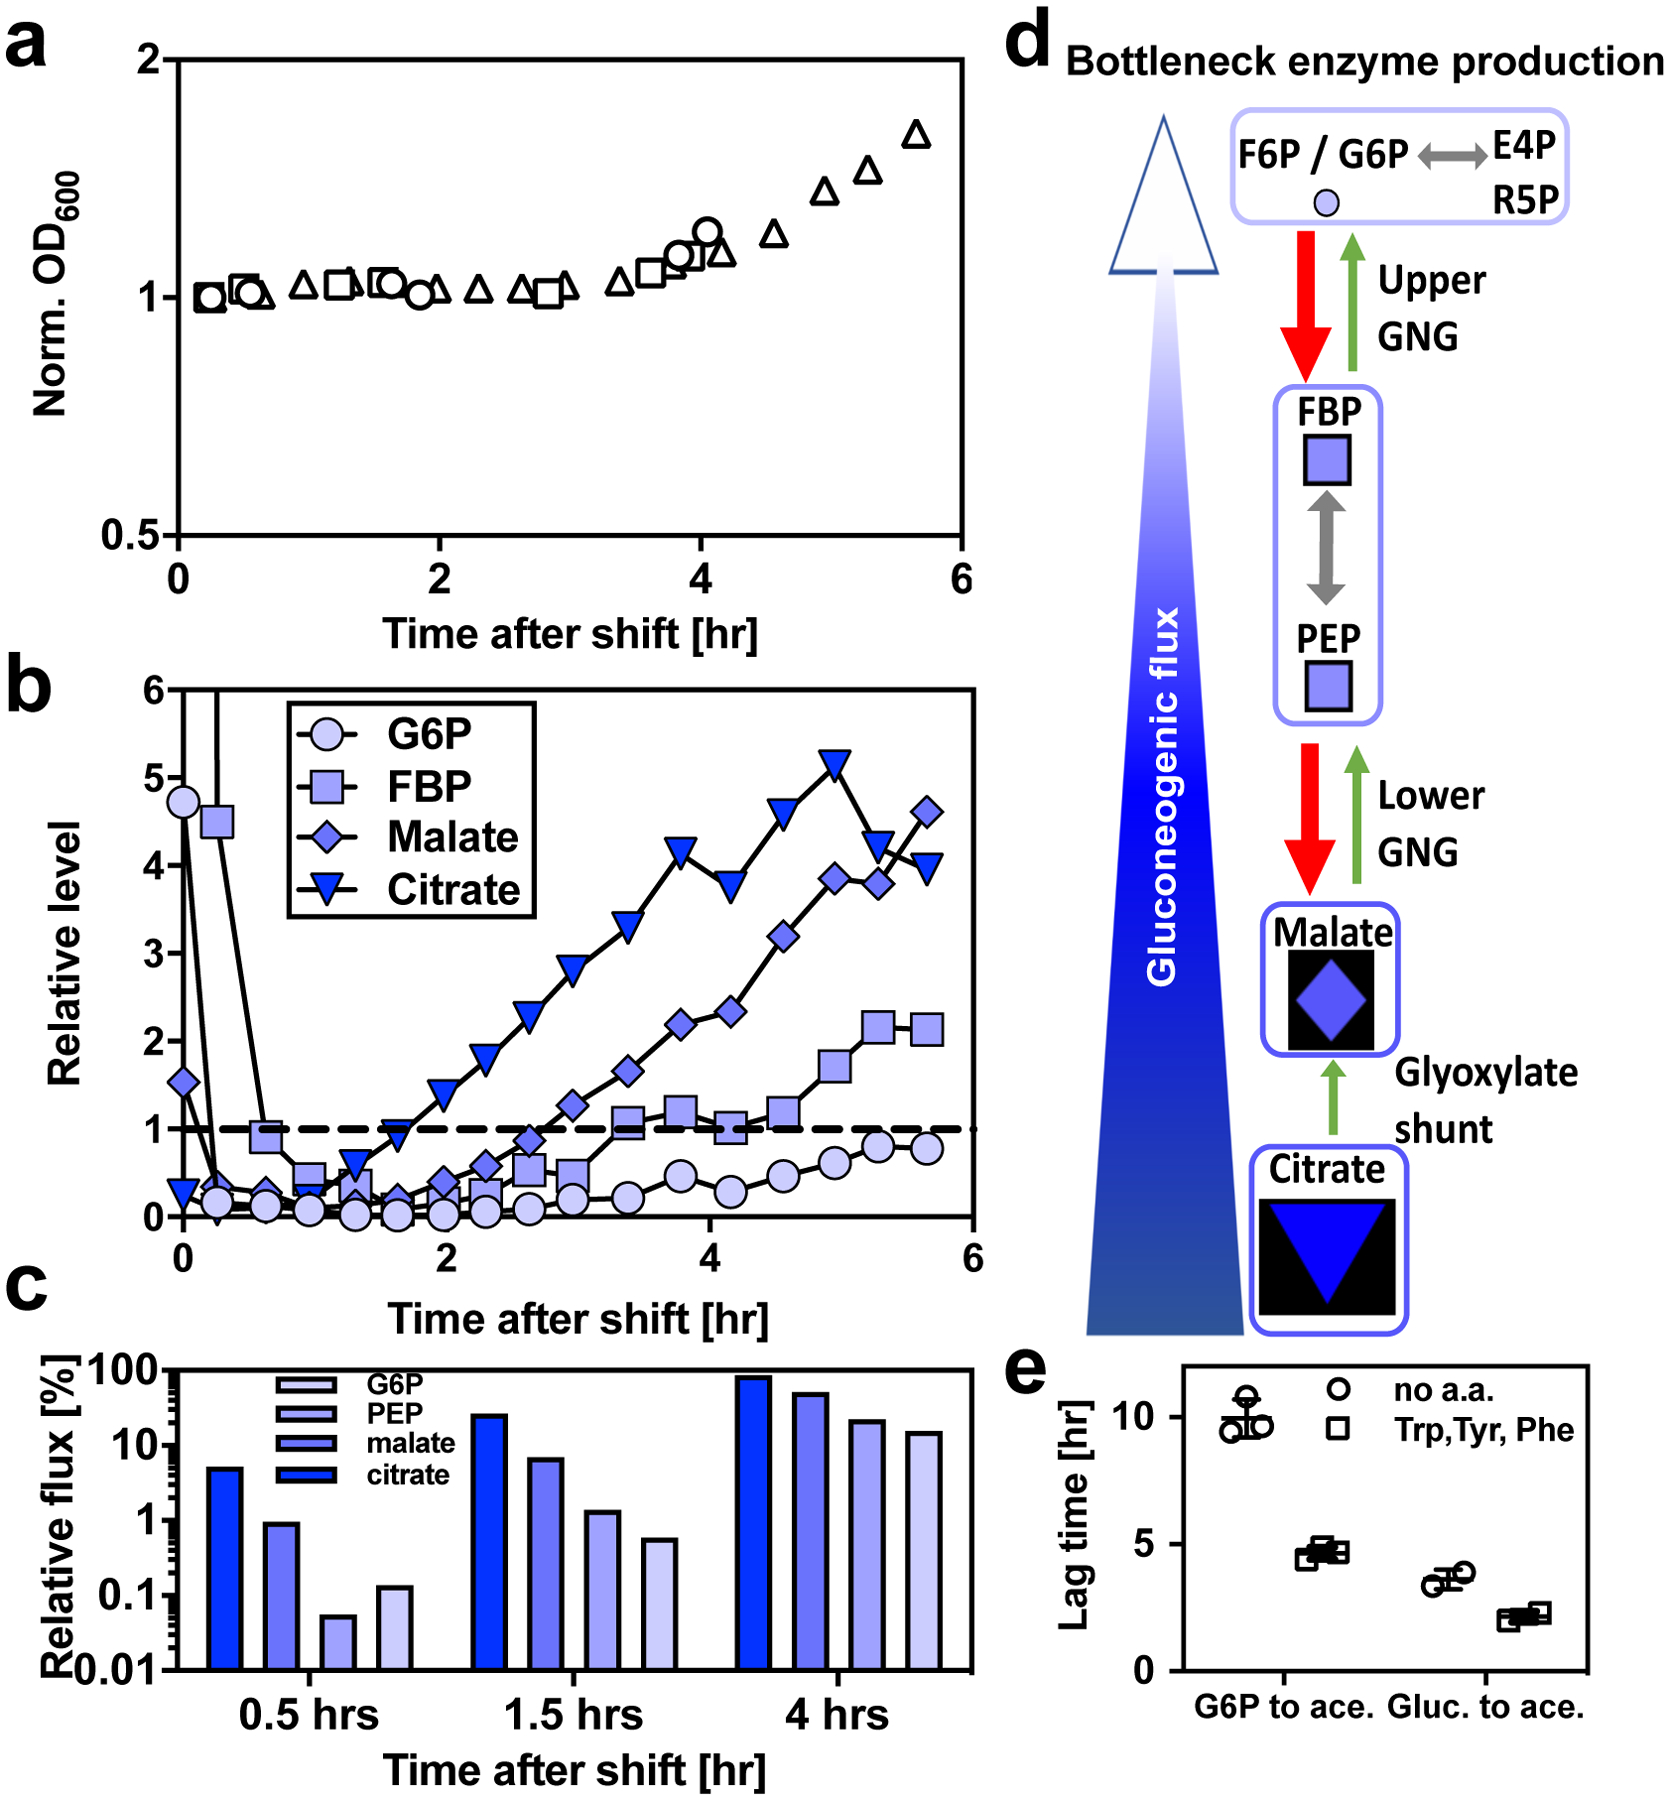
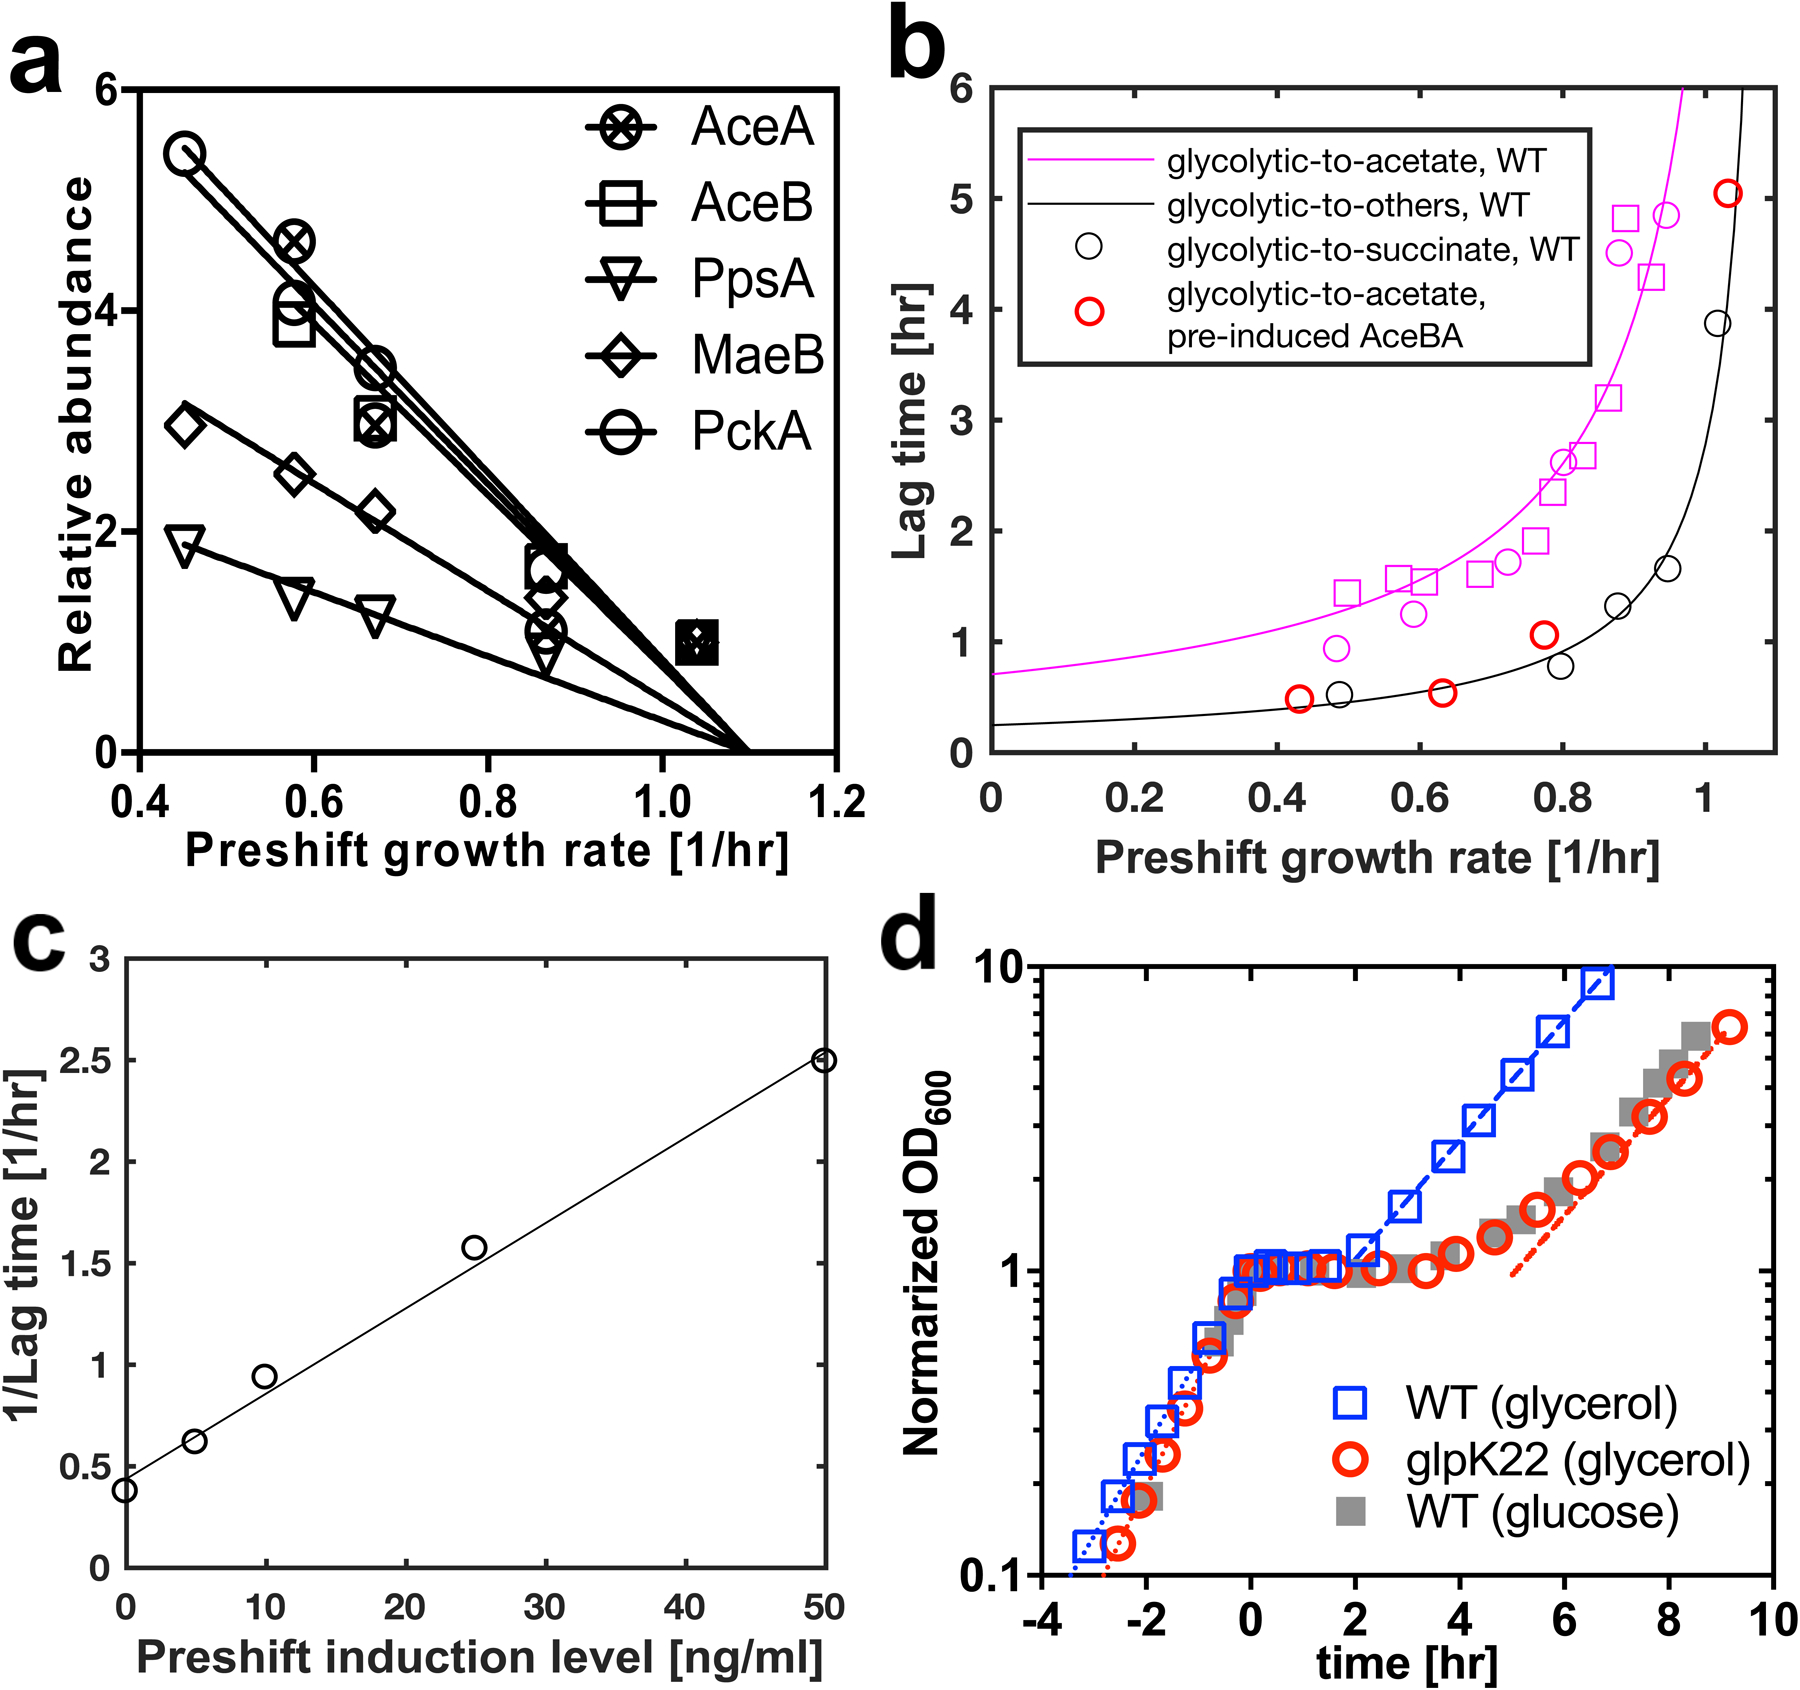
The rate of cell growth is crucial for bacterial fitness and drives the allocation of bacterial resources, affecting, for example, the expression levels of proteins dedicated to metabolism and biosynthesis1,2. It is unclear, however, what ultimately determines growth rates in different environmental conditions. Moreover, increasing evidence suggests that other objectives are also important3-7, such as the rate of physiological adaptation to changing environments8,9. A common challenge for cells is that these objectives cannot be independently optimized, and maximizing one often reduces another. Many such trade-offs have indeed been hypothesized on the basis of qualitative correlative studies8-11. Here we report a trade-off between steady-state growth rate and physiological adaptability in Escherichia coli, observed when a growing culture is abruptly shifted from a preferred carbon source such as glucose to fermentation products such as acetate. These metabolic transitions, common for enteric bacteria, are often accompanied by multi-hour lags before growth resumes. Metabolomic analysis reveals that long lags result from the depletion of key metabolites that follows the sudden reversal in the central carbon flux owing to the imposed nutrient shifts. A model of sequential flux limitation not only explains the observed trade-off between growth and adaptability, but also allows quantitative predictions regarding the universal occurrence of such tradeoffs, based on the opposing enzyme requirements of glycolysis versus gluconeogenesis. We validate these predictions experimentally for many different nutrient shifts in E. coli, as well as for other respiro-fermentative microorganisms, including Bacillus subtilis and Saccharomyces cerevisiae.


Conflict of interest statement

Ethics declarations

The authors declare no competing financial or non-financial interest.

Figures

Extended Data Fig. 1:
Extended Data Fig. 1:. Growth curves for shifts.
a, Shifts from different glycolytic carbons to acetate by filtration. Long lag phases can consist of several hours without detectable biomass production. There are large variations in the duration of lag phase in the shift to acetate between different preshift carbon sources. The duration of lag phase correlates with preshift growth rate. Fast growth before the shift results in very long lag times. b-d, Comparisons of lag times from filtration shifts and diauxie. b, 1.7mM glucose to 60mM acetate. c, 1.7 mM glucose to 30 mM succinate. d, 1.7 mM glucose to 40 mM pyruvate. Lag times resulting from filtration shifts and from classical diauxie experiments are mostly comparable. In the case of pyruvate (panel c), the presence of pyruvate in the medium in addition to glucose adversely affected the growth rate resulting in a shorter lag time in the diauxie shift, consistent with our general observation of the growth rate dependence of lag times.
Extended Data Fig. 2:
Extended Data Fig. 2:. Lag time growth rate relations.
a-f, Inverse of resulting lag times as a function of preshift growth rate in glycolytic conditions. Each panel summarizes shifts to a particular postshift medium: a, to acetate; b, to pyruvate; c, to succinate; d, to fumarate; e, to lactate; f, to malate. Preshift growth rate was modulated via different carbon sources (circles) and via lactose uptake titration (squares). Solid lines are non-linear least-squares fits (MATLAB lsqcurvefit function) of lag times as a function of preshift growth rates by the relation given by Eq. [1]. Most lag phases agree very well with Eq. [1] and only some shifts with short lag times (low growth rates) deviate somewhat from the relation given by Eq. [1]. This is partly the result of plotting inverse lag times, which amplifies relatively small experimental variations of lag times for short lag phases. These fits allow us to estimate 95% confidence intervals for model parameters (MATLAB nlparci function), most importantly for the critical growth rates λ0. Acetate: λC = (1.10±0.01)/hr, α =0.78±0.10, n =17; pyruvate: λC = (1.12±0.03)/hr, α =0.33±0.07, n =17; succinate: λC = (1.13±0.04)/hr, α =0.33±0.09, n =14; fumarate: λC = (1.08±0.02)/hr, α =0.23±0.07, n =5; lactate: λC = (1.09±0.05)/hr, α =0.22±0.15, n =5; malate: λC = (1.17±0.09)/hr, α =0.22±0.11, n =5. g, Lag times as a function of steady-state growth rates in the postshift medium for different preshift media. Colored solid lines are linear regressions of the corresponding colored data points. Carbon source that allow a slower growth rates tend to result in longer lag phases, when they are the postshift carbon sources. This intuitive correlation has previously been characterized.
Extended Data Fig. 3:
Extended Data Fig. 3:. Single cell behavior during glucose to acetate shift in microfluidics.
a. Schematic of the microfluidic device (mother-machine) in which bacterial cells are grown. The cells are loaded in narrow trenches (inset), where they are diffusively fed from the media flowing through the feeding lane. As cells grow out of the trenches, they are washed away by the media flow. We focused solely on the cells at the bottom of each trench, also called ‘mother cells’, since they are kept for the entire duration of the experiment. b. Experiment schematic. Cells were recovered in the mother machine using glucose medium, and then connected to a flask with culture growing in the same medium. Media switch was performed the same way as for the batch cultures, and the flow was then restarted towards the mother machine. We noticed that cells continued growing for a short time after filtration both in batch and in the Mother machine, presumably because of residual glucose in the system and therefore the experiment most resembles a diauxic shift. c. Instantaneous single-cell growth rates determined from cell length. Individual cells length traces were used to compute instantaneous growth rates. The light blue points and shaded area around them represent the population average and standard deviation of the single-cell instantaneous growth rates. The orange trace is the instantaneous growth rate trace of an exemplary cell. d. Single-cell lag time distribution. Lag time is defined as the time delay in growth after the switch as compared to instantaneous growth at the maximum postshift growth rate. The instantaneous growth rate traces were used to compute single-cell lag times (see Materials and Methods section for details). The red dashed line is the mean of the lag time distribution of the tracked cells. Cells tracked in the Mother machine introduce a bias for long lag times, because growing cells are washed away instead of being amplified as happens in the batch culture. Therefore, we also calculated the expected batch lag time (2.69 h), when taking into account growth of cells as described in the Materials and Methods section (gray dashed line). e. Growth curve of the batch culture connected to the microfluidic after the shift was used to determine lag time of the connected batch culture (4.14 h). The quantitative agreement between the microfluidics and the batch is not perfect. Nevertheless, the single-cell distribution of lag times establishes that the response of individual cells after the shift is unimodal and that the lag time is not governed by a small sub-population of cells that grows immediately on acetate as expected by Kotte et al.. We see no reason why this population of cells should not be present in the microfluidics if it were present in the batch. Our data also showed no evidence for the prediction by Kotte et al. that most cells would never recover and grow after the shift. However, because the cells were grown in a microfluidic chip, this experiment cannot definitively rule out that the recovery of growth observed here is due to differences in the conditions. To determine if such a non-growing population exists in the batch culture, we performed another experiment as described in Extended Data Fig. 4.
Extended Data Fig. 4:
Extended Data Fig. 4:. Single cell behavior during glucose to acetate shift via time-lapse microscopy of batch culture:
a, Schematic illustration of the experimental protocol (see Supplementary Materials and Methods, Batch microscopy). After the medium shift from glucose to acetate, the culture was split into two identical 6-well glass bottom plates. One was briefly centrifuged and placed into an incubator on a microscope for time-lapse microscopy. The other was placed in a shaker incubator as a control, and OD600 was monitored manually. b, Growth curves from two biological repeats (circles and squarters), obtained by monitoring OD600 from the control 6-well plate after the media switch. The calculated lag time is 295 min, virtually identical to the batch culture lag time that we characterized in the shift from glucose to acetate (Fig. 1), indicating that the environment of the 6-well plate is almost identical to that of the batch culture as far as the lag time is concerned. c, Normalized single-cell-area traces from two biological repeats taken with the microscope in the other plate (n=1761, total number of trace). We use cell area as a metric for biomass growth. Light blue traces indicate cells that crossed an arbitrary 10% area-increase threshold within the time of our observation (see Materials and Methods, Batch microscopy). Red traces indicate the cells that did not cross the 10% threshold. We observed 1500 cells crossing the threshold, while 261 did not cross it -- before they became unobservable, either because they detached from the glass or were flooded by other cells. d, Histogram showing the distribution of the time it takes for individual cells to increase its area by 10%. e, Plot showing the fractions of cells (y axis) that grew in cell area by at least the amount shown on the x axis, relative to their initial size. These data show that the vast majority of cells recovers after an initial lag phase, eventually growing on acetate. Despite the relatively short observation window of 5–6 hours, roughly equal to the batch lag time (when cells are flooded by other faster growing cells and cannot be further observed by microscopy), the data establish that the vast majority of cells exhibits substantial growth (see panel e). For example a 10% increase in cell area is easily detectable and we observed that 85% of cells crossed this threshold. We note that cells that crossed this threshold grew continuously over the course of observation and exhibited a single-cell growth curve and lag time (seen panels c & d), similar to the batch lag time. This indicates that no more than 15% of cells were completely growth arrested after the shift to actetate, even during this very limited window of observation. This shows that in the lag phases that we study here, the dormant subpopulations proposed previously played a negligible role for determining lag times. (As an example, even if we assume the ~15% non-growing cells observed never ever recover growing again, they would only contribute ~21 minutes to the total lag time of 295 minutes).
Extended Data Fig. 5:
Extended Data Fig. 5:. Absolute and relative concentrations of key metabolites in a shift from glucose to acetate.
a, Intracellular concentration of F6P the 3 biological repeats of the shift from glucose to acetate presented in Fig. 2 of the main text. The dashed line represents the steady state level of F6P for growth on acetate. The concentration of F6P is low compared to Michaelis constants of key enzymes Pgi and TktA, which catalyze the first reactions from F6P for the production of essential precursors for biomass production E4P and R5P. b, Intracellular concentration of PEP over the course of lag phase for a shift from glucose to acetate (red symbols) and a shift from mannose to acetate (green symbols). Steady-state concentrations on glucose and acetate are indicated by the dashed lines. PEP is a key repressor of glycolytic flux by inhibiting Pfk. The concentration of PEP remained low throughout lag phase, even compared to the steady-state concentration on glucose (dotted line), where Pfk is very active. c, Time courses of FBP and PEP concentrations throughout lag phase in a shift from glucose to acetate. Concentrations of FBP and PEP were normalized by their steady-state concentration during exponential growth on acetate. FBP drops from its steady-state level for growth on glucose, which is more than 100-fold higher than the steady-state level on acetate (normalized to 1). PEP remains at very low concentrations and slowly builds up together with FBP 1.5 h after the shift. In the framework of our model, we attribute this phase to the slow increase in gluconeogenic enzymes from protein synthesis.
Extended Data Fig. 6:
Extended Data Fig. 6:. Proteomics characterization of lag phase dynamics.
a-f, Gluconeogenic enzymes. Relative levels of gluconeogenic enzymes at different times during lag phase from glucose to acetate (ace t0: immediately after the shift, ace t6: exiting lag phase, 6 hours after the shift) and glucose to pyruvate (pyr t0: immediately after the shift, pyr t1: exiting lag phase, 1 hour after the shift) and in different steady state conditions glucose (glu), pyruvate (pyr), acetate (ace). a, isocitrate lyase (AceA); b, malate synthase (AceB); c, fructose-1,6-bisphosphatase (Fbp); d, malate dehydrogenase (MaeB); e, phosphoenolpyruvate carboxykinase (Pck); f, PEP synthase (Pps). g-j, Glycolytic enzymes. Relative levels of irreversible glycolytic enzymes at different times during lag phase from glucose to acetate (ace t0: immediately after the shift, ace t6: exiting lag phase, 6 hours after the shift) and glucose to pyruvate (pyr t0: immediately after the shift, pyr t1: exiting lag phase, 1 hour after the shift) and in different steady state conditions glucose (glu), pyruvate (pyr), acetate (ace). g, 6-phosphofructokinase I (PfkA); h, 6-phosphofructokinase II (PfkB); i, PEP carboxylase (Ppc); j, pyruvate kinase I (PykF). The black dots indicate the weighted median value, derived from multiple measurements, calculated by using as weights the confidence of a sample’s quality, as derived by a support vector model, which was set up to classify samples into “high quality” or “low quality”, using a training set of several thousand samples that were classified by hand. The weights’ range is [0,1] and can be found as a separate attribute (named svmPred) for each sample in the accompanying source file. The grey dots indicate individual measurements and the size of the dot indicates the confidence for this particular measurement (the larger the dot the higher the confidence that this measurement is of high quality). The size of the dot was defined using the “MarkerSize” attribute of the “plot” function in Matlab. In particular, the dot size was calculated as the confidence value of the measurement (svmPred attribute in the accompanying file) times 11 (this number was used to allow clearer plotting of the dots and enhancement of the visual inspection capabilities). If the product of this multiplication for a certain measurement was below a certain minimum value (in our case, 1.8), the size of the dot was set to be this minimum, as below that value the dot was not visible with the naked eye.
Extended Data Fig. 7:
Extended Data Fig. 7:. Illustration of sequential flux limitation model and tradeoff between growth and lag.
a, Intuitively, in our model, lag phases emerge because the gluconeogenic flux JGNG (blue arrow) limits protein synthesis (green arrow), which includes the synthesis of gluconeogenic enzymes. Therefore, the production rate of limiting gluconeogenesis is proportional to the gluconeogenic flux ddtϕGNG,lowerJGNG. The gluconeogenic flux JGNG, in turn, depends on limiting metabolite concentrations. b, To understand the dynamic scaling of these metabolite concentrations, based on the biochemistry of the pathway, we describe gluconeogenesis by a coarse-grained model comprising two irreversible steps (upper and lower gluconeogenesis), connected by reversible reactions. Upper gluconeogenesis does not appear to be limited by its enzyme (Fbp), whose abundance changed only moderately throughout the lag phase and across growth conditions (see Extended Data Fig. 6 & proteomics data from Hui et al). We thus assume the flux through upper gluconeogenesis (top blue arrows) to be limited by the concentration of its substrate, FBP, i,e, JGNG ∝ [FBP]. The latter is connected to the output of lower gluconeogenesis, PEP, by the realtion [FBP] ∝ [PEP] due to the stoichiometry of the reversible reactions (grey arrows). The enzymes of lower gluconeogenesis do appear to be limiting based on previously measured proteomics data (Fig. 3a, Extended Data Fig. 6). We assume that lag phase is dominated by a quasi-stationary phase, where transcriptional regulation can be considered constant and therefore the abundances of gluconeogenic enzymes change throughout the lag phase in proportion to each other, characterized by ϕGNG, lower. We assume that the abundances of gluconeogenic enzymes change in proportion to each other throughout the lag phase, characterized by ϕGNG, lower. This assumption is quite plausible as the expression of gluconeogenic enzymes is primarily controlled by a common transcription factor Cra. In support of this assumption, we note that for different preshift (steady-state) conditions, the abundances of different gluconeogenic enzymes are also proportional to each other as they show the same linear growth-rate dependence (Fig. 3a). The flux through lower gluconeogenesis (bottom blue arrow), which is proportional to [PEP], then is governed by ϕGNG, lower. Thus,[PEP] ∝ ϕGNG, lower, resulting in JGNGϕGNG,lower2. c, At fast glycolytic growth (top), glycolytic enzymes are highly abundant (thick red arrows), whereas gluconeogenic enzymes are low (thin green arrows). Enzyme composition therefore strongly favors glycolysis, which result in severe depletion of metabolites in gluconeogenesis after the shift to gluconeogenic conditions and a long lag phase. On the other hand, for slow glycolytic growth (bottom), the ratio of glycolytic and gluconeogenic enzymes is much more balanced (red and green arrows of similar thickness), resulting in an improved carbon supply to gluconeogenesis after shift and hence a shorter lag.
Extended Data Fig. 8:
Extended Data Fig. 8:. Preshift overexpression of glycolytic enzymes.
Lag times from glucose to a, acetate, b, pyruvate, c, malate, d, succinate, with preshift overexpression of glycolytic enzymes PykF (strain NQ1543) or Pfk (strain NQ1544), compared to the preshift overexpression of a control enzyme ArgA (strain NQ1545), with the overexpressed protein all harbored on the same plasmid (pNT3) from the tac promoter. Lines and error bars indicate mean and standard deviation (n=4). Lag times more than doubled from preshift overexpression of Pfk or PykF. These results indicate that residual activity of glycolytic enzymes plays an important role in lag phase despite the existence of allosteric regulation of these glycolytic enzymes. Consistent with this picture, the concentration of PEP, a key regulatory metabolite and repressor of glycolytic flux, remained low throughout lag phase, even compared to steady-state levels on glycolytic carbons (see Extended Data Fig. 5).
Extended Data Fig. 9:
Extended Data Fig. 9:. Improved growth of Cra knockout and tradeoff for other microbes.
a, Growth rates of Cra knockout on glycoltic carbon sources. Growth rates on several slow glycolytic carbon sources are significantly improved in the Cra knockout as compared to WT. The Cra knockout expresses very low levels of most gluconeogenic enzymes and glycolytic enzymes are derepressed. As a consequence, a Cra knockout strain cannot grow on most gluconeogenic carbon sources. b-d, Growth-adaptation tradeoff in wildtype yeast strains and B. subtilis. We grew two different wildtype yeast strains (YPS163 and YPS128), as well as a B. subtilis strain at different preshift growth rates, before shifting them to acetate (panel b, c) and fumarate (panel d) minimal medium respectively. After the shift, culture density OD600 was monitored as a function of time. Data points indicate the mean and error bars are the standard deviation from 3 biological replicates (n=3). The lag time of the growth curves increases with increasing preshift growth rate (given in the legend), suggesting a tradeoff similar to that characterized for E. coli (main text, Fig. 1). e, Growth comparison between E. coli and B. thetaiotaomicron, an obligatory anaerobe. The growth rate of E. coli NCM3722 on a number of common carbon substrates from the ‘top’ (i.e., glycolysis and pentosephosphate pathways) exhibit a range of values from 0.9/h down to 0.5/h (blue bars). The growth rates of B. thetaiotaomicron on the same substrates in anaerobic condition (red bars) are all within 10% of each other. For comparison, we also show the growth rates of NCM3722 on the same substrates in anaerobic condition (green bars). They are largely correlated with their aerobic growth rates, with the fast ones comparable to that of B. thetaiotaomicron (~0.6/h) and the slow ones at about 1/5 of the fast ones. Saturating amounts of substrates were used, 15mM in all cases except for E. coli on mannose where 40mM was used.
Extended Data Fig. 10:
Extended Data Fig. 10:. Optimal growth rate as a function of expected abundance of the substrate in the environment.
a, Cell initially grow by a factor N (reflecting the expected carbon abundance) for time Tgrowth at the growth rate λ. When carbon runs out the cells enter lag phase, chartacterized by the lag time Tlag. After the lag time, cells again grow exponentially, e.g. on a fermentation product, acetate, at growth rate λace. b, The optimal strategy for the cell minimizes the total time before postshift exponential growth (resulting in the same cell number, but starting growth first). The total time before postshift growth resumes is the sum of the growth time Tgrowth =log(N)/λ and the lag time, given by Eq. [1] of the main text, Tlag=1/[α(λ0λ)], both of which are influenced by the growth rate λ. The optimal growth rate λ* minimizes this total time and the expression for λ* is given by λ*=λ0αln(N)1+αln(N). c, For the strain NCM3722, the expression for the optimal growth rate λ* given Eq. [6] of the main text is plotted versus the expected carbon abundance, given by N. The value of α was determined from the fit in Fig. 1d, to the majority of glycolytic carbon sources (black line). Interestingly, for realistic carbon abundances, the range of optimal growth rates spans precisely the relatively narrow range of growth rates on naturally occurring carbon sources, observed for the wild-type E. coli strain NCM37222, e.g. glucose (0.95/hr), mannitol (0.90/hr), maltose (0.79/hr), glycerol (0.70/hr), galactose (0.59/hr), mannose (0.49/hr). The optimal growth rate only substantially drops below 0.5/hr, when the expected preshift carbon abundance allows for less than a single doubling N < 2, and only surpasses 1.0/hr at enormous, unrealistically high carbon abundances N > 1012, explaining the absence of naturally occurring carbon sources that result in such growth rates.
Fig. 1:
Fig. 1:. Phenomenological characterization of lag phase. a,
Schematic illustration of a typical growth curve. Lag time is defined as the time lost in the transition as compared to an instantaneous switch to final steady-state growth. b, Illustration of the medium transfer protocol. c, Lag times after shifts from different glycolytic carbon sources (circles) and different lactose uptake rates (strain NQ381 with titrable lactose uptake system, squares) to acetate minimal medium. The preshift glycolytic carbon sources from fast growth rates to slow growth rates are glucose 6-P, glucose, mannitol, maltose, glycerol, galactose, mannose, which are all readily metabolized by wildtype E. coli, yet result in very different growth rates. The solid line represents the empirical relation given by Eq. [1]. d, Inverse lag times for shifts from different glycolytic to gluconeogenic carbon sources, plotted against preshift growth rates. Colors indicates shift to the postshift carbon sources given in the insets; different circles of the same color indicate different preshift carbon sources, while squares indicate the use of titrable lactose uptake in preshift. Lines are non-linear least-mean squares fits of Eq. [1] to data of lag time as a function of preshift growth rate for the shifts to acetate (magenta line), succinate and pyruvate (black line) from our batch culture experiments (Table S2), assuming λC ≈1.1/hr. For the shift to malate, we performed an additional fit, again assuming λC ≈1.1/hr (green line). Non-linear least-mean squares fits of Eq. [1] to individual shifts are presented in Extended Data Fig. 2 and the resulting 95%-confidence intervals of paramters are as follows: Acetate: λC =(1.10±0.01)∕hr, α =0.78±0.10, n =17; pyruvate:λC =(1.12±0.03)∕hr, α =0.33±0.07, n =17; succinate: λC =(1.13±0.04)∕hr, α =0.33±0.09 , n =14; fumarate: λC =(1.08±0.02)∕hr, α =0.23±0.07, n =5; lactate: λC =(1.09±0.05)∕hr, α =0.22±0.15, n =5; malate: λC =(1.17±0.09)∕hr, α =0.22±0.11 , n =5. The mean critical growth rate and standard deviation resulting from the individual fits are given by λC =(1.11±0.03)∕hr.
Fig. 2:
Fig. 2:. Metabolic characterization of lag phase during shifts to acetate. a,
Normalized cell density during lag phase of the three shifts from glucose to acetate used for metabolite measurements (triangles) and flux measurements (squares, circles). b, Temporal profiles of metabolites, glucose 6-P (G6P), fructose-1–6-bisP (FBP), malate, citrate, throughout lag phase from glucose to acetate normalized by their respective values in postshift medium during exponential steady-state growth (dashed line). Steady-state metabolite concentrations during exponential growth were measured in seperate experiments by taking three metabolite measurements throughout the exponential growth curve for two biological repeats. The metabolite concentrations during the lag phase were then normalized by these steady-state concentrations. Time zero values are measured preshift levels. For FBP this value falls outside the scale (approximately 157). c, Fluxes to different metabolites (see panel b) at three time points during the lag phase from glucose to acetate, as a percentage of the steady-state flux during growth on acetate (measured in separate steady-state experiments for two biological repeats). Error bars are standard deviations from biological repeats. d, Schematic illustration of glycolysis / gluconeogenesis. The large fading blue arrow indicates the directionality of gluconeogenesis and illustrates the decrease in normalized fluxes and metabolite pools. Green arrows indicate irreversible gluconeogenic reactions catalyzed by gluconeogenic enzymes and red arrows indicate the residual activity of glycolytic enzymes acting in the opposite direction. Erythrose-4-P (E4P) and ribose-5-P (R5P) fructose 6-P (F6P) are derived from fructose 6-P (F6P)/G6P and are required for the biosynthesis of specific amino acids and nucleotides. e, The addition of three non-degradable amino acids, Tyrosine (Tyr), Tryptophan (Trp), Phenylalanine (Phe), derived from upper glycolysis to the postshift growth medium substantially reduces lag times in shifts to acetate that we tested from preshift growth on glucose and on glucose 6-P.
Fig. 3:
Fig. 3:. Tests of model predictions.
a, Relative abundance of gluconeogenic enzymes at different growth rates during steady-state exponential growth in glycolytic conditions; data from Hui et al.. Enzymes are isocitrate lyase (AceA), malate synthase A (AceB), phosphoenolpyruvate synthetase (PpsA), malate dehydrogenase (maeB), and phosphoenolpyruvate carboxykinase (PckA). The lines are linear fits assuming a characteristic growth rate λC at which lower gluconeogenic enzymes are not expressed anymore, given by λC≈1.1∕hr, identical to the critical growth rate at which lag times diverge λ0≈1.1/hr, determined in Fig. 1c. b, Lag times during shifts from various carbon sources to gluconeogenic carbon sources. Magenta lines and symbols represent shifts to acetate for WT cells; data shown in Fig. 1c &1d. Bold red symbols represent reduced lag time for shifts to acetate by a strain with preshift expression of enzymes of the glyoxylate shunt, AceBA. The data fall on the black line, which is the trendline of lag time for shifts by the WT to other gluconeogenic carbon sources shown in Fig. 1d. As an example, the black symbols represent shifts to succinate. c, Inverse lag times for shifts from glucose to pyruvate, plotted against different preshift induction levels of phosphoenolpyruvate synthetase (PpsA), for a strain harboring titratable PpsA expression. d, Growth of strain NQ898 harboring the glycerol uptake mutant glpK22 (red) is faster than the wildtype strain NCM3722 in preshift glycerol medium (0.82/hr vs 0.68/hr), but the lag time (as defined in Fig. 1b) upon abrupt shift to acetate at time t = 0 is substantially longer (5.1hr vs. 1.9hr). For comparison, the transition of wildtype strain grown in preshift glucose medium (0.87/hr) to acetate is shown in grey. The dashed lines indicate the steady state growth rates of the two strains in acetate, both about 0.45/hr.

Comment in

Similar articles

Cited by

References

    1. Scott M, Gunderson CW, Mateescu EM, Zhang Z & Hwa T Interdependence of cell growth and gene expression: origins and consequences. Science 330, 1099–102 (2010). - PubMed
    1. Basan M et al. Overflow metabolism in Escherichia coli results from efficient proteome allocation. Nature 528, 99–104 (2015). - PMC - PubMed
    1. Hui S et al. Quantitative proteomic analysis reveals a simple strategy of global resource allocation in bacteria. Mol. Syst. Biol (2015). - PMC - PubMed
    1. LaCroix RA et al. Use of Adaptive Laboratory Evolution To Discover Key Mutations Enabling Rapid Growth of Escherichia coli K-12 MG1655 on Glucose Minimal Medium. Appl. Environ. Microbiol 81, 17–30 (2015). - PMC - PubMed
    1. Utrilla J et al. Global Rebalancing of Cellular Resources by Pleiotropic Point Mutations Illustrates a Multi-scale Mechanism of Adaptive Evolution. Cell Syst. 2, 260–271 (2016). - PMC - PubMed

Publication types

MeSH terms