. 2020 Jul;583(7817):590-595.
doi: 10.1038/s41586-020-2496-1. Epub 2020 Jul 15.

A single-cell transcriptomic atlas characterizes ageing tissues in the mouse

Collaborators

A single-cell transcriptomic atlas characterizes ageing tissues in the mouse

Tabula Muris Consortium. Nature. 2020 Jul.

Abstract

Ageing is characterized by a progressive loss of physiological integrity, leading to impaired function and increased vulnerability to death1. Despite rapid advances over recent years, many of the molecular and cellular processes that underlie the progressive loss of healthy physiology are poorly understood2. To gain a better insight into these processes, here we generate a single-cell transcriptomic atlas across the lifespan of Mus musculus that includes data from 23 tissues and organs. We found cell-specific changes occurring across multiple cell types and organs, as well as age-related changes in the cellular composition of different organs. Using single-cell transcriptomic data, we assessed cell-type-specific manifestations of different hallmarks of ageing-such as senescence3, genomic instability4 and changes in the immune system2. This transcriptomic atlas-which we denote Tabula Muris Senis, or 'Mouse Ageing Cell Atlas'-provides molecular information about how the most important hallmarks of ageing are reflected in a broad range of tissues and cell types.


Conflict of interest statement

Ethics declarations

Competing interests

The authors declare no competing interests.

Figures
Extended Data Figure 1.
Extended Data Figure 1.. Overview of Tabula Muris Senis (cont.)
a,b, UMAP plot of all cells collected for FACS colored by tissue (a) or age (b). c, UMAP plot of all cells collected by FACS, colored by organ (Extended Data Figure 4c), overlaid with the Louvain cluster numbers. n = 110,824 individual cells for FACS. d,e, UMAP plot of all cells collected for droplet colored by tissue (d) or age (e). f, UMAP plot of all cells collected by droplet, colored by organ (Extended Data Figure 4c), overlaid with the Louvain cluster numbers. n = 245,389 individual cells for droplet. g, B cells (top) and endothelial cells (bottom) in FACS independently annotated for each organ cluster together by unbiased whole-transcriptome Louvain clustering, irrespectively of the organ they originate from. h, B cells (and endothelial cells) in droplet independently annotated for each organ cluster together by unbiased whole-transcriptome Louvain clustering, irrespectively of the organ where they were found. i,j, UMAP plot of all cells collected colored by method (i) or tissue (j). n = 356,213 individual cells for FACS and droplet combined. k,l, B cells (k) and endothelial cells (l) cluster together by unbiased whole-transcriptome Louvain clustering, irrespectively of the technology with which they were found.
Extended Data Figure 2.
Extended Data Figure 2.. Overview of Tabula Muris Senis (cont.)
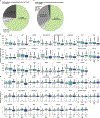
a, Pie chart with the summary statistics for FACS. b, Pie chart with the summary statistics for droplet. c, Box plot of the number of genes detected per cell for each organ and age for FACS d, Box plot of the number of reads per cell (log-scale) for each organ and age for FACS. For c and d, all data are expressed as mean ± s.d. The sample size (number of cells for each tissue and age) is available in Supplementary Table 1.
Extended Data Figure 3.
Extended Data Figure 3.. Overview of Tabula Muris Senis (cont.)
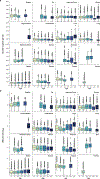
a, Box plot of the number of genes detected per cell for each organ and age for droplet. b, Box plot of the number of UMIs per cell (log-scale) for each organ and age for droplet. All data are expressed as mean ± s.d. The sample size (number of cells for each tissue and age) is available in Supplementary Table 2.
Extended Data Figure 4.
Extended Data Figure 4.. Overview of Tabula Muris Senis (cont.)
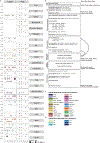
a, Balloon plot showing the number of sequenced cells per sequencing method per organ per sex per age. b, Schematic analysis workflow. c,d, Tabula Muris Senis color dictionary for organs and tissues (c) and ages (d).
Extended Data Figure 5.
Extended Data Figure 5.. Comparison of bulk and single-cell datasets and Tissue cell compositions.
a,b, Aging patterns from bulk and single-cell data are consistent. Strong changes in bulk gene expression with aging can be either explained by cell or read count-based changes in single-cell data FACS (a) and droplet (b). Two-sided Wilcoxon–Mann–Whitney indicates that single-cell data based log2 fold-changes of cell or read counts distinguish between up and down regulated genes in bulk data. n = 110,824 individual cells for FACS and n = 245,389 individual cells for droplet. c, Mammary gland T cell relative abundances change significantly with age (p-value<0.05 and r2>0.7 for a hypothesis test whose null hypothesis is that the slope is zero, using two-sided Wald Test with t-distribution of the test statistic). d, Top 20 upregulated and downregulated genes in mammary gland computed using MAST, treating age as a continuous covariate while controlling for sex and technology. Genes were classified as significant under an FDR threshold of 0.01 and an age coefficient threshold of 0.005 (corresponding to ~10% fold change). n=6,393; 3,635; and 5,549 individual cells for mammary gland 3m; 18m and 21m, respectively. e, Marrow precursor B cell relative abundances change significantly with age (p-value<0.05 and r2>0.7 for a hypothesis test whose null hypothesis is that the slope is zero, using two-sided Wald Test with t-distribution of the test statistic). f, Top 20 upregulated and downregulated genes in marrow computed using MAST, treating age as a continuous covariate while controlling for sex and technology. Genes were classified as significant under an FDR threshold of 0.01 and an age coefficient threshold of 0.005 (corresponding to ~10% fold change). n=3,027; 8,559; 11,496; 5,216; 12,943 and 13,496 individual cells for marrow 1m; 3m; 18m; 21m; 24m and 30m, respectively. g, Skin keratinocyte stem cell relative abundances change significantly with age (p-value<0.05 and r2>0.7 for a hypothesis test whose null hypothesis is that the slope is zero, using two-sided Wald Test with t-distribution of the test statistic). h, Top 20 upregulated and downregulated genes in skin computed using MAST, treating age as a continuous covariate while controlling for sex and technology. Genes were classified as significant under an FDR threshold of 0.01 and an age coefficient threshold of 0.005 (corresponding to ~10% fold change). n=2,346; 1,494; 4,352= and 1,122 individual cells for skin 3m; 18m; 21m and 24m, respectively. The p-values for the cell type compositional changes are shown in Supplementary Table 5.
Extended Data Figure 6.
Extended Data Figure 6.. Cellular changes during aging in the liver.
a, Liver hepatocyte relative abundances change significantly with age (p-value<0.05 and r2>0.7 for a hypothesis test whose null hypothesis is that the slope is zero, using two-sided Wald Test with t-distribution of the test statistic). n=2,791; 2,832; 3,806; 2,257; 6,384 and 5,713 individual cells for liver 1m; 3m; 18m; 21m; 24m and 30m, respectively. The p-values for the cell type compositional changes are shown in Supplementary Table 5. b-d, Brightfield imaging of hepatocytes across age (b) and respective quantification (c-d). e, Top 10 upregulated and downregulated genes in liver computed using MAST, treating age as a continuous covariate while controlling for sex and technology. Genes were classified as significant under an FDR threshold of 0.01 and an age coefficient threshold of 0.005 (corresponding to ~10% fold change). The sample size is the same as for panel a. f,k, Gene expression of Il1b and Clec4f (f) and Pecam1 and Mrc1 (k) in the liver droplet dataset for the six ages. g-j, Staining of Kupffer cells across age (g) and respective quantification (h-j). l-o, Staining of liver endothelial cells across ages (l) and respective quantification (m-o). The white scale bar corresponds to 100µm. For panels c-d, h-j and m-o, all data are expressed as mean ± s.d. and p-values were obtained using a Welch’s test. The sample size for each group is available in Supplementary Table 7.
Extended Data Figure 7.
Extended Data Figure 7.. Mutational burden across tissues in the aging mice (cont.).
a,b, Mean number of somatic mutations in genes and ERCC spike-in controls across all tissues per age group (3m and 24m (a), 3m and 18m (b), 18m and 24 (c)). Mutations are presented as the mean number of mutations per gene or ERCC spike-inn per cell.
Extended Data Figure 8.
Extended Data Figure 8.. Mutational burden across tissues in the aging mice (cont.).
a,b,c, Gene raw expression and ERCC spike-inn control raw expression across all tissues per age group (3m and 24m (a), 3m and 18m (b), 18m and 24 (c)). Raw expression are presented as the mean number of counts per gene or ERCC spike-inn control per cell.
Extended Data Figure 9.
Extended Data Figure 9.. Immune repertoire clonality analysis.
a, B-cell clonal families. For each time point, the clonal families are represented in a tree structure for which the central node is age. Connected to the age node there is an additional node (dark gray) that represents each animal and the clonal families are depicted for each animal. For each clonal family, cells that are part of that family are colored by the organ of origin. b, T-cell clonal families. For each time point, clonal families are represented in a tree structure for which the central node is age. Connected to the age node there is an additional node (dark gray) that represents each animal and the clonal families are depicted for each animal. For each clonal family, cells that are part of that family are colored by the organ of origin.
Extended Data Figure 10.
Extended Data Figure 10.. Diversity score summary.
a,b, Heatmap summary of the overall tissue diversity score for FACS (a) and droplet (b). c,d, Heatmap summary of the tissue cell-type diversity score for FACS (c) and droplet (d).
Extended Data Figure 11.
Extended Data Figure 11.. The aging immune system (cont.)
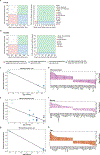
a,b, Diversity score at different cluster resolutions for FACS brain myeloid microglia cell (a) and droplet kidney macrophage (b). n = 14 mice for a and n = 16 mice for b. All data are expressed as quantiles. The p-values were obtained using a linear regression and two-sided F-test, adjusted for multiple comparison using the Benjamini-Hochberg procedure (i.e., bh-p value). c,d, Diversity score correlation with the number of genes expressed per tissue (c) or tissue cell-type (d). The red line corresponds to the linear regression curve. e, Trajectory analysis for brain myeloid microglia cell. f, Heatmap showing differential gene expression analysis of cluster 10 (mostly young macrophages) versus clusters 13 (mostly old macrophages). For the complete gene list please refer to Supplementary Table 10.
Figure 1.
Figure 1.. Overview of Tabula Muris Senis.
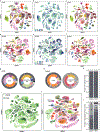
a, 23 organs from 19 male and 11 female mice were analyzed at 6 different time points. The bar plot shows the number of sequenced cells per organ prepared by FACS (n=23 organs) and microfluidic droplets (n=16 organs). For the droplet dataset the Fat sub-tissues were processed together (Fat = BAT+GAT+MAT+SCAT). BAT, Brown Adipose Tissue; GAT, Gonadal Adipose Tissue; MAT, Mesenteric Adipose Tissue; SCAT, Subcutaneous Adipose Tissue. b, Annotation workflow. Data were clustered together across all time points. We used the Tabula Muris (3m time point) as a reference for the automated pipeline and the annotations were manually curated by tissue experts. c,d, UMAP plot of all cells, colored by organ and overlaid with the Louvain cluster numbers (c) and age (d); n = 356,213 individual cells. For the color dictionaries please refer to Extended Data Figure 2c. e, B cells (top) and endothelial cells (bottom) independently annotated for each organ cluster together by unbiased whole-transcriptome Louvain clustering, irrespectively of the organ they were found.
Figure 2.
Figure 2.. Cellular changes during aging.
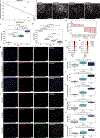
a,b, Bar plot showing the fractions of cells expressing Cdkn2a at each age group for FACS (a) and droplet (b). c,d, Bar plot of the median expression of Cdkn2a for the cells that do express the gene at each age group for FACS (c) and droplet (d). The y-axis corresponds to log-transformed and scaled values. All data are expressed as mean ± s.d. with individual data points shown. p-values were obtained using a Mann-Whitney-Wilcoxon rank-sum two-sided test. n=44,518; 34,027 and 31,551 individual cells for FACS 3m; 18m and 24m, respectively. n=25,980; 45,602; 44,645; 35,828; 37,660 and 55,674 individual cells for droplet 1m; 3m; 18m; 21m; 24m and 30m, respectively. e, Bladder cell (left) and bladder urothelial cell (right) relative abundances change significantly with age (p-value<0.05 and r2>0.7 for a hypothesis test whose null hypothesis is that the slope is zero, using two-sided Wald Test with t-distribution of the test statistic). f, Top 20 upregulated and downregulated genes in bladder computed using MAST, treating age as a continuous covariate while controlling for sex and technology. Genes were classified as significant under an FDR threshold of 0.01 and an age coefficient threshold of 0.005 (corresponding to ~10% fold change). n=970; 3,804; 2,739 and 3,864 individual cells for bladder 1m; 3m; 18m and 24m, respectively. g, Kidney capillary endothelial cell (top-left), mesangial cell (top-right), loop of Henle ascending limb epithelial cell (bottom-left) and loop of Henle thick ascending limb epithelial cell (bottom-right) relative abundances change significantly with age (p-value<0.05 and r2>0.7 for a hypothesis test whose null hypothesis is that the slope is zero, using two-sided Wald Test with t-distribution of the test statistic). h, Top 20 upregulated and downregulated genes in kidney computed using MAST, treating age as a continuous covariate while controlling for sex and technology. Genes were classified as significant under an FDR threshold of 0.01 and an age coefficient threshold of 0.005 (corresponding to ~10% fold change). n=2,488; 2,832; 3,806; 2,257; 6,384 and 5,713 individual cells for kidney 1m; 3m; 18m; 21m; 24m and 30m, respectively. i, Spleen plasma cell (left) and T cell (right) relative abundances change significantly with age (p-value<0.05 and r2>0.7 for a hypothesis test whose null hypothesis is that the slope is zero, using two-sided Wald Test with t-distribution of the test statistic). j, Top 20 upregulated and downregulated genes in spleen computed using MAST, treating age as a continuous covariate while controlling for sex and technology. Genes were classified as significant under an FDR threshold of 0.01 and an age coefficient threshold of 0.005 (corresponding to ~10% fold change). n=2,986; 8,839; 7,141; 6,395; 5,245 and 8,946 individual cells for spleen 1m; 3m; 18m; 21m; 24m and 30m, respectively. The p-values for the cell type compositional changes are shown in Supplementary Table 5.
Figure 3.
Figure 3.. Mutational burden across tissues in the aging mice.
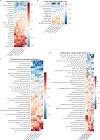
Distribution of the difference of the mean mutation in the gene set (and ERCC spike-in controls) per cell between 24m and 3m and 18m and 3m for all tissues and cells (a) and with the cell types split in five functional groups, endothelial (b), immune (c), parenchymal (d), stem/progenitor cell (e) and stromal (f). Filled and solid line distributions correspond to the mean mutation difference in gene set. White and dashed line distributions correspond to the mean mutation difference in ERCC spike-in controls. Please note that the mean mutation difference in ERCC spike-in controls overlaps for both age groups.
Figure 4.
Figure 4.. The aging immune system.
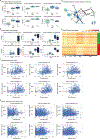
a, B-cell clonal families. The pie chart shows the proportion of singleton B cells and B cells that are part of clonal families at 3m, 18m and 24m. Please refer to Extended Data Figure 9 for the clonal networks. b, T-cell clonal families. The pie chart shows the proportion of singleton T cells and T cells that are part of clonal families at 3m, 18m and 24m. Please refer to Extended Data Figure 9 for the clonal networks. c, Diversity score for the two cell types that significantly change with age. d, UMAP plot of the brain myeloid microglial cell Leiden clusters (numbers) colored by age. Faded clusters do not change their relative age cell composition; colored clusters change their relative cell composition. e, UMAP plot of the brain myeloid microglial cells when scored using the microglia Alzheimer’s disease signature (Supplementary Table 10). n = 4,532; 4,461 and 4,424 individual microglia cells for brain myeloid 3m, 18m and 24m, respectively. f, UMAP plot of the kidney macrophage Leiden clusters (numbers) colored by age group. n = 62; 139; 264; 105; 284 and 553 individual macrophage cells for kidney 1m, 3m, 18m, 21m, 24m and 30m, respectively.

References

    1. López-Otín C, Blasco MA, Partridge L, Serrano M & Kroemer G The Hallmarks of Aging. Cell 153, 1194–1217 (2013). - PMC - PubMed
    1. Nikolich-Žugich J The twilight of immunity: emerging concepts in aging of the immune system. Nat. Immunol 19, 10–19 (2018). - PubMed
    1. Campisi J Aging, Cellular Senescence, and Cancer. Annu. Rev. Physiol 75, 685–705 (2013). - PMC - PubMed
    1. Vijg J & Suh Y Genome Instability and Aging. Physiology 75, 645–668 (2013). - PubMed
    1. Consortium TTM et al. Single-cell transcriptomics of 20 mouse organs creates a Tabula Muris. Nature 562, 367–372 (2018). - PMC - PubMed

Aditional References

    1. Picelli S et al. Smart-seq2 for sensitive full-length transcriptome profiling in single cells. Nat. Methods 10, nmeth.2639 (2013). - PubMed
    1. Darmanis S et al. A survey of human brain transcriptome diversity at the single cell level. Proc. Natl. Acad. Sci 112, 7285–7290 (2015). - PMC - PubMed
    1. Picelli S et al. Tn5 transposase and tagmentation procedures for massively scaled sequencing projects. Genome Res 24, 2033–2040 (2014). - PMC - PubMed
    1. Hennig BP et al. Large-Scale Low-Cost NGS Library Preparation Using a Robust Tn5 Purification and Tagmentation Protocol. G3 Genes Genomes Genet 8, 79–89 (2018). - PMC - PubMed
    1. Wolf FA, Angerer P & Theis FJ SCANPY: large-scale single-cell gene expression data analysis. Genome Biol 19, 15 (2018). - PMC - PubMed

Publication types