. 2020 Jul;583(7817):596-602.
doi: 10.1038/s41586-020-2499-y. Epub 2020 Jul 15.

Ageing hallmarks exhibit organ-specific temporal signatures

Collaborators, Affiliations

Ageing hallmarks exhibit organ-specific temporal signatures

Nicholas Schaum et al. Nature. 2020 Jul.

Abstract

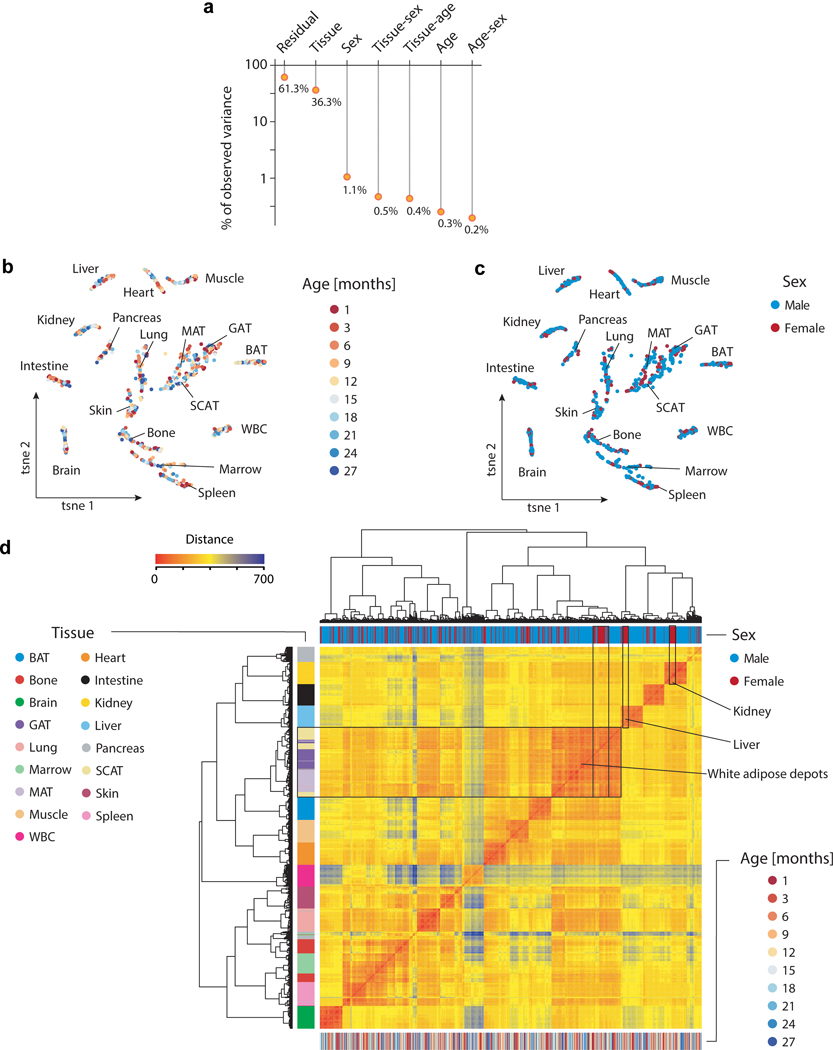
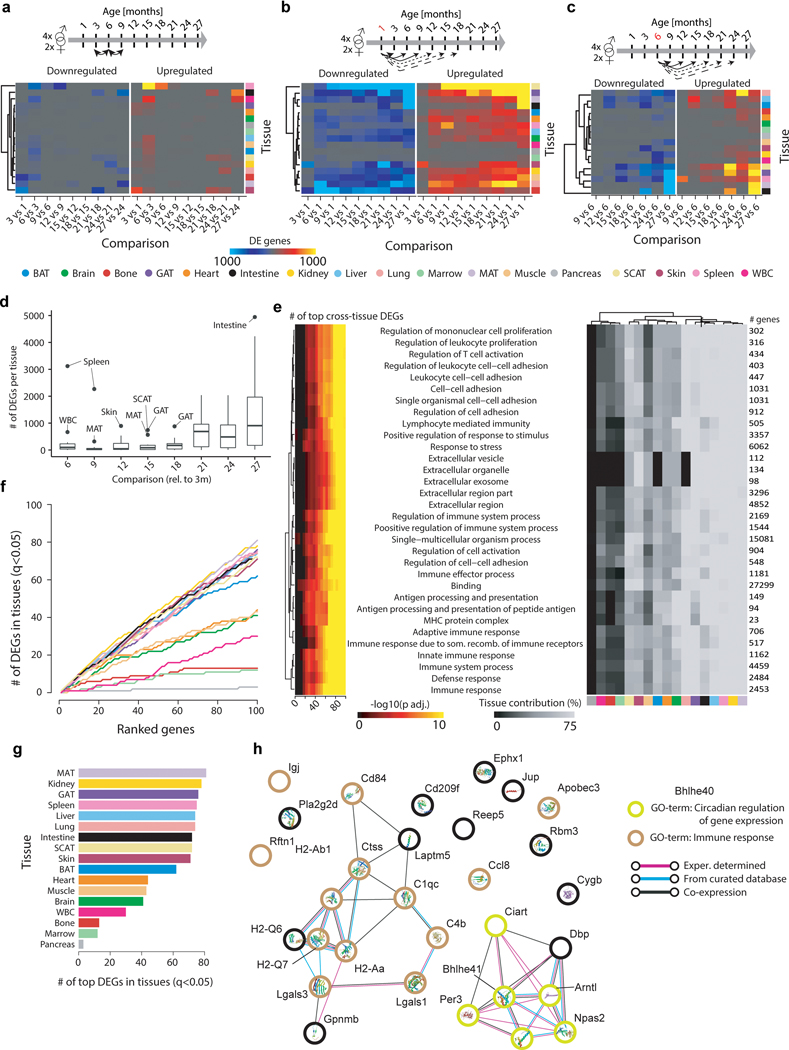
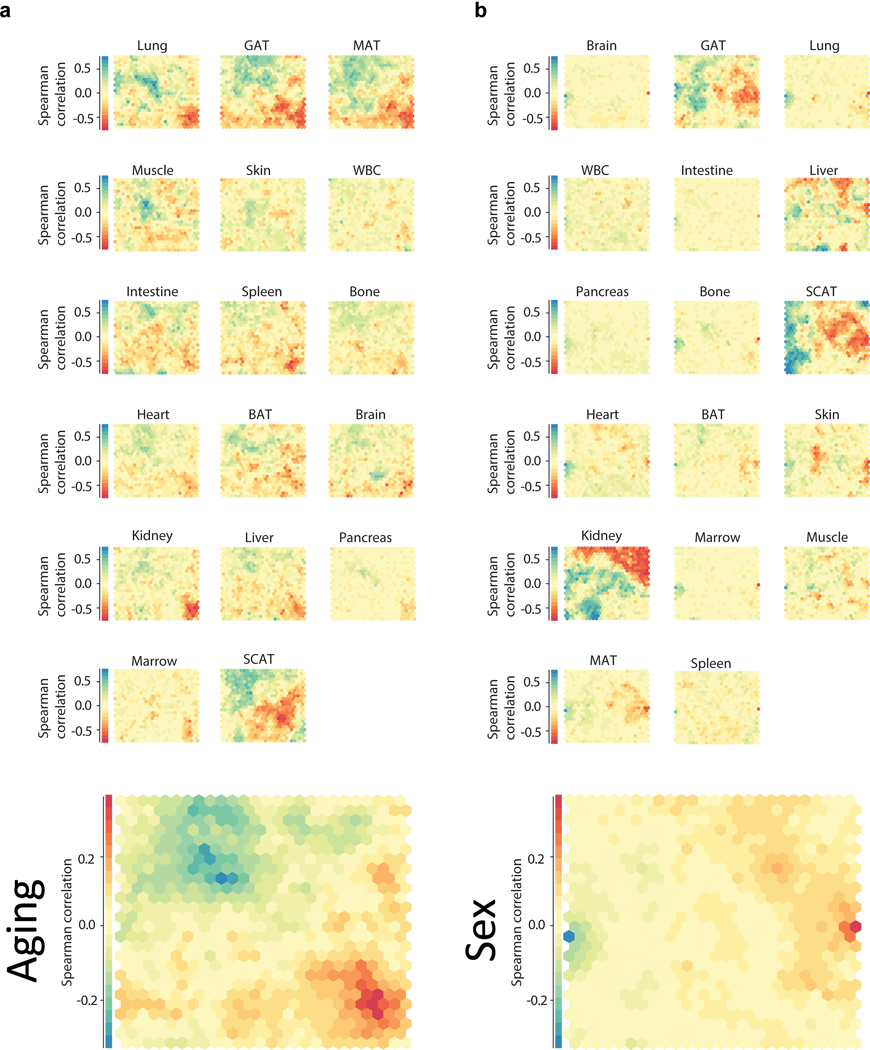
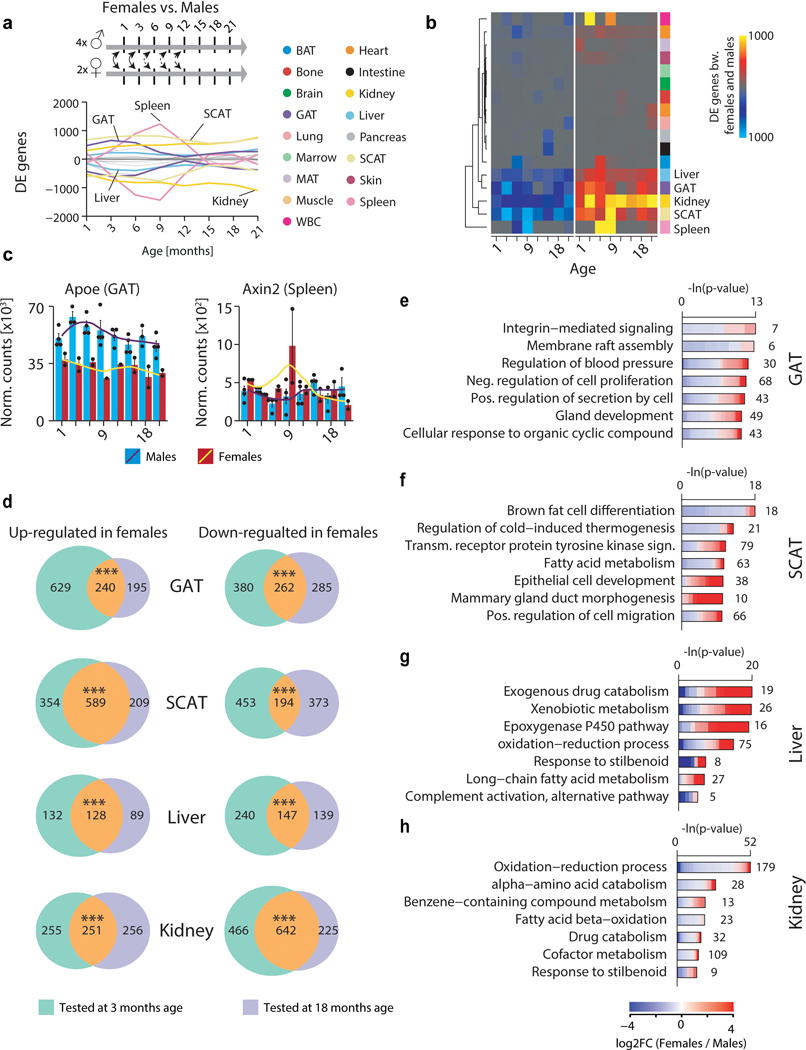
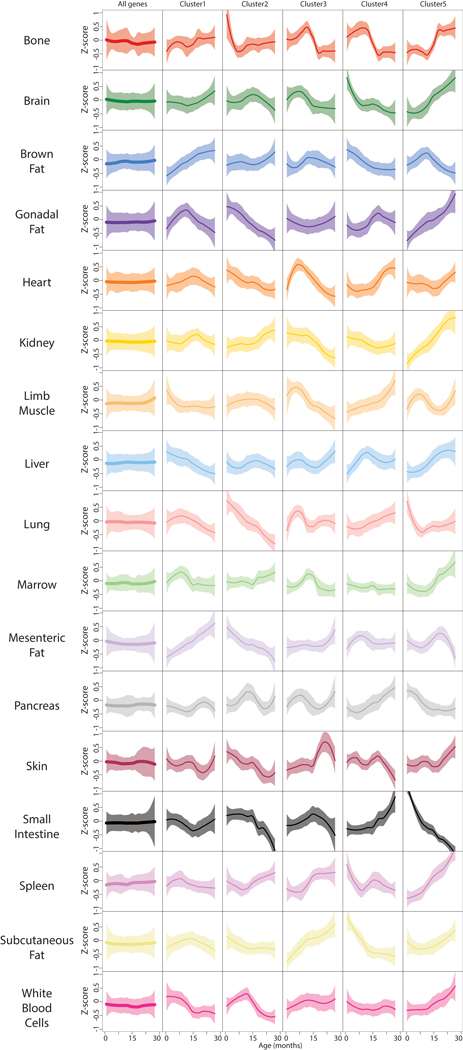
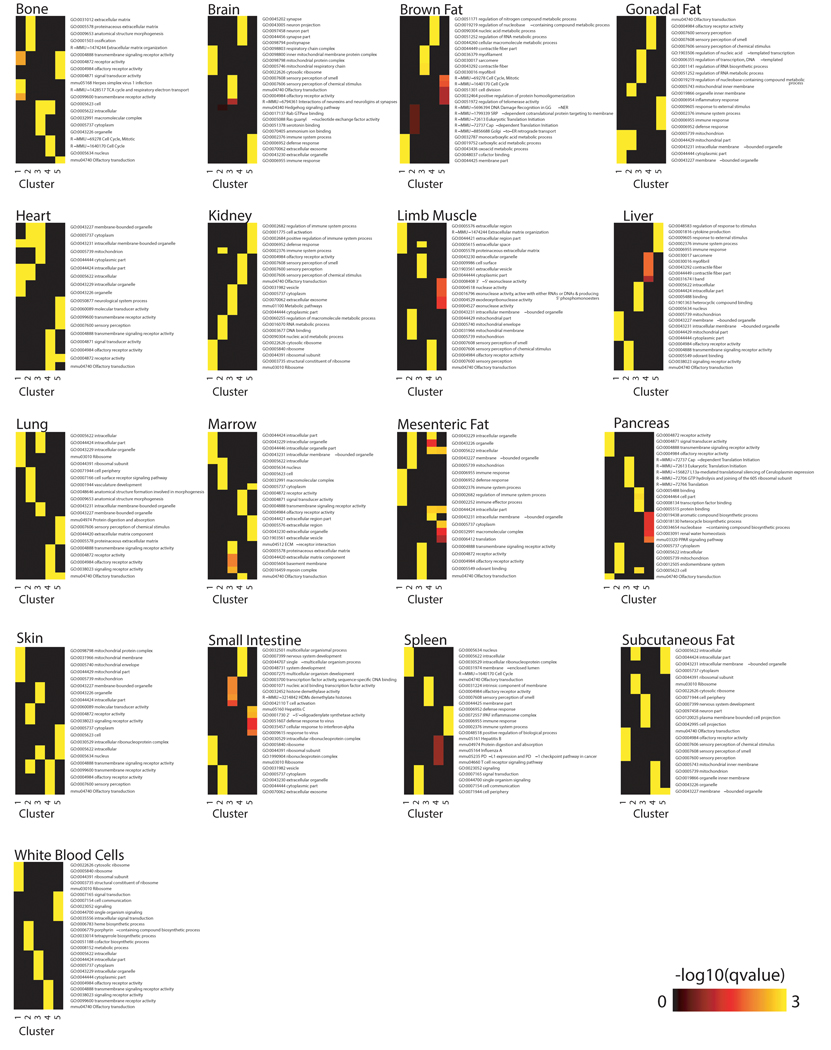
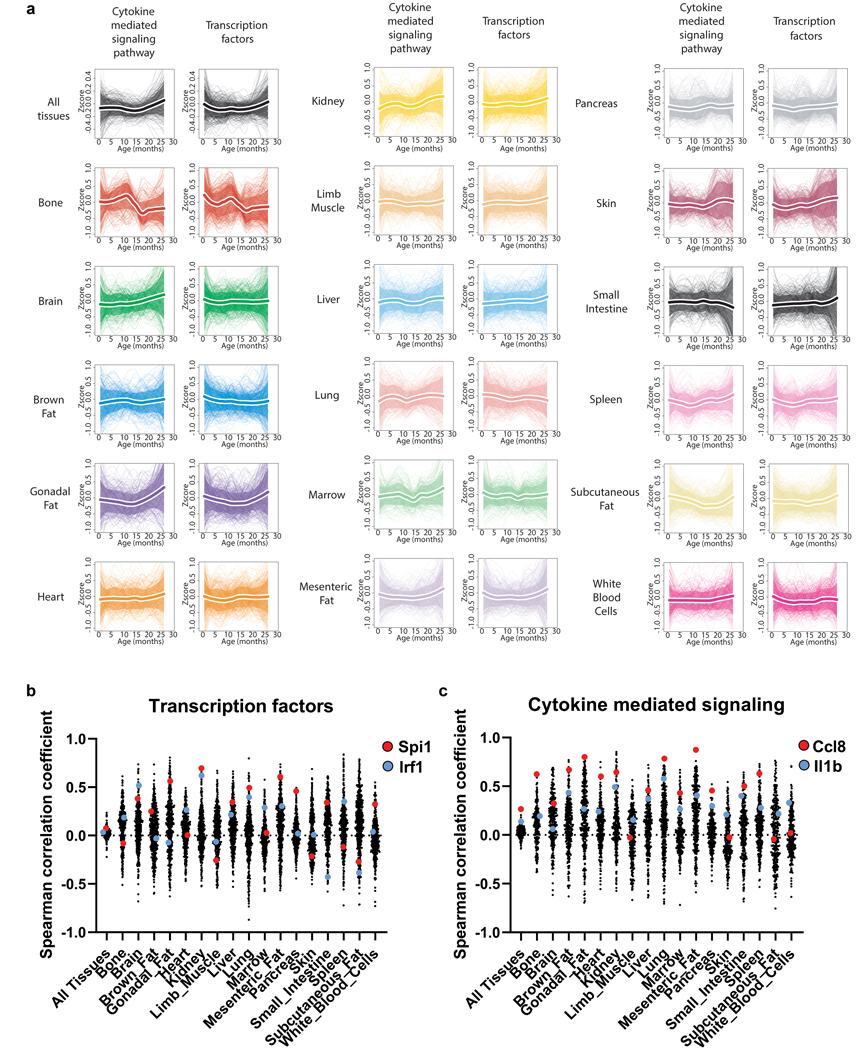
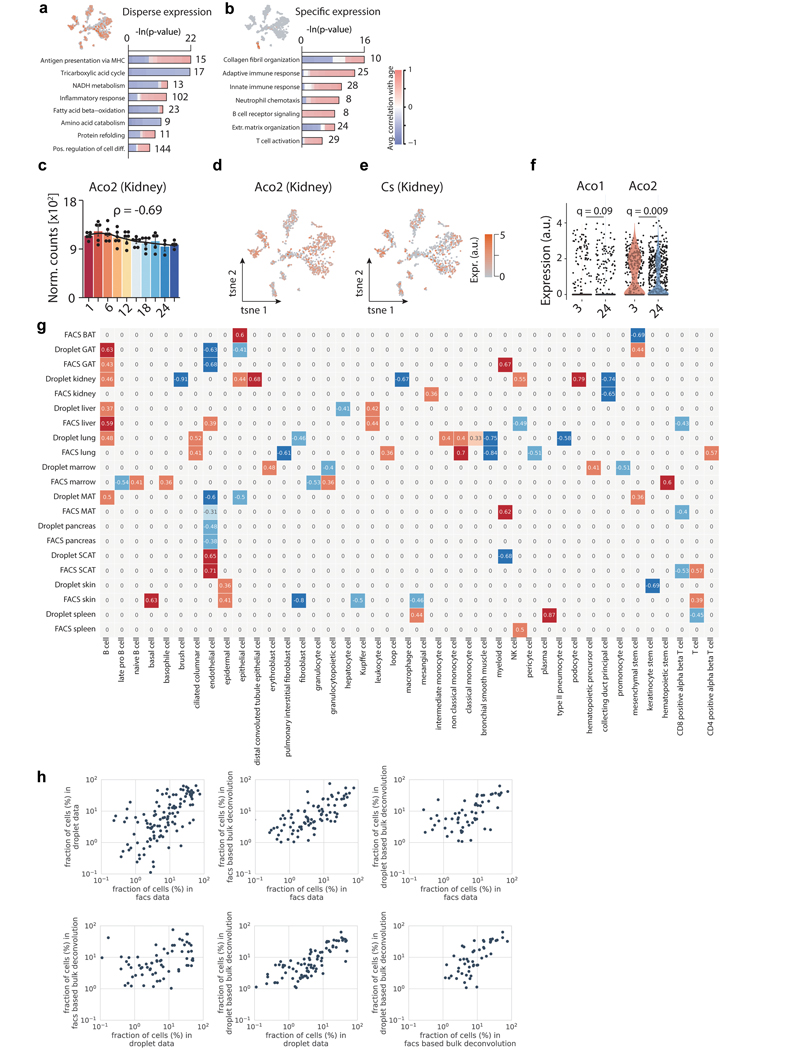
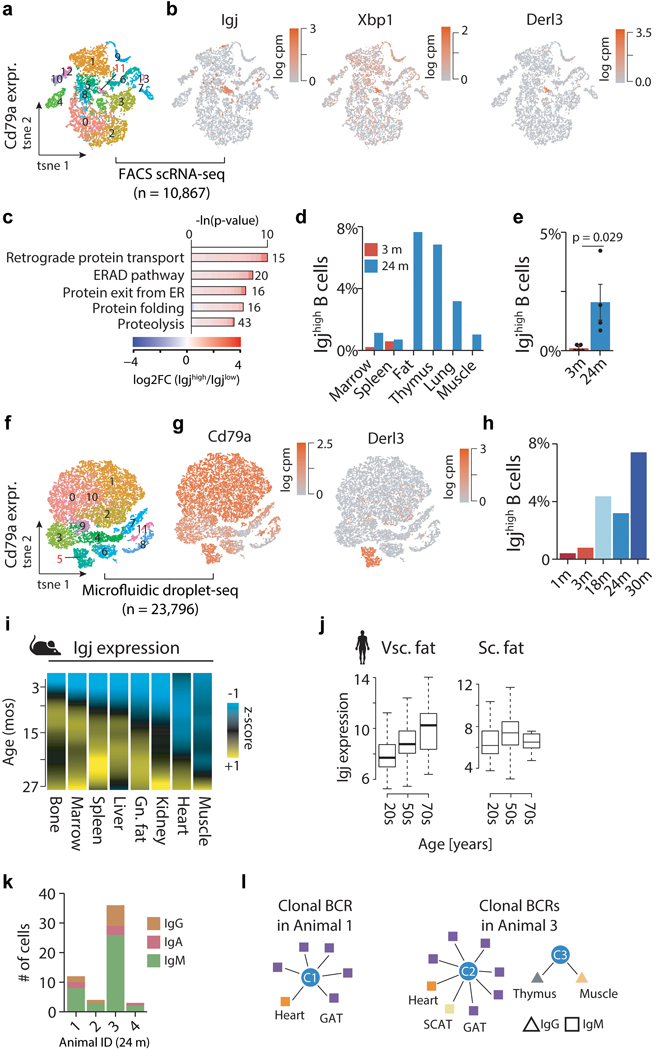
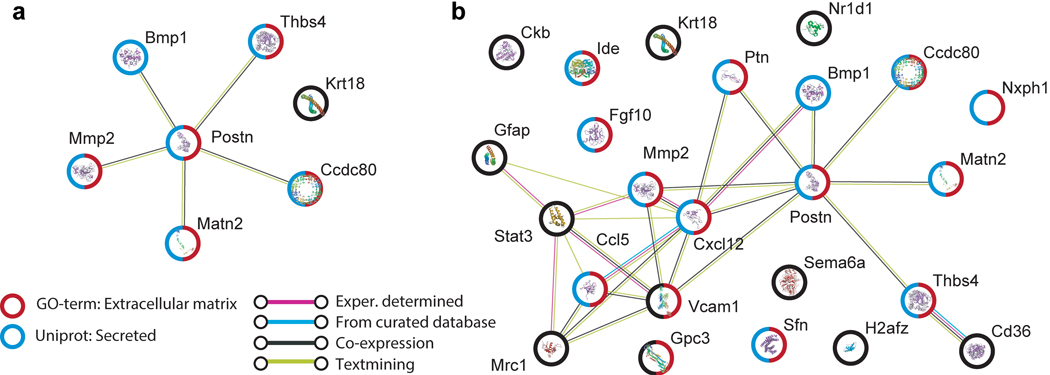
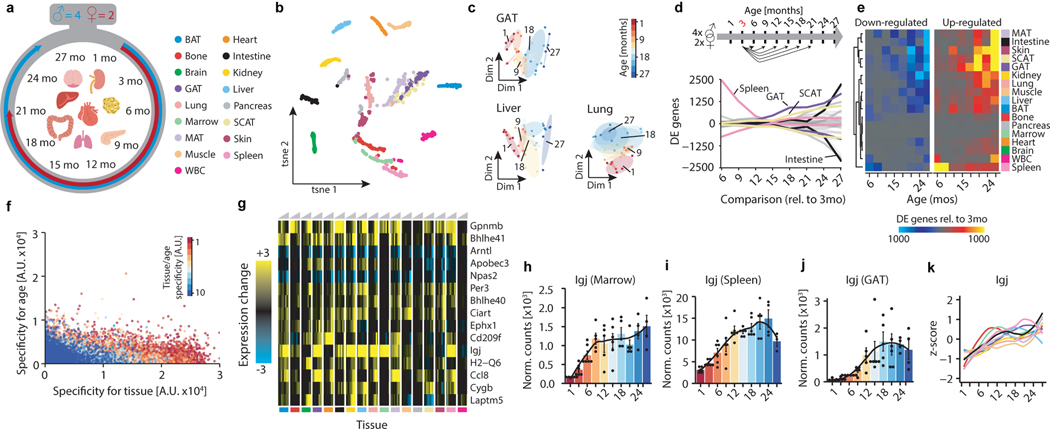
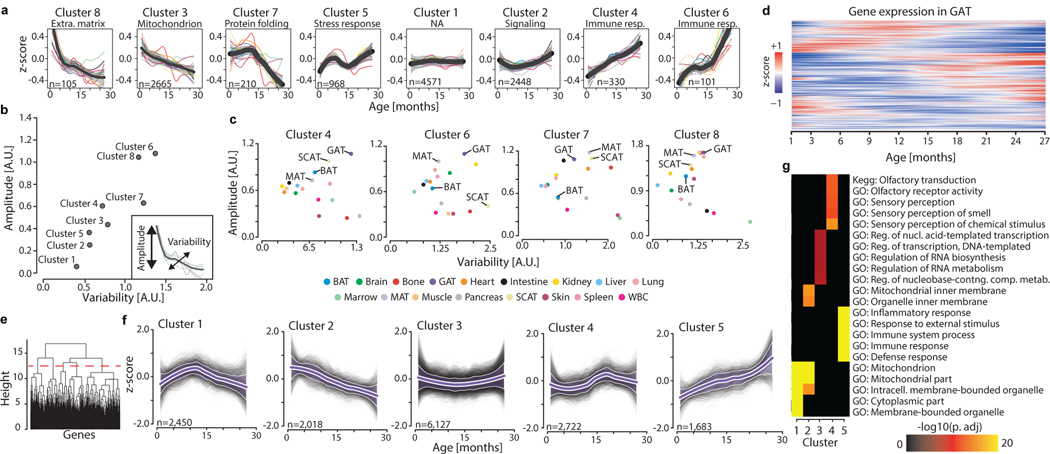
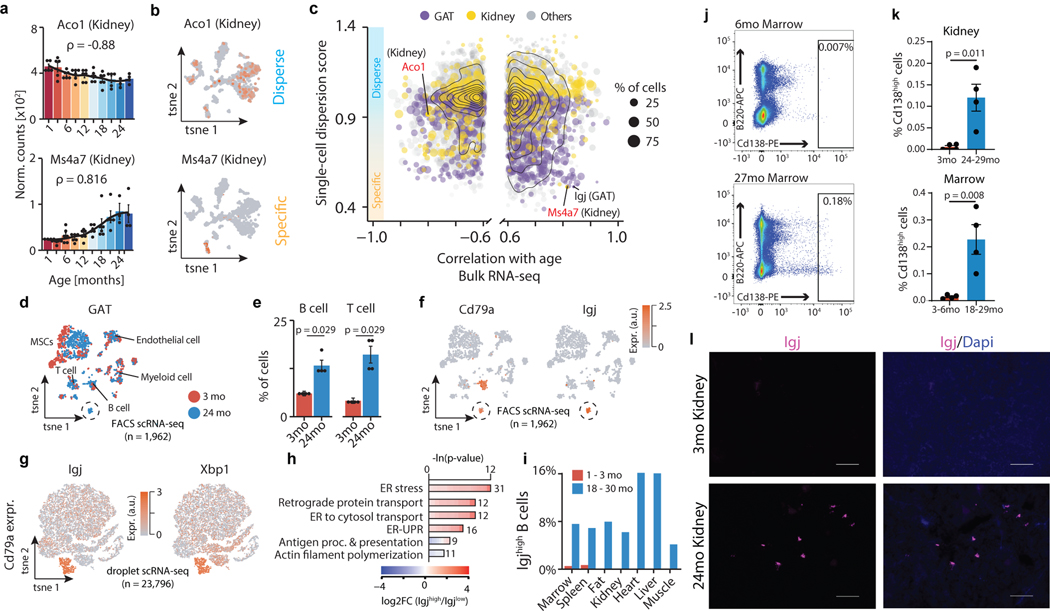
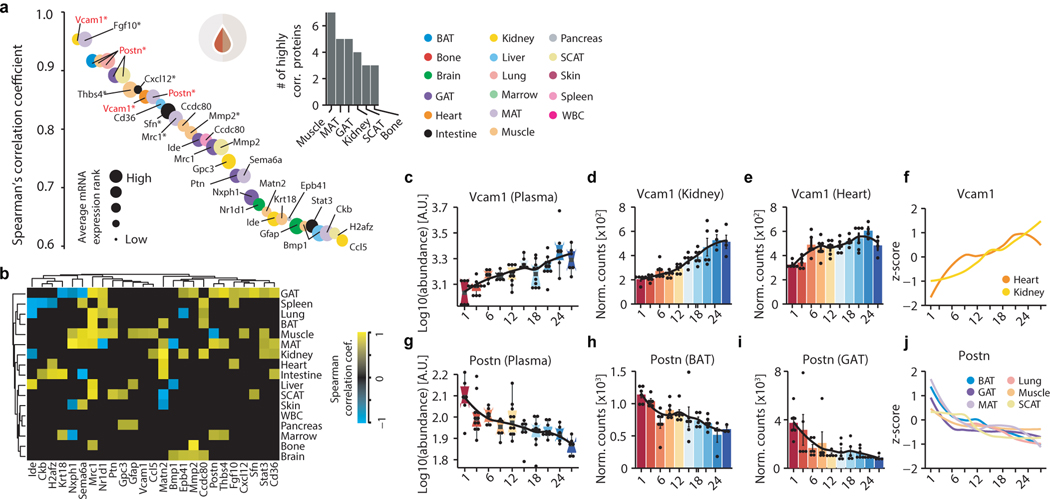
Ageing is the single greatest cause of disease and death worldwide, and understanding the associated processes could vastly improve quality of life. Although major categories of ageing damage have been identified-such as altered intercellular communication, loss of proteostasis and eroded mitochondrial function1-these deleterious processes interact with extraordinary complexity within and between organs, and a comprehensive, whole-organism analysis of ageing dynamics has been lacking. Here we performed bulk RNA sequencing of 17 organs and plasma proteomics at 10 ages across the lifespan of Mus musculus, and integrated these findings with data from the accompanying Tabula Muris Senis2-or 'Mouse Ageing Cell Atlas'-which follows on from the original Tabula Muris3. We reveal linear and nonlinear shifts in gene expression during ageing, with the associated genes clustered in consistent trajectory groups with coherent biological functions-including extracellular matrix regulation, unfolded protein binding, mitochondrial function, and inflammatory and immune response. Notably, these gene sets show similar expression across tissues, differing only in the amplitude and the age of onset of expression. Widespread activation of immune cells is especially pronounced, and is first detectable in white adipose depots during middle age. Single-cell RNA sequencing confirms the accumulation of T cells and B cells in adipose tissue-including plasma cells that express immunoglobulin J-which also accrue concurrently across diverse organs. Finally, we show how gene expression shifts in distinct tissues are highly correlated with corresponding protein levels in plasma, thus potentially contributing to the ageing of the systemic circulation. Together, these data demonstrate a similar yet asynchronous inter- and intra-organ progression of ageing, providing a foundation from which to track systemic sources of declining health at old age.


Conflict of interest statement

The authors declare no competing financial interests.

Figures

Extended Data Figure 1.
Extended Data Figure 1.. Gene expression variance analysis.
a, Visualization of the Principal Variance Component Analysis, displaying the gene expression variance explained by residuals (i.e. biological and technical noise) or experimental factors such as tissue, age, sex, and respective combinations. n=904 total samples b, c, t-SNE visualization of all samples, based on the first 6 principal components colored by age (b) and sex (c). d, Hierarchical clustering of all samples using Ward’s algorithm. Samples are annotated by tissue, sex and age. Highlighted are samples clustering by sex in selected tissues. Non-specific clustering of samples derived from white adipose tissues is further highlighted.
Extended Data Figure 2.
Extended Data Figure 2.. Validation of differential gene expression analysis.
a, Heatmap displaying the number of DEGs per tissue for pairwise analysis on adjacent time points. b, Heatmap displaying the number of DEGs per tissue for pairwise comparisons with a 1mo reference. c, Heatmap displaying the number of DEGs per tissue for pairwise comparisons with a 6mo reference. d, Boxplot (mean, 1st & 3rd quartiles) representation displaying the number of DEGs per tissue (n=17 tissues) for pairwise comparisons with a 3mo reference. Outliers show tissues undergoing exceptionally strong expression shifts at a given age. e, Enrichment for functional categories in the top100 genes differentially expressed in the most tissues (ranked using pairwise comparisons with a 3mo reference). Pathway enrichment with GO, Reactome, and KEGG databases. Enrichment was tested using Fisher’s exact test (GO) and the hypergeometric test (Reactome and KEGG). To estimate the contribution of each tissue, we used the number of genes per pathway in the top100 DEGs and estimated the percentage of significant genes per tissue. q-values estimated with Benjamini-Hochberg for each database separately, and for GO classes (molecular function, cellular component, biological process) independently. n as in (d). f, Cumulative sum of DEGs per tissue in the ranked top100 genes. g, Number of DEGs per tissue in the top100 genes. n=54 (MAT), 52 (kidney), 52 (GAT), 54 (spleen), 50 (liver), 54 (lung), 50 (intestine), 55 (SCAT), 51 (skin), 53 (BAT), 52 (heart), 52 (muscle), 53 (brain), 52 (WBC), 54 (bone), 51 (marrow), 46 (pancreas). q-values as in (e). h, STRING analysis of the top 30 genes in Figure 1g.
Extended Data Figure 3.
Extended Data Figure 3.. Self-organizing maps of gene correlation with age and sex.
Self-organizing maps (SOMs) were generated from transcriptome-wide gene expression correlation (Spearman’s rank correlation coefficient) of each gene (n=12,462 genes) with age (a) and sex (b). Genes with similar correlation are mapped to the same cell, and cells grouped by similarity. The SOM cell layout is common across organs, with the average across all organs at bottom.
Extended Data Figure 4.
Extended Data Figure 4.. Sex-specific expression changes across organs.
a, Smoothed lineplot displaying the number of DEGs between female and male animals at each age. Positive (negative) values represent up-regulated (down-regulated) genes. Grey lines: all other tissues. b, Heatmap representation of (a). c, mRNA expression of Apoe in GAT and Axin2 in spleen. Black line: LOESS regression. n=45 (GAT) and n=47 (spleen) independent samples. d, Venn diagrams depicting the overlap of DEGs between females and males detected at 3mo and 18mo of age in GAT, SCAT, liver and kidney. One-sided Fisher’s exact test. *** P<0.0001. e-h, Top 10 GO terms enriched among the DEGs between females and males at 18mo of age in GAT (e), SCAT (f), liver (g) and kidney (h). Means ± SEM. n=2 (females) & n=4 (males) independent animals for each organ. q-values estimated with Benjamini-Hochberg for each database separately, and for GO classes (molecular function, cellular component, biological process) independently.
Extended Data Figure 5.
Extended Data Figure 5.. Organs-specific gene expression dynamics.
For each of the 17 organs (rows), the average trajectory of the 15,000 most highly expressed genes is represented in the 1st column and unsupervised hierarchical clustering was used to group genes with similar trajectories (columns 2). Five clusters were used (columns 3–7) for further analysis. Average trajectory for each cluster +/− SD are represented.
Extended Data Figure 6.
Extended Data Figure 6.. Pathway enrichment analysis of organ-specific clusters.
Clusters from Extended Data Figure 5 show enrichment for genes in functional categories. Pathway enrichment was tested using GO, Reactome, and KEGG databases. Enrichment was tested using Fisher’s exact test (GO) and the hypergeometric test (Reactome and KEGG). The top 5 pathways for each cluster are shown. q-values estimated with Benjamini-Hochberg for each database separately, and for GO classes (molecular function, cellular component, biological process) independently. Sample size per cluster / tissue is indicated in Extended Data Figure 5.
Extended Data Figure 7.
Extended Data Figure 7.. Cytokine and transcription factor analysis
a, Age-related changes for inflammatory cytokine/chemokine (Cytokine mediated signaling pathways GO:0019221; n=501 genes), and transcription factors (TRANSFAC database; n=334 genes). Thicker lines surrounded by white represent the average trajectory for each cluster, +/− standard deviation. b, c, Spearman correlation coefficient for aging genes in (a).
Extended Data Figure 8.
Extended Data Figure 8.. Integration of bulk and single-cell transcriptomic data.
a, b, Representative GO terms enriched among the genes with highly disperse (a) and cell-specific (b) expression patterns. n=1,108 cells. q-values estimated with Benjamini-Hochberg for each database separately, and for GO classes (molecular function, cellular component, biological process) independently. c, Kidney Aco2 mRNA expression. Black line: LOESS regression. ρ: Spearman’s rank correlation coefficient. n=52 independent samples. Means ± SEM. d, e, t-SNE visualization of scRNA-seq data (FACS) from the kidney, colored by expression of Aco2 (d) and Cs (e) n=1,108 cells. f, Violin plot representing expression of Aco1 and Aco2 across all profiled cell types in the kidney. Points indicate cell-wise expression levels and violin indicates average distribution split by age. T-test. n=325 cells (3mo) and 783 cells (24mo). g, Spearman’s rank correlation for cell type fractions significantly (P<0.05) changing with age, based on deconvolution with FACS or droplet scRNA-seq expression signatures. n=38 (facs bat), n=37 (droplet gat), n=37 (facs gat), n=34 (droplet kidney), n=35 (facs kidney), n=35 (droplet liver), n=35 (facs liver), n=37 (droplet lung), n=37 (facs lung), n=38 (droplet marrow), n=36 (facs marrow), n=38 (droplet mat), n=39 (facs mat), n=34 (droplet pancreas), n=32 (facs pancreas), n=37 (droplet scat), n=38 (facs scat), n=35 (droplet skin), n=33 (facs skin), n=36 (droplet spleen), n=37 (facs spleen) independent samples. h, Pairwise comparisons cell fractions between scRNA-seq (FACS), scRNA-seq (droplet), FACS-based bulk RNA-seq deconvolution, and droplet-based bulk RNA-seq deconvolution. Each point represents an individual cell type in an individual tissue type.
Extended Data Figure 9.
Extended Data Figure 9.. Identifying Igjhigh B cells with FACS and droplet scRNA-seq.
a, t-SNE visualization of all Cd79a-expressing cells present in the Tabula Muris Senis FACS dataset (17 tissues). Colored clusters as identified with the Seurat software toolkit. Igjhigh B cell cluster 11 highlighted. n=10,867 cells. b, t-SNE in (a) colored by the Igjhigh B cell markers Igj, Xbp1 and Derl3. c, GO terms enriched among the top 300 marker genes of Igjhigh (n=129 cells) versus Igjlow(n=10,738 cells)(FACS). q-values estimated with Benjamini-Hochberg for each database separately, and for GO classes (molecular function, cellular component, biological process) independently. d, Distribution of Igjhigh as percentages of Cd79a expressing cells per tissue. e, Percentage of Igjhigh B cells of all Cd79a expressing cells across all tissues. n=5 (3mo) & n=4 (24mo) independent animals. T-test, means ± SEM. f, t-SNE visualization of all Cd79a-expressing cells present in the Tabula Muris Senis droplet dataset (17 tissues). Colored clusters as identified with the Seurat software toolkit. IgJhigh B cell cluster 5 highlighted. n=23,796 cells. g, t-SNE in (f) colored by the B cell marker Cd79a and Igjhigh B cell marker Derl3. h, Percentage of Igjhigh B cells of all Cd79a expressing cells across all tissues. i, Heatmap of the z-transformed Igj expression trajectories across bone (n=54), marrow (n=51), spleen (n=54), liver (n=50), GAT (n=52), kidney (n=52), heart (n=52), muscle (n=52). j, mRNA expression change of Igj in human visceral fat (20s n=25; 50s n=124; 70s n=12) and subcutaneous fat (20s n=32; 50s n=149; 70s n=13) (data from GTEx consortium). Boxplot (median, 1st and 3rd quartiles). k, Number of Igjhigh B cells with successfully assembled B cell receptor locus, split by animal and immunoglobulin class. l, Clonally amplified Igjhigh B cells as detected in animal 1 and 3, grouped by tissue of origin (color) and immunoglobulin class (shape).
Extended Data Figure 10.
Extended Data Figure 10.. STRING analysis of top correlating plasma proteins.
a, The top 7 plasma proteins correlated with gene expression in muscle, colored by pathway. b, the top 25 plasma proteins correlated with gene expression in any organ.
Figure 1.
Figure 1.. Pairwise differential expression across organs.
a, Experiment outline. 17 organ types from males 1–27mos old (n=4) and females 1–21mos old (n=2). Icons made by Freepik from www.flaticon.com. b, t-SNE visualization of all samples, based on the first 50 PCs. c, Diffusion maps of GAT, lung, and liver, colored by age. n=38 (GAT), n=37 (liver), n=38 (lung) independent samples. d, Smoothed lineplot displaying the number of DEGs for pairwise comparisons with a 3mo reference. Positive (negative) values represent up-regulated (down-regulated) genes. Grey lines represent non-labeled tissues. e, Heatmap of (d). f, Scatterplot displaying gene-wise enrichment scores for tissue, age, and tissue/age (see methods: Specificity of gene expression for tissues and ages). g, Tissue-wise expression changes with age (column-wise from left to right) for the top 15 genes exhibiting shifts in most tissues. h-j, Igj expression in marrow (h), spleen (i), and GAT (j). n=51, 54, 52 independent samples. LOESS regression indicated by black line. Means ± SEM. k, Z-transformed, smoothed gene expression trajectory of Igj, colored by tissue. n=53 (BAT), 54 (bone), 52 (GAT), 50 (intestine), 52 (kidney), 50 (liver), 54 (lung), 51 (marrow), 54 (MAT), 52 (muscle), 54 (spleen).
Figure 2.
Figure 2.. Aging gene expression dynamics across organs.
a, Whole-organism gene expression trajectory clustering. The trajectory for each gene was averaged across all 17 organs, and those average trajectories grouped into 8 clusters. The number of genes and the top functionally enriched pathway for each cluster are reported. Within each cluster, the average trajectory for each individual organ is overlaid. Cluster trajectories +/− standard deviation (n=17 tissue trajectories) are indicated in black and grey. Enrichment was tested using Fisher’s exact test (GO) and the hypergeometric test (Reactome and KEGG). Q-values estimated with Benjamini-Hochberg for each database separately, and for GO classes (molecular function, cellular component, biological process) independently. b, Identification of stable and variable clusters between organs. For each cluster in (a), an amplitude and variability index were calculated. c, The 4 clusters changing the most in (b) are represented, and adipose tissues are indicated. d, Unsupervised hierarchical clustering was used to group genes with similar trajectories in GAT (n=15,000 most highly expressed genes). e, Clustering dendrogram and cut-off used to define 5 independent clusters in GAT. f, Gene trajectories of the 5 clusters in (e) are represented in grey. Purple lines surrounded by white represent the average trajectory for each cluster, +/− standard deviation (n genes indicated for each cluster). g, The top 5 pathways for each cluster in (e). n genes as in (e), with the 15,000 most highly expressed genes as background. Enrichment and q-values as in (a).
Figure 3.
Figure 3.. Integration of bulk and single-cell transcriptomic data identifies cross-tissue infiltration of Igjhigh plasma B cells.
a, Aco1 and Ms4a7 kidney mRNA expression. LOESS regression indicated by black line. Spearman’s rank correlation coefficient ρ is indicated. Means ± SEM. b, A gene with ‘disperse’ (Aco1) and ‘specific’ (Ms4a7) single-cell expression pattern in kidney. n=1,108 cells. c, Single-cell dispersion scores (scRNA-seq) with Spearman’s rank correlation coefficient (≥ 0.6; bulk RNA-seq) for a given tissue. Color represents organ type. Dot size corresponds to % of cells per tissue expressing a given gene. d, t-SNE visualization of scRNA-seq data (FACS) from GAT, colored by age. A cluster of B cells present only in aged GAT is circled. e, GAT B and T cells as a percentage of all analyzed cells. n=4 independent animals. T-test, means ± SEM. f, Expression of B cell marker Cd79a and plasma B cell marker Igj. g, t-SNE visualization of scRNA-seq data (droplet) of all Cd79a-expressing cells present in the Tabula Muris Senis dataset (17 tissues), colored by the plasma B cell markers Igj and Xbp1. h, GO terms enriched among the top 300 marker genes of Igjhigh (n=1,198 cells) versus B cells (n=22,598 cells), with 1,886 genes passing filtering as background. q-values estimated with Benjamini-Hochberg for each database separately, and for GO classes (molecular function, cellular component, biological process) independently. i, Distribution of IgJhigh as percentages of Cd79a expressing cells per tissue. j, Representative FACS scatterplots from 2 independent experiments showing increased plasma cell abundance in aged bone marrow. Cd138, plasma cell marker. B220, B cell marker. k, FACS quantification for kidney and marrow. n=4 independent animals. T-test, means ± SEM l, Representative images from 2 independent experiments of Igj RNAscope of 3mo and 24mo kidney. Virtually no Igj signal was present in young kidneys. 100μm scale bar.
Figure 4.
Figure 4.. Plasma protein correlation with organ-specific gene expression.
a, Spearman correlation coefficient (≥ 0.6) between plasma proteins and corresponding organ-specific gene expression. * indicates q<0.05; Benjamini-Hochberg correction per tissue. Dot size corresponds to average gene expression across tissues. Top right: number of proteins correlated with gene expression in the top 6 organs. Analysis details in methods. b, Heatmap showing correlation coefficients for the top 25 plasma proteins in (a) across all organs. c, log-transformed plasma protein abundance of Vcam1. n=77 independent samples. Boxplot (mean, 1st & 3rd quartiles, min & max). d, e, Vcam1 mRNA expression in kidney (n=52) (d) and heart (n=52) (e). Black line: LOESS regression. Means ± SEM. f, Z-transformed, smoothed gene expression trajectory of Vcam1 in the kidney (n=52) and heart (n=52). g, log-transformed plasma protein abundance of Postn. n=77 independent samples. Box and whisker plots centered on mean. h, i, Postn mRNA expression in BAT (n=53) (h) and GAT (n=51). (i). Black line: LOESS regression. Means ± SEM. j, Z-transformed, smoothed gene expression trajectory of Postn in BAT (n=53), GAT (n=51), MAT (n=54), Lung (n=54), Muscle (n=52), SCAT (n=55). Means ± SEM.

References

    1. López-Otín C, Blasco MA, Partridge L, Serrano M & Kroemer G The hallmarks of aging. Cell 153, (2013). - PMC - PubMed
    1. The Tabula Muris Consortium. A single-cell transcriptomic atlas characterizes aging tissues in the mouse. BioRxiv doi: 10.1101/661728. - DOI - PMC - PubMed
    1. The Tabula Muris Consortium. Single-cell transcriptomics of 20 mouse organs creates a Tabula Muris. Nature 562, 367–372 (2018). - PMC - PubMed
    1. Palmer AK & Kirkland JL Aging and adipose tissue: potential interventions for diabetes and regenerative medicine. Exp. Gerontol. 86, 97–105 (2016). - PMC - PubMed
    1. Kohonen T The self-organizing map. Proc. IEEE 78, 1464–1480 (1990).

Publication types

MeSH terms