. 2020 Jul;583(7817):585-589.
doi: 10.1038/s41586-020-2503-6. Epub 2020 Jul 15.

Single-cell lineage tracing unveils a role for TCF15 in haematopoiesis

Affiliations

Single-cell lineage tracing unveils a role for TCF15 in haematopoiesis

Alejo E Rodriguez-Fraticelli et al. Nature. 2020 Jul.

Abstract

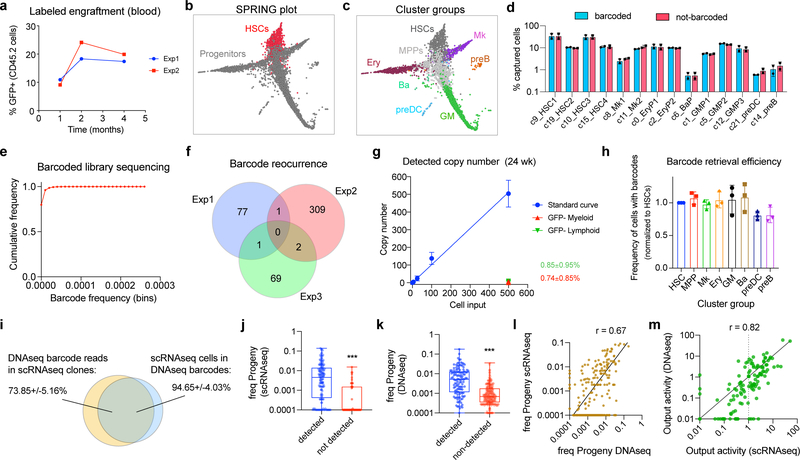
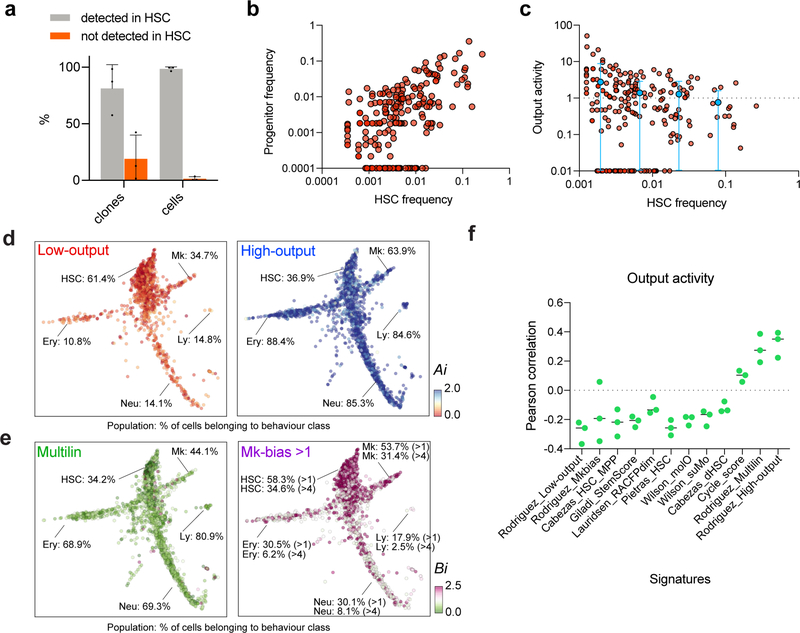
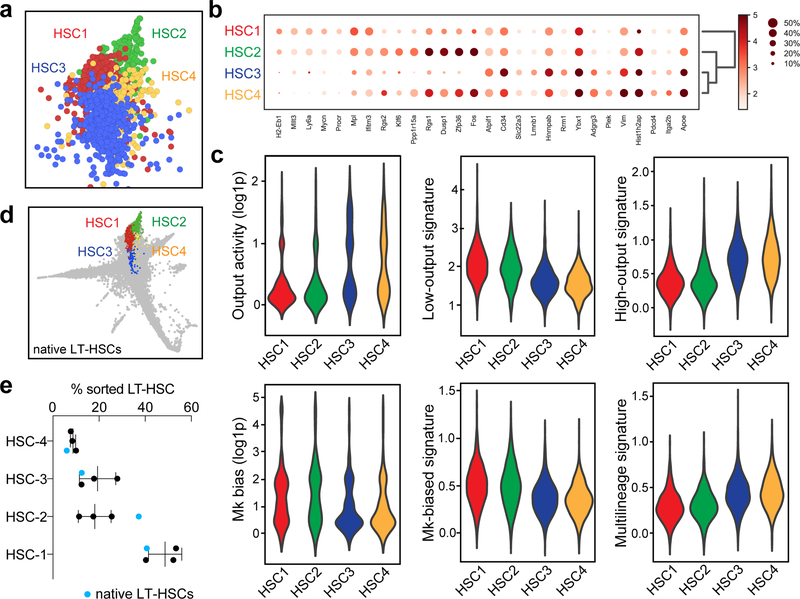
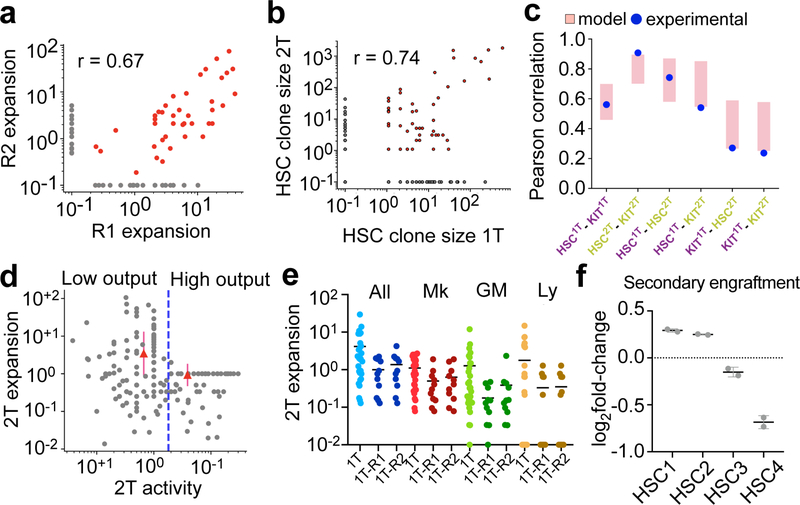
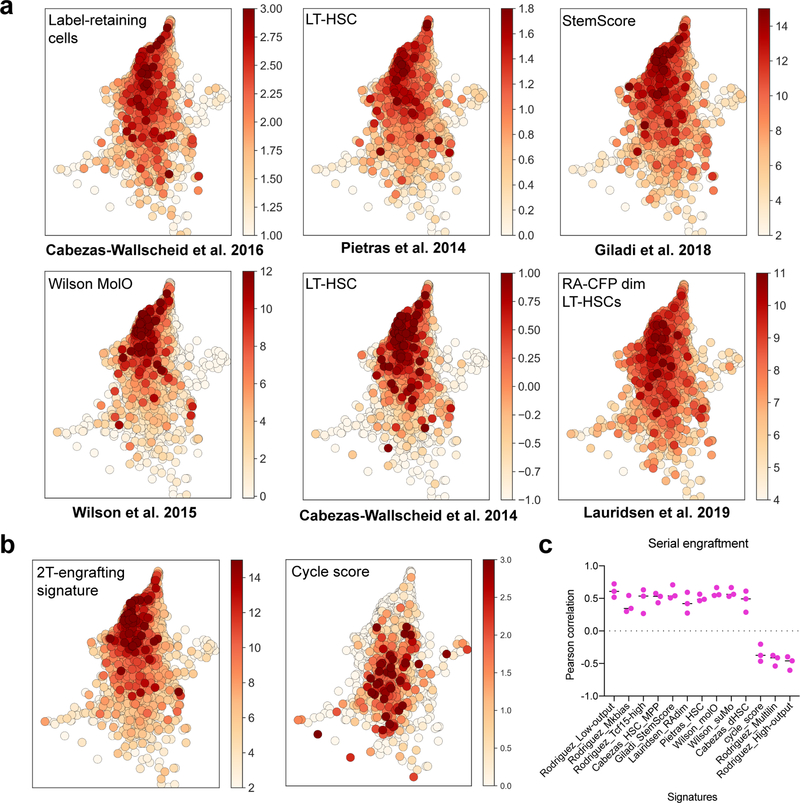
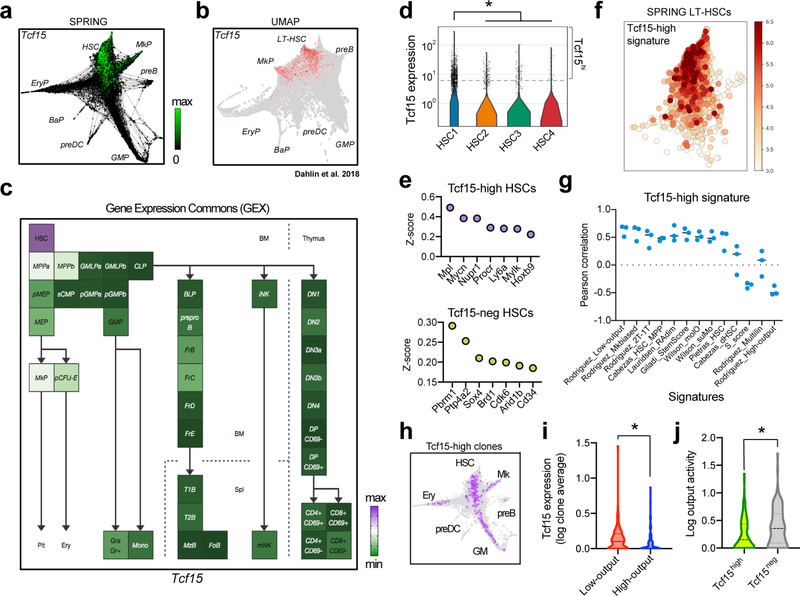
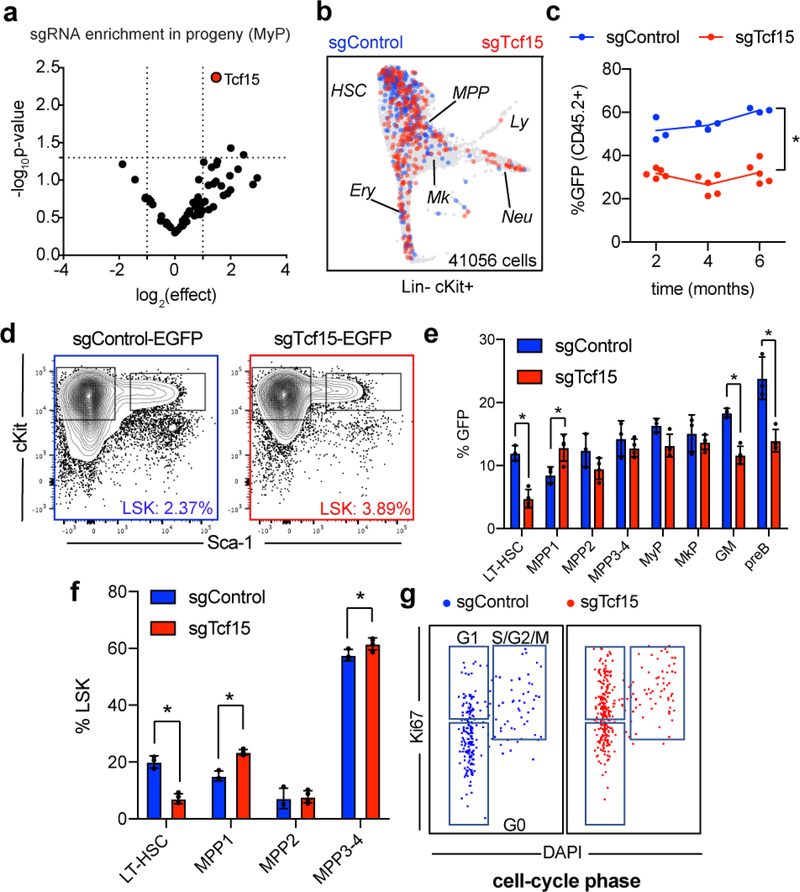
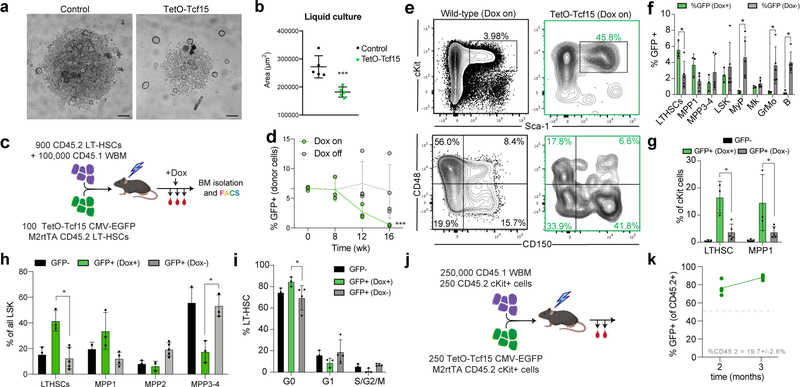
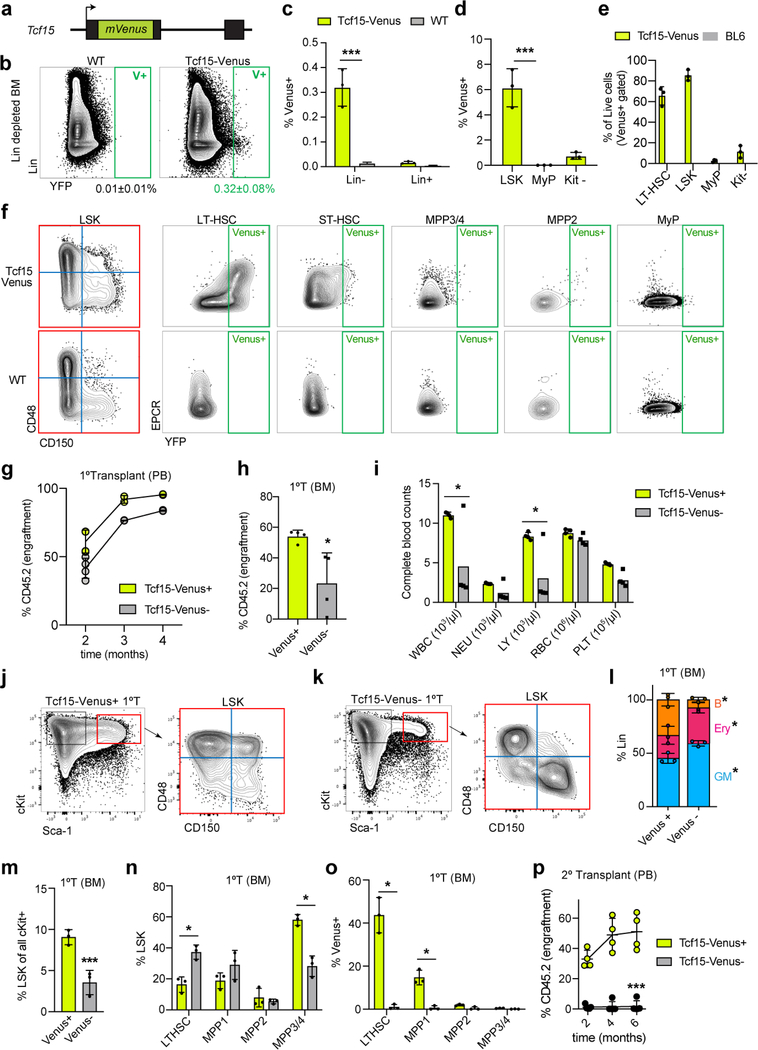
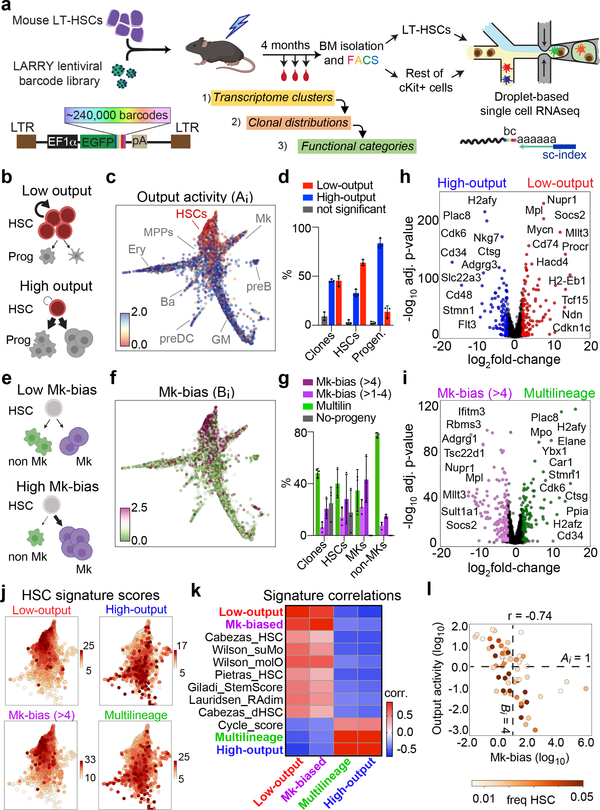
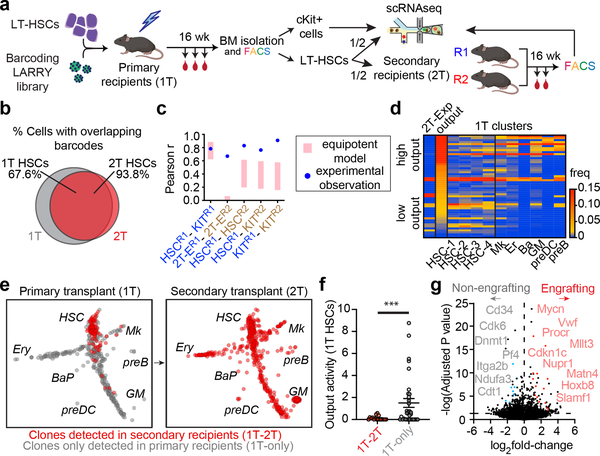
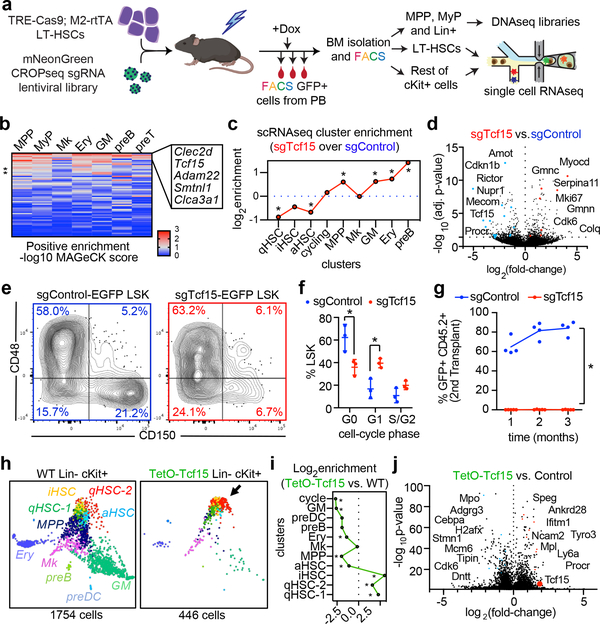
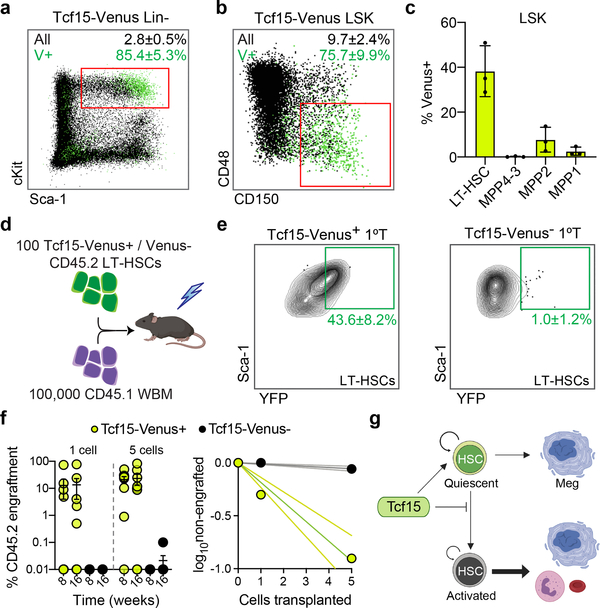
Bone marrow transplantation therapy relies on the life-long regenerative capacity of haematopoietic stem cells (HSCs)1,2. HSCs present a complex variety of regenerative behaviours at the clonal level, but the mechanisms underlying this diversity are still undetermined3-11. Recent advances in single-cell RNA sequencing have revealed transcriptional differences among HSCs, providing a possible explanation for their functional heterogeneity12-17. However, the destructive nature of sequencing assays prevents simultaneous observation of stem cell state and function. To solve this challenge, we implemented expressible lentiviral barcoding, which enabled simultaneous analysis of lineages and transcriptomes from single adult HSCs and their clonal trajectories during long-term bone marrow reconstitution. Analysis of differential gene expression between clones with distinct behaviour revealed an intrinsic molecular signature that characterizes functional long-term repopulating HSCs. Probing this signature through in vivo CRISPR screening, we found the transcription factor TCF15 to be required and sufficient to drive HSC quiescence and long-term self-renewal. In situ, Tcf15 expression labels the most primitive subset of true multipotent HSCs. In conclusion, our work elucidates clone-intrinsic molecular programmes associated with functional stem cell heterogeneity and identifies a mechanism for the maintenance of the self-renewing HSC state.


Conflict of interest statement

Competing interests

A.M.K. is a co-founder of 1cellbio, Ltd. The rest of the authors declare no competing interests.

Figures

Extended Data Figure 1.
Extended Data Figure 1.. Controls and validation of the approach.
a, Comparison of peripheral blood engraftment for barcode-expressing cells (EGFP+) in two representative experiments. b, Merged cluster labeling of the dataset, indicating the localization of HSCs (pink) and Progenitors (gray) in the single cell map plotted using SPRING. c, Merged cluster labeling, indicating the localization of Erythroid (Ery), Basophil (Ba), Dendritic cell (preDC), Granulocyte-Monocyte (GM), B-cell (preB) and Megakaryocyte (Mk) progenitors. d, Cluster distribution comparison of barcoded (blue) and non-barcoded (red) cells. Mean±S.D. % of cells assigned to each cluster (n=2 independent experiments). e, Barcode library diversity estimation, showing cumulative barcode frequency at different barcode abundances (binned). 96% of the library is represented by barcodes with a freq < 0.00001. f, Barcode library diversity estimation, showing the barcode overlap between independent experiments. Average overlap is 1.3%. g, Barcode silencing estimation, showing the % of barcodes detected in the genomic DNA of EGFP-negative cells by quantitative PCR. A calibration curve using sorted numbers of EGFP-positive cells is shown in blue. Mean±S.D. of n = 3 independent animals are shown. Lines represent linear regression from the data. h, Differences in barcode detection efficiency. The histogram represents the proportion of barcoded cells in each population as detected by scRNAseq (HSCs, MPP, Mk, GM, Ery, Ba, preDC and preB). Data shown are mean±S.D. from 3 independent experiments. The data are shown normalized by the proportion of barcoded HSCs (72.3%±5.5%). The mean efficiency drops for the preDC and preB populations, but it is not significant (paired two-sided t-tests, p=0.07, p=0.17). i, Mean ± S.D. % of shared DNAseq reads and scRNAseq cells across barcodes in progenitors (n=3 independent experiments). j, Distribution of progeny frequencies for all clones (quantified by scRNAseq), and labeled according to their presence or absence in DNAseq barcodes. Box plot shows median and interquartile range. Error bars are min/max values. *** p<0.01 two-sided t-test (ndetected=137, nnot-detected=50). k, Distribution of progeny frequencies for all barcodes (quantified by DNAseq), and labeled according to their presence or absence in scRNAseq-recovered barcodes. Box plot shows median and interquartile range. Error bars are min/max values. *** p<0.01 two-sided t-test (ndetected=127, nnot-detected=286). l, Correlation of DNAseq and RNAseq barcode frequencies (n=429). Pearson correlation (r) is shown. Line represents simple linear regression of the data. A pseudocount of 0.0001 is used for plotting clones undetected in either set. m, Correlation of DNAseq and RNAseq measurements of HSC output activity for all HSC clones (n=136). Pearson correlation (r) is shown. Line represents simple linear regression of the data. A pseudocount of 0.01 is used to plot clones with output = 0.
Extended Data Figure 2.
Extended Data Figure 2.. Description of HSC heterogeneity according to their output activity and clone size.
a, Histogram showing % of cells (right) and % of clones (left) in progenitors that are not detected in HSCs (n=3 independent experiments). Whereas some clones are not detected in HSCs (orange bar, left), these are typically single cell clones and minimally contribute to progenitor cellularity (orange bar, right). pclones = 0.022 and pcells < 0.001. Holm-Sidak multiple-test corrected t-test. b, Scatter plot showing correlation between HSC clone size, hi (expressed as fraction of total HSCs in each experiment), and clonal output activity, ki (fraction of total progenitors), for each detected clone (data is pooled from 5 mice). Pearson correlation r = 0.59 (n=226 clones, from all 3 independent experiments). A pseudocount of 0.0001 is used for progeny frequency to display the zeros (clones with no output). c, Scatter plot showing HSC clone sizes and their range of differentiated output activity. Pearson correlation r = −0.097 (slope non-significantly different than zero, p=0.1449, n=226 clones). A pseudocount of 0.01 is used for output activity to display clones for which progeny is not detected. The binned average and range are shown in blue (HSC frequency bins are [0.0001–0.005], n=127, [0.005–0.01], n=33, [0.01–0.05], n=52 [0.05–1], n=14). d, Single cell maps showing the clonal HSC output activity values for each single cell. Low-output clones are shown on the left and high-output clones are shown on the right. For each population (HSCs, Mk, Ery, Ly and Neu), the percentage of cells that belongs to clones of the indicated behavior class is shown. Scale range, 0 (red) to 2 or more (blue). Plotted single cells are randomly subsampled (n=2000) without replacement. e, Single cell maps showing the clonal HSC Mk-bias values for each single cell. Non-biased multilineage clones are shown on the left and Mk-biased (bias>1) clones are shown on the right. For each population (HSCs, Mk, Ery, Ly and Neu), the percentage of cells that belongs to clones of the indicated behavior class is shown. Scale range, 0 (green) to 2.5 or more (pink). Plotted single cells are randomly subsampled (n=2000) without replacement. f, Pearson correlation between the output activity and the average signature score of each clone, for different computed signatures as in Figure 1. Black bars indicate mean of 3 independent experiments.
Extended Data Figure 3.
Extended Data Figure 3.. Description of HSC subclusters.
a, SPRING plot showing the localization of the four reproducible HSC subclusters, HSC1–4. The plot is representative of one of three experiments with similar results. b, Marker gene expression for HSC subclusters. c, Violin plots showing the values for output activity, Mk-bias, and the scores of different HSC behaviour signatures. Violin plots show all the data (min-to-max) and are representative from one of 3 independent experiments (nHSC1=2206, nHSC2=577, nHSC3=1794, nHSC4=649). DPA results (p-values) are indicated for each HSC cluster in order from HSC1 to HSC4. Low-output: 0.0023, 0.0051, <0.0001, 0.0114. High-output: <0.0001, 0.3883, <0.0001, 0.0006. Mk-bias: 0.0002, 0.0172, 0.0516, 0.0182. Multilineage: 0.2257, 0.0763, 0.4374, 0.1977. d, SPRING plot showing distribution of native LT-HSCs (n=1) mapped by approximate nearest neighbors (see Methods). e, Cluster distribution of native LT-HSCs (blue dots) compared to transplant HSCs (black dots). Mean±S.D., n=3. Chi-square test (transplant HSCs vs. native LT-HSCs), pexp1=10−8, p exp2=0.0007, p exp3=0.0483.
Extended Data Figure 4.
Extended Data Figure 4.. Additional data for validation of the null-equipotent HSC model.
a, Scatter plot showing the Pearson correlation between expansion of HSC clones in each secondary recipient (R1 and R2, n=133 clones). b, Scatter plot showing the Pearson correlation between HSC clone size in primary and secondary recipients (n=485 clones). The gray dots are clones only detected in either primary or secondary recipients, using pseudocount of 0.1 to plot in logarithmic scale. c, Histogram depicting the values for clone size correlations between the designated populations. The experimental data is shown in blue, and the data (range) from the null equipotent model is shown in pink (1σ). d, Scatter plot of relative HSC output activity in the primary transplant (1T output) vs. clone expansion in secondary recipients (2T expansion). Clonal expansion (2T/1T clone size) is used, instead of absolute clone size, to account for the effect of 1T clone size on the estimation of engraftment capacity. To avoid numerical divergence, pseudocount = 1 is added before taking the ratio. High-output clones are top 40% clones ranked by their 1T activities, and the remaining 60% are classified as low-output clones. Red triangles show the mean±S.D. 2T expansion for each category (n=485 clones, combined from both recipients). e, Scatter plot showing relative 1T output activity across different lineages for all 1T clones and secondary engrafting clones (R1 and R2 shown separately). Bar indicates mean output value. f, Fold-change in the HSC cluster distribution showing the enrichment of secondary transplantation capacity in HSC-1/2/3/4 subclusters. Bars indicate mean±S.D. (n=2). Chi-square test p = 0.009 (observed vs. expected distribution). See data availability statement for source data of secondary transplantation assays.
Extended Data Figure 5.
Extended Data Figure 5.. Comparison of LT-HSC signatures.
a, Single cell plots of transplanted and barcoded HSCs showing the scores of previously published HSC signatures. Pietras et al. 2014 HSC signature is derived from comparison of Flt3-CD48-CD150+ LSKs (HSCs) versus all other progenitor populations. Lauridsen et al. 2019 dormant HSC (dHSC) signature is derived from comparison of RA-CFPdim HSCs, which are enriched in quiescent HSCs, versus RA-CFPpositive HSCs, which are enriched in cycling HSCs. Giladi et al. 2018 StemScore is derived from single cell data analysis of genes correlating with Hlf expression in naive HSCs. Wilson et al. 2015 MolO signature is derived from single cell expression data of index-sorted LT-HSCs. Cabezas-Wallscheid et al. 2017 label-retaining HSC signature is derived all HSC genes significantly upregulated in H2B-GFPhi label-retaining HSCs, compared to H2B-GFPlow. b, Single cell plot showing the 2T-engrafting signature score, derived from the comparison of serially repopulating HSC clones and non-serially repopulating clones (Figure 2). c, Pearson correlation between the 2T-engraftment long-term repopulating signature score and the indicated HSC signature scores. Low-output, high-output, Mk-biased and Multilineage signature scores are derived from the analyses shown in Figure 1. Black bars indicate mean of 3 independent experiments.
Extended Data Figure 6.
Extended Data Figure 6.. Tcf15 expression is restricted to HSCs, and it is highest in the low-output clones.
a, Localization of expression of Tcf15 along the single cell manifold using SPRING. Major cluster groups are labeled. The plot shows cells from one of 3 experiments with similar results (n=16976 cells). b, Localization of expression of Tcf15 along the single cell manifold in the Dahlin et al. 2018 dataset using Scanpy (n=44802 cells pooled from 6 animals). Major cluster groups are labeled. c, Localization of Tcf15 expression along the bone marrow FACS-pure populations in Gene Expression Commons. d, Expression levels of Tcf15 in the different HSC subclusters. Violin plots show all the data (min-to-max). The scale (width) of the violin plot is adjusted to show the same total area for each subcluster (nHSC1=10815, nHSC2=2265, nHSC3=2867, nHSC4=900). Tcf15 expression scale is log (normalized UMI). DPA results (p-values) testing enrichment of Tcf15hi (>5 UMI) cells across each HSC cluster are, in order, from cluster HSC1 to HSC4: <0.0001, 0.4843, <0.0001, 0.0009. * indicates enrichment in HSC1. e, Selected genes enriched in Tcf15hi HSCs and Tcf15neg HSCs. f, Single cell plot of the Tcf15hi signature score, using genes enriched in Tcf15-expressing cells (z-score > 0.3). g, Pearson correlation between the Tcf15hi signature score and the indicated HSC signature scores. Bars indicate average of n=3 independent experiments. Low-output, high-output, Mk-biased and Multilineage signature scores are derived from the analyses shown in Figure 1. h, SPRING plots showing distribution of Tcf15hi HSC clones and their progeny (purple) compared to the rest of HSCs (light gray) in primary transplants. Major cluster groups are labeled. Cells shown are from a representative experiment of 3 independent experiments with similar results (n=16976 cells). i, Violin plot showing the average distribution of Tcf15 expression levels in low-output (n=123) versus high-output (n=101) HSC clones taken from 3 independent experiments with similar results. Violin plot shows all data, with median (dashed line) and quartiles (dotted lines). *p=0.0165 (two-sided unpaired t-test). j, Violin plot showing the distribution of relative output activity in Tcf15hi (n=95) versus Tcf15neg (n=129) HSC clones. Violin plot shows all data, with median (dashed line) and quartiles (dotted lines). *p=0.0015 (two-sided unpaired t-test).
Extended Data Figure 7.
Extended Data Figure 7.. Additional measurements on Tcf15 requirement for HSC quiescence.
a, Volcano-plot showing the multiple comparison-corrected (Bonferroni) unique t-test for each gene in a representative population (LSK+CD41, Myeloid progenitors). Two-sided test, n = 6 independent mice. b, SPRING plot localization of sgControl vs. sgTcf15 cells using inDrop. Identified branches are labeled by marker gene expression. Plot is representative from one of n = 2 independent single-cell experiments (each experiment from 3 mice combined). c, Quantification of PB engraftment as %EGFP+ cells (of all CD45.2+), comparing sgControl (blue) and sgTcf15 (red) donor cells. *p=0.0017 (two-sided unpaired t-test, nsgControl=4 and nsgTcf15=5 animals). Lines indicate mean per group. d, FACS plots showing Lin- cKit-enriched BM staining for LSKs in primary recipients. Only EGFP+ cells are shown in the plots. Plots are taken from representative one animal per group from n=3 experiments. e, Quantification of bone-marrow engraftment as Mean ± S.D. %EGFP+ cells (of all BM) in each designated compartment. *significant discoveries. pLT-HSC<0.0001, pMPP1=0.0237, pMPP2=0.1427, pMPP3/4=0.5190, pMyP=0.1206, pMkP=0.5190, pGM=0.0002, ppreB<0.0001 (two-sided Holm-Sidak multiple-corrected t-test, n=3). f, Phenotype quantification as Mean ± S.D. % of donor LSKs in primary recipients corresponding to each SLAM gate (LT-HSC, MPP1, MPP2, MPP3/4). *significant p-value pLT-HSC<0.0001, pMPP1=0.0001, pMPP2=0.7152, pMPP3/4=0.0428 (two-sided Holm-Sidak multiple-corrected t-test, n=3). g, FACS scatter plots of sgControl and sgTcf15 EGFP+ LSKs, stained with DAPI and Ki-67 to evaluate cell cycle status. Plots are taken from representative one animal per group taken from 3 independent experiments.
Extended Data Figure 8.
Extended Data Figure 8.. Additional data on Tcf15 sufficiency for HSC quiescence.
a, Micrographs of liquid cultures of control TetO-Tcf15 cells. LT-HSCs (1000 cells) from M2rtTA mice were transduced with GFP-carrying lentiviral vectors expressing either a control sgRNA or TetO-Tcf15. Cells were sorted immediately into 1 μg/ml Dox-supplemented STEMspan + SCF/Flt3L/TPO and cultured for 7 days. Images are representative of 5 independent experiments with similar results. b, Quantification of liquid culture cellularity by measuring the area of the liquid colonies from 5 independent experiments. Mean ± S.D. is indicated. Control HSC cultures are shown in black, and TetO-Tcf15 HSC cultures are shown in green. *p<0.0001 (unpaired two-sided t-test). c, Experimental setup to evaluate the effect of Tcf15 overexpression. d, Quantification of TetO-Tcf15 EGFP+ cells in peripheral blood. Time-point 0 reflects the lentiviral transduction efficiency evaluated from a remainder of non-transplanted cultured HSCs. Untreated (Dox-) controls (n=5) were compared with Dox-treated (Dox+) mice (n=5). Line represents mean. Arrow indicates time point of Dox addition in the Dox-treated mice. *** Two-way ANOVA test (genotype x time-factor) p = 0.0127. e, FACS contour plots of Dox-treated TetO-Tcf15 BM cells at 16 wk. Left panels show Lin- EGFP- control cells. Right panels show Lin- EGFP+ TetO-Tcf15 cells. Plots are representative from 3 independent experiments. f, Fraction of TetO-Tcf15 EGFP+ cells in different BM populations at 16wk (nDox−=5, nDox+=3). Mean ± S.D. *two-sided unpaired t-test. P-values are pLT-HSC = 0.0144, pMyP=0.0010, pGM=0.0091, ppreB=0.0032. g, Quantification of % of all Lin- EGFP+ cells that belong to the LT-HSC or MPP1(ST-HSC) fraction (nDox−=5, nDox+=3). Mean ± S.D. *two-sided unpaired Holm-Sidak-corrected multiple comparisons t-test. P-values are pLT-HSC = 0.0062, and pMPP1 = 0.0157. h, Quantification of LT-HSC, MPP1, MPP2 and MPP3/4 as % of all donor LSK, comparing EGFP+ (treated and untreated) and EGFP- cells (nDox−=5, nDox+=3). Mean ± S.D. *two-sided unpaired Holm-Sidak-corrected multiple comparisons t-test. P-values are pLT-HSC = 0.0042, and pMPP3–4= 0.0001. i, Quantification of cell cycle phase (G0, G1, G2/M) in LT-HSCs, comparing donor EGFP+ (Dox-treated and untreated) and EGFP- cells (nDox−=5, nDox+=3). Mean ± S.D. *two-sided unpaired Holm-Sidak-corrected multiple comparisons t-test, pG0 = 0.0148, pG1 = 0.1127, pG2/S/M = 0.4815. j, Competitive secondary transplantation of cKit cells derived from Dox-supplemented TetO-Tcf15 mice. EGFP+ cKit+ cells were FACS-purified from Dox-treated primary recipients from experiment in Figure 6A. These cells were transplanted competitively against the same number of cKit cells isolated from a CD45.2+ wild-type donor (same gate), with an additional 250,000 of CD45.1 nucleated whole bone marrow cells (WBM). k, Quantification of EGFP+ CD45.2+ secondary engraftment showing higher repopulation from TetO-Tcf15 cKit+ cells (EGFP positive), which outcompete WT cKit+ cells (EGFP negative). Line represents mean (n=4 independent experiments). One-way t-test (vs. null hypothesis of 50% engraftment) p=10−202.
Extended Data Figure 9.
Extended Data Figure 9.. Additional data on Tcf15-Venus knock-in mouse model.
a, Tcf15-Venus knock-in mouse allele. The open-reading frame of monomeric Venus fluorescent protein is knocked-in replacing the start codon in the first exon of the Tcf15 locus. b, FACS plot of Tcf15-Venus knock-in mouse reporter bone marrow, stained with Lineage markers. Bone marrow from a wild-type BL/6J mouse is used as a negative control. The YFP channel was used to detect expression of Venus fluorescent protein. Plots are representative of 3 independent experiments with similar results. c, Quantification of %Venus+ cells in Lin- vs. Lin+ bone marrow, comparing Tcf15-Venus reporter and negative control mice (n=3). Mean ± S.D. ***Holm-Sidak-corrected multiple comparison two-sided t-test p=0.0243. d, Quantification of %Venus+ cells in Lin-Sca1+cKit+ (LSK), Lin-Sca1-cKit+ (MyP) and Lin-Sca1-cKit- (Kit-). Mean ± S.D. ***unpaired two-sided t-test, p=0.0021 (n=3). e, Quantification of distribution of Lin Venus+ cells from Tcf15-Venus knock-in reporter bone marrow (measured as % Live Lin). BL/6J bone marrow cells are shown for comparison, as negative controls. Mean ± S.D. (n=3). f, FACS plot of Tcf15-Venus knock-in reporter LSK cells, stained for LSK SLAM markers to show YFP (Venus) expression in different SLAM compartments. BL/6J bone marrow LSK cells are used as a negative control. Plots shown are representative of 3 independent experiments with similar results. g, Donor engraftment in primary competitive transplantation, measured as % of PB CD45.2+ leukocytes. Bars indicate mean ± S.D. (n=4). h, Engraftment in BM, measured as total CD45.2+ cells at 3–4 months post transplantation. Mean ± S.D. (n=4). *Holm-Sidak-corrected multiple comparison unpaired two-sided t-test, p=0.0223. i, Automated peripheral blood counts of mice reconstituted with Venus+ or Venus- HSCs. The scale is shared for all measurements, but the units are indicated for each population after the labels. *Holm-Sidak-corrected multiple comparison two-sided t-test pWBC=0.0006, pLY=0.0056. j, FACS plots showing bone marrow Lin analysis of primary recipients transplanted with Venus+ HSCs. Left panels show cKit vs. Sca1 staining of all cKit+ cells. Right panel shows SLAM (CD48, CD150) staining of LSK cells. Plots shown are representative of 3 independent experiments with similar results. k, FACS plots showing bone marrow Lin analysis of primary recipients transplanted with Venus HSCs. Left panels show cKit vs. Sca1 staining of all cKit+ cells. Right panel shows SLAM (CD48, CD150) staining of LSK cells. Plots shown are representative of 3 independent experiments with similar results. l, Quantification of % of BM Myeloid (GM, Gr-1+), Lymphoid (B, CD19+) and Erythroid (Ery, Ter119+) cells from Venus+ vs. Venus primary recipients. Mean ± S.D. (n=3). *Holm-Sidak corrected multiple comparison two-sided t-test. pB=0.0002, pEry=0.0166, pGM=0.0125. m, Quantification of FACS gate in (J, left panels) showing % of all cKit cells that are LSK. Mean ± S.D. (n=3). ***unpaired two-sided t-test. pB=0.0054. n, Quantification of % of donor-derived LSK cells belonging to each SLAM population. Mean ± S.D. (n=3). *Holm-Sidak corrected multiple comparison two-sided t-test. pLT-HSC=0.0010, pMPP1=0.0806, pMPP2=0.6026, pMPP3–4<0.0001. o, Quantification of % Venus+ cells in each CD45.2+ LSK SLAM subpopulation, comparing recipients transplanted with 100 Venus+ vs. Venus HSCs. Mean ± S.D. (n=3). *Holm-Sidak corrected multiple comparison two-sided t-test. pLT-HSC<0.0001, pMPP1=0.0002, pMPP2=0.8157, pMPP3–4=0.8820. p, Donor engraftment in secondary competitive transplantation, measured as % of PB CD45.2+ granulocytes. Mean ± S.D. (nVenus+=4, nVenus−=5). Line connects the means at each time point. ***paired two-sided t-test p<0.0001.
Figure 1.
Figure 1.. Simultaneous single cell lineage and transcriptome sequencing maps functional HSC heterogeneity.
a, Experimental design for studying HSC heterogeneity with the Lineage and RNA RecoverY (LARRY) lentiviral barcoding library. All panels are representative from n = 3 independent labeling experiments (5 mice). b, Schemes of low-output (top) and high-output (bottom) HSC clones. c, Single cell map showing clonal HSC output activity values. Major cell populations are labeled. d, Distribution of high-output (output activity >1) and low-output (output activity <1) HSC cells and clones (shown as % of total HSCs). Mean ± S.D. e, Schemes of lineage balanced (top) and biased (bottom) HSC clones. f, Single cell map showing clonal Mk-bias values. g, Distribution of Mk-biased and Multilineage HSCs (cells and clones), Mk cells and non-Mk cells (shown as % of total). Mean ± S.D. h, Genes differentially expressed in low-output (right, n = 7254 cells) versus high-output (left, n = 3512 cells) HSCs. Genes with adjusted p-value<0.01 (Benjamini-Hochberg-corrected t-test) and fold-change>2 are colored. Selected genes are labeled. i, Genes differentially expressed in Mk-biased (right, n = 3399 cells) versus Multilineage (left, n = 3771 cells) HSCs. Genes with adjusted p-value<0.01 (Benjamini-Hochberg-corrected t-test) and fold-change>2 are colored. j, Single cell map of HSCs, colored by signature score values. k, Heatmap showing the Pearson correlation between different signature scores across all HSCs (n = 10837). l, Scatter plot of Mk-bias and output activity (log-transformed) for each HSC clone, colored by clone HSC frequency. Dotted lines are the output activity threshold (Ai = 1), and the Mk-bias threshold (Bi = 4). Only clones with HSC frequency > 0.005 are depicted (n = 62).
Figure 2.
Figure 2.. A clonal molecular signature of serial repopulation capacity.
a, Experimental design for secondary transplantation experiment. b, Venn diagram showing the clonal overlap between of 1T HSCs (% cells) and 2T HSCs. c, Histogram of pearson correlations between secondary recipient clone measurements (see Supplementary methods). Pink bars show the correlation distribution of the equipotent HSC null model (1 S.D. over 104 calculations). Blue circles represent the observed experimental data. d, Heatmap showing the clonal frequency in 2T and in 1T clusters. The clones are ordered from top to bottom by 1T output activity (scale normalized to plot with the same scale). Only clones represented in at least 5 1T-HSCs are shown. e, SPRING plot of clones in 1T (left), and clones in 2T (right), randomly subsampled for visualization (representative from n = 2 animals). Clones are colored red if they are also detected in 2T (1T-2T clones), and in gray if they are not detected in 2T (1T-only). Populations are labeled. f, Scatter plot showing the output activity (Ai) of 1T-HSC clones comparing 2T-engrafting (red, n = 17) versus non-engrafting (gray, n = 33) clones. Lines represent mean ± S.E.M. *** p = 0.0098 in Kolmogorov-Smirnov (2-sided) test. g, Volcano plot of differential expression analysis of secondary engrafting (n = 773) vs. non-engrafting (n = 591) HSCs. Benjamini-Hochberg-corrected t-test p-values are shown.
Figure 3.
Figure 3.. In vivo CRISPR screening identifies regulators of HSC output.
a, Experimental design for the steady state CRISPR screening. b, Heatmap showing positive enrichment score for each targeted gene (rows), in each BM compartment (columns). The top 5 genes are labeled. c, Single-cell cluster enrichment of sgTcf15 (log2fold over sgControl). *p<0.1 by differential proportion analysis (DPA) test (nsgTcf15=298, nsgControl=437). For DPA, see methods. d, Volcano plot showing differentially expressed genes comparing sgTcf15 (n=220) vs. sgControl (n=269) HSCs from the scRNAseq experiments. Benjamini-Hochberg-corrected t-test p-values are shown. e, FACS plots showing BM LSK staining for SLAM staining of donor-derived sgControl and sgTcf15 EGFP+ cells. Plots are representative from n=4 independent experiments. f, Quantification of cell cycle status of EGFP+ LSKs. Mean ± S.D. *p<0.005 (n=3, Holm-Sidak-corrected two-sided t-test). g, Quantification of donor engraftment (%EGFP+ of all PB cells) in secondary transplantation. *p<0.005 (n=4, Holm-Sidak-corrected two-sided t-test). h, SPRING single-cell RNAseq map of one representative experiment comparing wild-type (left) vs. Tcf15 overexpressing cKit enriched cells (right). i, Cluster enrichment of TetO-Tcf15 represented as log2fold-enrichment over control. *p<0.1 DPA test (nTetO-Tcf15=440, ncontrol=1752). j, Volcano plot showing differential gene expression of TetO-Tcf15 (n=446) vs. control cKit+ (n=1754) cells. Benjamini-Hochberg-corrected t-test p-values are shown.
Figure 4.
Figure 4.. Tcf15 expression defines the functional LT-HSCs.
a, FACS plot of Tcf15-Venus knock-in reporter Lin cells. Mean±S.D. % of LSKs (red square) of all Lin- (Venus+ vs. all cells) is shown. Plots in (a), (b) and (e) in are representative from n=3 independent experiments with similar results. b, FACS plot of Tcf15-Venus knock-in reporter LSK Venus+ cells stained for SLAM markers. Mean±S.D. % of LT-HSCs (red square) within LSK (Venus+ vs. all cells) is shown. c, Mean±S.D. percentage of Tcf15-Venus expression within each LSK SLAM compartment (n=3). d, Primary competitive transplantation of HSCs derived from Tcf15-Venus reporter (CD45.2) mice. e, FACS plots showing YFP (Venus) vs. Sca-1 intensity of donor-derived LT-HSCs from mice transplanted with 100 Venus+ (left) or Venus (right) HSCs. Mean±S.D. % of Venus+ LT-HSCs is shown. f, Comparison of transplantation efficiency of single or 5 HSCs (Tcf15-Venus+ or Venus-). Left, mean±S.D. % myeloid CD45.2+ engraftment in recipients (n=8 mice per category). Right, limiting dilution quantification. g, Model. Tcf15 is expressed in a subset of low-output self-renewing HSCs. Upon injury or transplantation, only a subset of these HSCs maintains Tcf15 levels, and restores the reservoir pool of relatively quiescent HSCs (some of which can still produce Meg-lineage cells).

References

References (main-text)

    1. Haas S, Trumpp A & Milsom MD Causes and Consequences of Hematopoietic Stem Cell Heterogeneity. Cell Stem Cell 22, 627–638 (2018). - PubMed
    1. Laurenti E & Göttgens B From haematopoietic stem cells to complex differentiation landscapes. Nature 553, 418–426 (2018). - PMC - PubMed
    1. Naik SH et al. Diverse and heritable lineage imprinting of early haematopoietic progenitors. Nature 496, 229–232 (2013). - PubMed
    1. Dykstra B et al. Long-term propagation of distinct hematopoietic differentiation programs in vivo. Cell Stem Cell 1, 218–229 (2007). - PubMed
    1. Sun J et al. Clonal dynamics of native haematopoiesis. Nature vol. 514 322–327 (2014). - PMC - PubMed

References (methods section)

    1. Zilionis R et al. Single-cell barcoding and sequencing using droplet microfluidics. Nat. Protoc 12, 44–73 (2017). - PubMed
    1. Wolf FA, Angerer P & Theis FJ SCANPY: large-scale single-cell gene expression data analysis. Genome Biol. 19, 15 (2018). - PMC - PubMed
    1. Weinreb C, Wolock S & Klein AM SPRING: a kinetic interface for visualizing high dimensional single-cell expression data. Bioinformatics 34, 1246–1248 (2018). - PMC - PubMed
    1. Wolock SL, Lopez R & Klein AM Scrublet: Computational Identification of Cell Doublets in Single-Cell Transcriptomic Data. Cell Syst 8, 281–291.e9 (2019). - PMC - PubMed
    1. Luecken MD & Theis FJ Current best practices in single-cell RNA-seq analysis: a tutorial. Molecular Systems Biology vol. 15 (2019). - PMC - PubMed

Publication types

Substances

LinkOut - more resources