. 2020 Jun 24:11:943.
doi: 10.3389/fphar.2020.00943. eCollection 2020.

Inhibition of Plasminogen Activator Inhibitor-1 Activation Suppresses High Fat Diet-Induced Weight Gain via Alleviation of Hypothalamic Leptin Resistance

Affiliations

Inhibition of Plasminogen Activator Inhibitor-1 Activation Suppresses High Fat Diet-Induced Weight Gain via Alleviation of Hypothalamic Leptin Resistance

Shinichiro Hosaka et al. Front Pharmacol. .

Abstract

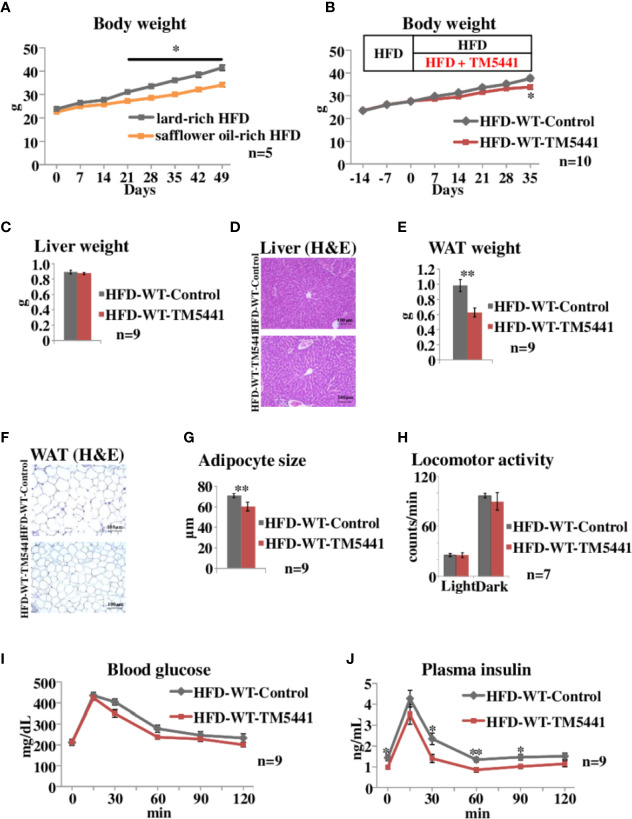
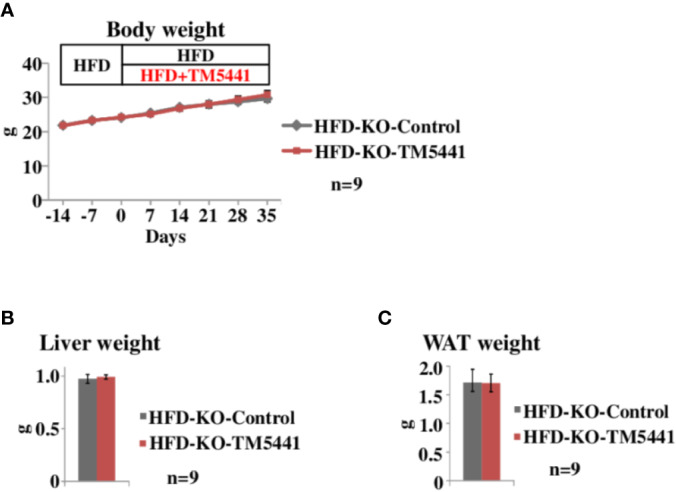
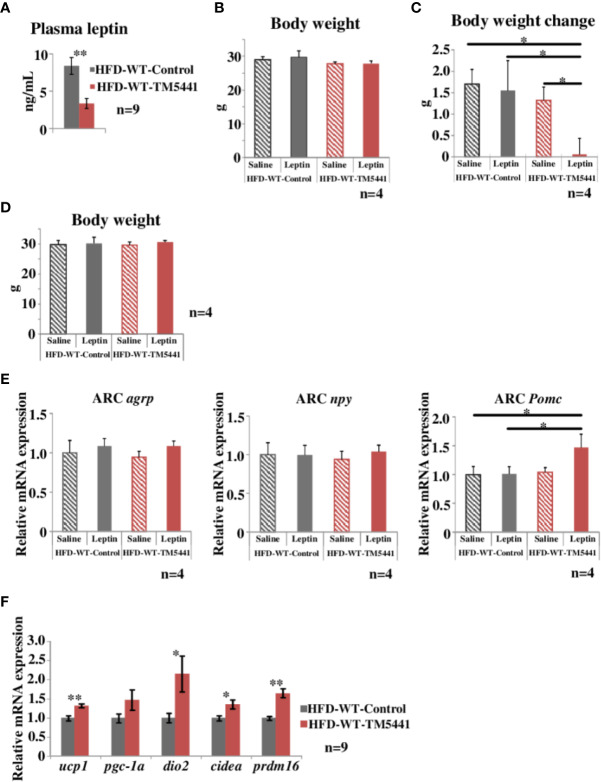
Leptin resistance is an important mechanism underlying the development and maintenance of obesity and is thus regarded as a promising target of obesity treatment. Plasminogen activator inhibitor 1 (PAI-1), a physiological inhibitor of tissue-type and urokinase-type plasminogen activators, is produced at high levels in adipose tissue, especially in states of obesity, and is considered to primarily be involved in thrombosis. PAI-1 may also have roles in inter-organ tissue communications regulating body weight, because PAI-1 knockout mice reportedly exhibit resistance to high fat diet (HFD)-induced obesity. However, the role of PAI-1 in body weight regulation and the underlying mechanisms have not been fully elucidated. We herein studied how PAI-1 affects systemic energy metabolism. We examined body weight and food intake of PAI-1 knockout mice fed normal chow or HFD. We also examined the effects of pharmacological inhibition of PAI-1 activity by a small molecular weight compound, TM5441, on body weight, leptin sensitivities, and expressions of thermogenesis-related genes in brown adipose tissue (BAT) of HFD-fed wild type (WT) mice. Neither body weight gain nor food intake was reduced in PAI-1 KO mice under chow fed conditions. On the other hand, under HFD feeding conditions, food intake was decreased in PAI-1 KO as compared with WT mice (HFD-WT mice 3.98 ± 0.08 g/day vs HFD-KO mice 3.73 ± 0.07 g/day, P = 0.021), leading to an eventual significant suppression of weight gain (HFD-WT mice 40.3 ± 1.68 g vs HFD-KO mice 34.6 ± 1.84 g, P = 0.039). Additionally, TM5441 treatment of WT mice pre-fed the HFD resulted in a marked suppression of body weight gain in a PAI-1-dependent manner (HFD-WT-Control mice 37.6 ± 1.07 g vs HFD-WT-TM5441 mice 33.8 ± 0.97 g, P = 0.017). TM5441 treatment alleviated HFD-induced systemic and hypothalamic leptin resistance, before suppression of weight gain was evident. Moreover, improved leptin sensitivity in response to TM5441 treatment was accompanied by increased expressions of thermogenesis-related genes such as uncoupling protein 1 in BAT (HFD-WT-Control mice 1.00 ± 0.07 vs HFD-WT-TM5441 mice 1.32 ± 0.05, P = 0.002). These results suggest that PAI-1 plays a causative role in body weight gain under HFD-fed conditions by inducing hypothalamic leptin resistance. Furthermore, they indicate that pharmacological inhibition of PAI-1 activity is a potential strategy for alleviating diet-induced leptin resistance in obese subjects.

Keywords: arcuate nucleus; food intake; leptin resistance; obesity; plasminogen activator inhibitor-1; thermogenesis.


Figures

Figure 1
Figure 1
Time courses of body weight changes, food intake, and oral glucose tolerance tests in PAI-1 knockout (KO) mice fed chow or the safflower oil-rich high fat diet (HFD). (A) Daily food intake of chow-KO and chow-WT mice from the 1st day through the 5th day of observation. Each bar represents the mean ± SE of n = 6 mice. (B) Body weight of chow fed PAI-1 KO mice (chow-KO) and wild-type (WT) control mice (chow-WT). Eight-week-old mice were weighed weekly. Each bar represents the mean ± SE of n = 6 mice. (C) Daily food intake of chow-KO and chow-WT mice from the 71st day through the 75th day of observation. Each bar represents the mean ± SE of n = 6 mice. (D) Body weight of safflower oil-rich high fat diet (HFD) fed PAI-1 KO mice (HFD-KO) and WT control mice (HFD-WT). Eight-week-old mice were fed safflower oil-rich HFD and then were weighed weekly. Each bar represents the mean ± SE of n = 8 mice. (E) Daily food intake of HFD-KO and HFD-WT mice from the 1st day through the 21st day of observation. Each bar represents the mean ± SE of n = 9 mice. (F) Average food intake of HFD-KO and HFD-WT mice from the 1st day through the 21st day of observation. Each bar represents the mean ± SE of n = 9 mice. (G) Blood glucose levels and (H) plasma insulin levels during oral glucose tolerance tests performed 21 days after the initiation of safflower oil-rich HFD feeding. Results are expressed as mean ± SE of n = 8 mice. *P < 0.05 and **P < 0.01.
Figure 2
Figure 2
Body weight and oral glucose tolerance tests in lard-rich HFD fed mice treated with TM5441. (A) Body weight of WT mice fed safflower oil-rich HFD or lard-rich HFD. Each bar represents the mean ± SE of n = 5 mice. (B) Body weight of lard-rich HFD-fed mice treated with TM5441. Ten-week-old WT mice that had been pre-fed the lard-rich HFD for 2 weeks were given either lard-rich HFD mixed with TM5441 (HFD-WT-TM5441 mice) or lard-rich HFD (HFD-WT-Control mice) and then were weighed weekly. Each bar represents the mean ± SE of n = 10 mice. (C) Liver weight of HFD-WT-TM5441 and HFD-WT-Control mice. Each bar represents the mean ± SE of n = 9 mice. (D) Representative hematoxylin eosin (HE) staining of liver sections of HFD-WT-TM5441 and HFD-WT-Control mice (original magnification: 20×, scale bars: 100 μm). (E) Epididymal white adipose tissue (WAT) weight of HFD-WT-TM5441 and HFD-WT-Control mice. Each bar represents the mean ± SE of n = 9 mice. (F) Representative HE staining of WAT sections of HFD-WT-TM5441 and HFD-WT-Control mice (original magnification: 20×, scale bars: 100 μm). (G) Adipocyte size of HFD-WT-TM5441 and HFD-WT-Control mice. Each bar represents the mean ± SE of n = 9 mice. (H) Locomotor activities of HFD-WT-TM5441 and HFD-WT-Control mice during light hours and dark hours. Each bar represents the mean ± SE of n = 7 mice. (I) Blood glucose levels and (J) plasma insulin levels during oral glucose tolerance tests performed 35 days after the initiation of lard-rich HFD feeding. Results are expressed as mean ± SE of n = 9 mice. *P < 0.05 and **P < 0.01.
Figure 3
Figure 3
Body weight of lard-rich HFD fed PAI-1 knockout (KO) mice treated with TM5441. (A) Body weight of lard-rich HFD-fed PAI-1 KO mice treated with TM5441. Ten-week-old PAI-1 KO mice that had been pre-fed the lard-rich HFD for 2 weeks were given either lard-rich HFD mixed with TM5441 (HFD-KO-TM5441 mice) or lard-rich HFD (HFD-KO-Control mice) and then were weighed weekly. Each bar represents the mean ± SE of n = 9 mice. (B) Liver weight of HFD-KO-TM5441 and HFD-KO-Control mice. Each bar represents the mean ± SE of n = 9 mice. (C) WAT weight of HFD-KO-TM5441 and HFD-KO-Control mice. Each bar represents the mean ± SE of n = 9 mice.
Figure 4
Figure 4
Evaluation of leptin sensitivity in lard-rich HFD fed mice treated with TM5441. (A) Plasma leptin levels of HFD-WT-TM5441 mice and HFD-WT-Control mice. Results are expressed as mean ± SE of n = 9 mice. (B) Body weight of HFD-WT-TM5441-Leptin mice, HFD-WT-Control-Leptin mice, HFD-WT-TM5441-Saline mice, and HFD-WT-Control-Saline mice. Ten-week-old WT mice that had been pre-fed the lard-rich HFD for 2 weeks were given either lard-rich HFD mixed with TM5441 or lard-rich HFD for 1 week. Results are expressed as mean ± SE of n = 4 mice. (C) Body weight changes during leptin treatment. Mice were given a daily intraperitoneal injection of either leptin (HFD-WT-TM5441-Leptin mice or HFD-WT-Control-Leptin mice) or saline (HFD-WT-TM5441-Saline mice or HFD-WT-Control-Saline mice) for 5 consecutive days. Body weight immediately before the first leptin injection was subtracted from body weight 24 h after the last injection. Results are expressed as mean ± SE of n = 4 mice. (D) Body weight of HFD-WT-TM5441-Leptin mice, HFD-WT-Control-Leptin mice, HFD-WT-TM5441-Saline mice, and HFD-WT-Control-Saline mice. Ten-week-old WT mice that had been pre-fed the lard-rich HFD for 2 weeks were given either lard-rich HFD mixed with TM5441 or lard-rich HFD for 1 week. Results are expressed as mean ± SE of n = 4 mice. (E) Relative mRNA expressions of agouti-related peptide (agrp), neuropeptide y (npy), and proopiomelanocortin (Pomc) in the hypothalamic arcuate nucleus (ARC). Mice were fasted for 24 h and then given a single intraperitoneal injection of either leptin (HFD-WT-TM5441-Leptin mice or HFD-WT-Control-Leptin mice) or saline (HFD-WT-TM5441-Saline mice or HFD-WT-Control-Saline mice). Brain samples were harvested 4 h after the injection. Results are expressed as mean ± SE of n = 4 mice. (F) Relative mRNA expressions of uncoupling protein 1 (ucp1), peroxisome proliferative activated receptor gamma coactivator 1 alpha (pgc-1a), type II iodothyronine deiodinase (dio2), cell death-inducing DNA fragmentation factor alpha subunit-like effector A (cidea), and PR domain containing 16 (prdm16) in brown adipose tissue (BAT). Ten-week-old WT mice that had been pre-fed the lard-rich HFD for 2 weeks were given either lard-rich HFD mixed with TM5441 or lard-rich HFD for 1 week. Results are expressed as mean ± SE of n = 9 mice. *P < 0.05 and **P < 0.01.

References

    1. Abella V., Scotece M., Conde J., Pino J., Gonzalez-Gay M. A., Gomez-Reino J. J., et al. (2017). Leptin in the interplay of inflammation, metabolism and immune system disorders. Nat. Rev. Rheumatol. 13 (2), 100–109. 10.1038/nrrheum.209 - DOI - PubMed
    1. Arnoldussen I. A., Kiliaan A. J., Gustafson D. R. (2014). Obesity and dementia: adipokines interact with the brain. Eur. Neuropsychopharmacol. 24 (12), 1982–1999. 10.1016/j.euroneuro.2014.03.002 - DOI - PMC - PubMed
    1. Asai Y., Yamada T., Tsukita S., Takahashi K., Maekawa M., Honma M., et al. (2017). Activation of the Hypoxia Inducible Factor 1alpha Subunit Pathway in Steatotic Liver Contributes to Formation of Cholesterol Gallstones. Gastroenterology 152 (6), 1521–1535 e1528. 10.1053/j.gastro.2017.01.001 - DOI - PubMed
    1. Avalos Y., Kerr B., Maliqueo M., Dorfman M. (2018). Cell and molecular mechanisms behind diet-induced hypothalamic inflammation and obesity. J. Neuroendocrinol. 30 (10), e12598. 10.1111/jne.12598 - DOI - PubMed
    1. Bodary P. F. (2007). Links between adipose tissue and thrombosis in the mouse. Arterioscler. Thromb. Vasc. Biol. 27 (11), 2284–2291. 10.1161/ATVBAHA.107.148221 - DOI - PubMed