

Identification of Hub Genes in Protective Effect of Astragaloside IV on Aconitine-Induced Cardiac Damage in Zebrafish Based on Bioinformatics Analysis
- PMID: 32670070
- PMCID: PMC7327619
- DOI: 10.3389/fphar.2020.00957
Identification of Hub Genes in Protective Effect of Astragaloside IV on Aconitine-Induced Cardiac Damage in Zebrafish Based on Bioinformatics Analysis
Abstract
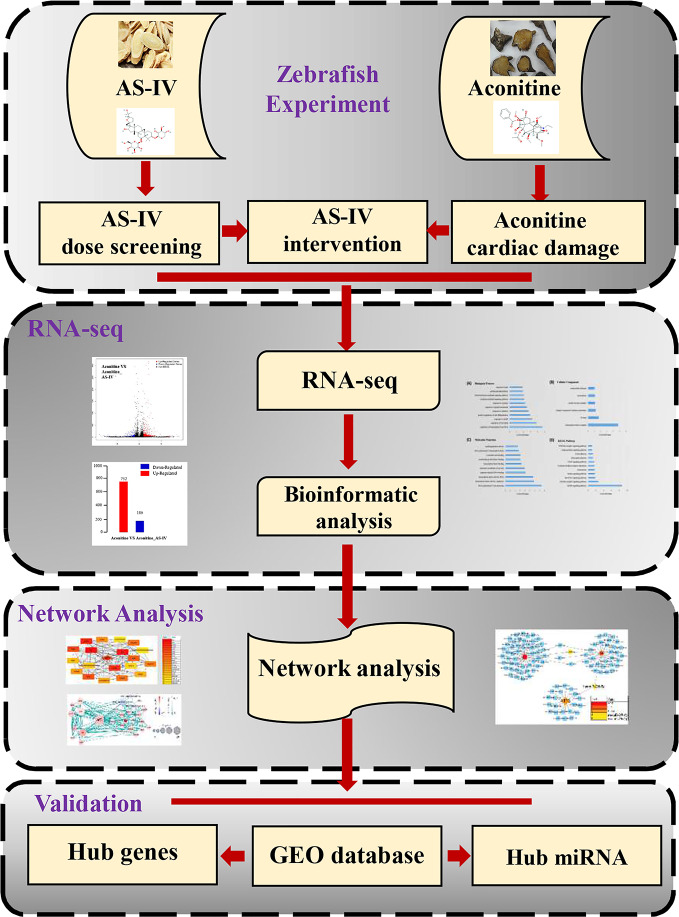
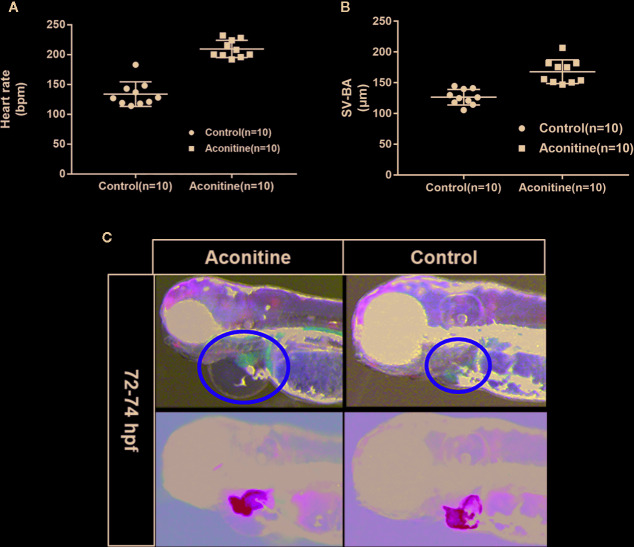
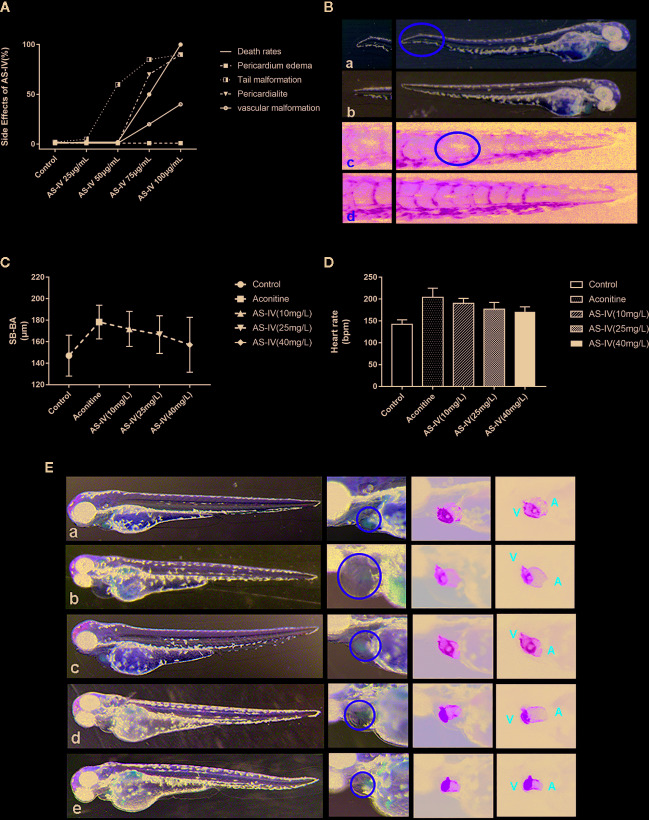
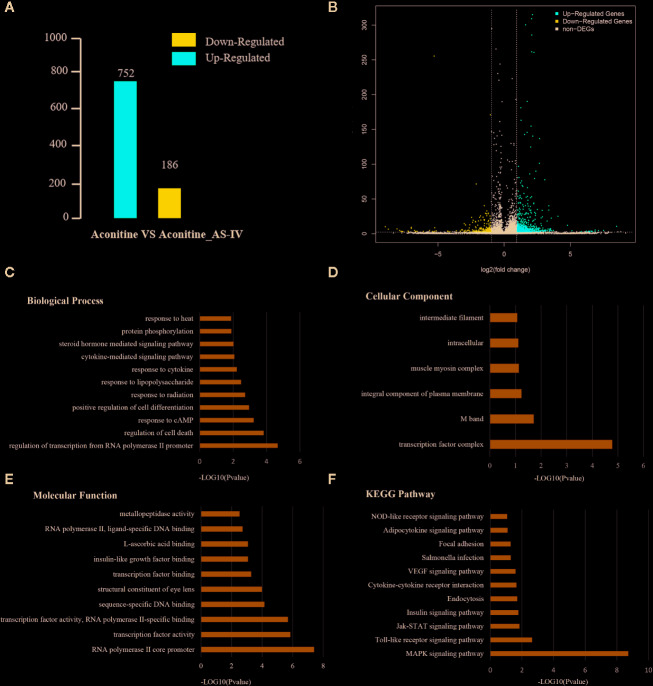
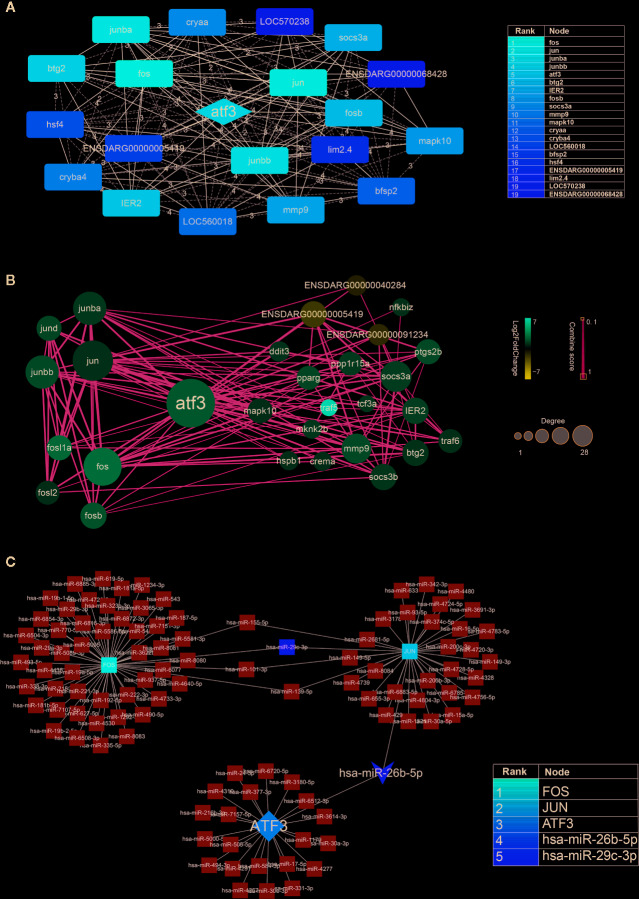
Accumulating evidence suggests that Astragaloside IV (AS-IV) improves cardiac function and protects the cardiovascular system. However, the molecular targets involved remain ambiguous. In this work, we report research suggesting that AS-IV can antagonize arrhythmias and reduce the cardiac damage induced by aconitine in zebrafish. Zebrafish have certain benefits with respect to studying the effect of drugs on cardiovascular disease. The possible mechanisms involved are analyzed, and hub gene targets are predicted. First, a model of cardiac damage induced by aconitine was created, and then a safe drug concentration of AS-IV was screened, and the appropriate drug dose gradient was selected within a safe drug concentration range. Second, we confirmed the protective effect of AS-IV in the cardiovascular system by observing changes in zebrafish heart rates and the cardiac and vascular structure. Third, we aimed to demonstrate the antagonistic mechanism of AS-IV on heart rate and cardiac damage induced by aconitine in zebrafish, with differentially expressed genes (DEGs) detected by RNA sequencing. The DEGs were then further analyzed by bioinformatic techniques, such as function enrichment analysis, protein-protein interaction network, and DNA-microRNA networks, for example. Next, we predicted the hub genes of the cardiac protective effects of AS-IV. Finally, we validated these genes in different transcriptome sequence datasets of cardiac damage. Thus, we conclude that miR-26b-5p/ATF3/JUN are key targets of AS-IV and play an important role in maintaining cardiac homeostasis and regulating cardiac remodeling.
Keywords: RNA sequencing; aconitine; astragaloside IV; bioinformatics analysis; cardiac damage; zebrafish.
Copyright © 2020 Wang, Shi, Yao, Li, Wang, Li and Fu.
Figures
Similar articles
-
Potential Molecular Mechanisms and Drugs for Aconitine-Induced Cardiotoxicity in Zebrafish through RNA Sequencing and Bioinformatics Analysis.Med Sci Monit. 2020 Jun 29;26:e924092. doi: 10.12659/MSM.924092. Med Sci Monit. 2020. PMID: 32598336 Free PMC article.
-
Integrated bioinformatics analysis reveals novel key biomarkers and potential candidate small molecule drugs in gastric cancer.Pathol Res Pract. 2019 May;215(5):1038-1048. doi: 10.1016/j.prp.2019.02.012. Epub 2019 Feb 28. Pathol Res Pract. 2019. PMID: 30975489
-
Identification of hub genes with prognostic values in gastric cancer by bioinformatics analysis.World J Surg Oncol. 2018 Jun 19;16(1):114. doi: 10.1186/s12957-018-1409-3. World J Surg Oncol. 2018. PMID: 29921304 Free PMC article.
-
Identification of differentially expressed genes and preliminary validations in cardiac pathological remodeling induced by transverse aortic constriction.Int J Mol Med. 2019 Oct;44(4):1447-1461. doi: 10.3892/ijmm.2019.4291. Epub 2019 Jul 30. Int J Mol Med. 2019. PMID: 31364721 Free PMC article.
-
Chamber Specific Gene Expression Landscape of the Zebrafish Heart.PLoS One. 2016 Jan 27;11(1):e0147823. doi: 10.1371/journal.pone.0147823. eCollection 2016. PLoS One. 2016. PMID: 26815362 Free PMC article.
Cited by
-
Untapping the Potential of Astragaloside IV in the Battle Against Respiratory Diseases.Drug Des Devel Ther. 2023 Jul 3;17:1963-1978. doi: 10.2147/DDDT.S416091. eCollection 2023. Drug Des Devel Ther. 2023. PMID: 37426627 Free PMC article. Review.
-
Astragaloside IV ameliorates peritoneal fibrosis by promoting PGC-1α to reduce apoptosis in vitro and in vivo.J Cell Mol Med. 2023 Oct;27(19):2945-2955. doi: 10.1111/jcmm.17871. Epub 2023 Jul 26. J Cell Mol Med. 2023. PMID: 37494130 Free PMC article.
References
LinkOut - more resources
Full Text Sources
Molecular Biology Databases
Research Materials
Miscellaneous