Energy Expenditure of Dynamic Submaximal Human Plantarflexion Movements: Model Prediction and Validation by in-vivo Magnetic Resonance Spectroscopy
- PMID: 32671034
- PMCID: PMC7332772
- DOI: 10.3389/fbioe.2020.00622
Energy Expenditure of Dynamic Submaximal Human Plantarflexion Movements: Model Prediction and Validation by in-vivo Magnetic Resonance Spectroscopy
Abstract
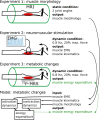
To understand the organization and efficiency of biological movement, it is important to evaluate the energy requirements on the level of individual muscles. To this end, predicting energy expenditure with musculoskeletal models in forward-dynamic computer simulations is currently the most promising approach. However, it is challenging to validate muscle models in-vivo in humans, because access to the energy expenditure of single muscles is difficult. Previous approaches focused on whole body energy expenditure, e.g., oxygen consumption (VO2), or on thermal measurements of individual muscles by tracking blood flow and heat release (through measurements of the skin temperature). This study proposes to validate models of muscular energy expenditure by using functional phosphorus magnetic resonance spectroscopy (31P-MRS). 31P-MRS allows to measure phosphocreatine (PCr) concentration which changes in relation to energy expenditure. In the first 25 s of an exercise, PCr breakdown rate reflects ATP hydrolysis, and is therefore a direct measure of muscular enthalpy rate. This method was applied to the gastrocnemius medialis muscle of one healthy subject during repetitive dynamic plantarflexion movements at submaximal contraction, i.e., 20% of the maximum plantarflexion force using a MR compatible ergometer. Furthermore, muscle activity was measured by surface electromyography (EMG). A model (provided as open source) that combines previous models for muscle contraction dynamics and energy expenditure was used to reproduce the experiment in simulation. All parameters (e.g., muscle length and volume, pennation angle) in the model were determined from magnetic resonance imaging or literature (e.g., fiber composition), leaving no free parameters to fit the experimental data. Model prediction and experimental data on the energy supply rates are in good agreement with the validation phase (<25 s) of the dynamic movements. After 25 s, the experimental data differs from the model prediction as the change in PCr does not reflect all metabolic contributions to the energy expenditure anymore and therefore underestimates the energy consumption. This shows that this new approach allows to validate models of muscular energy expenditure in dynamic movements in vivo.
Keywords: 31P-MRS; biomechanical modeling; energy; magnetic resonance imaging (MRI); magnetic resonance spectroscopy; muscle; plantar flexion; validation.
Copyright © 2020 Haeufle, Siegel, Hochstein, Gussew, Schmitt, Siebert, Rzanny, Reichenbach and Stutzig.
Figures


Similar articles
-
Depth-resolved surface coil MRS (DRESS)-localized dynamic (31) P-MRS of the exercising human gastrocnemius muscle at 7 T.NMR Biomed. 2014 Nov;27(11):1346-52. doi: 10.1002/nbm.3196. Epub 2014 Sep 9. NMR Biomed. 2014. PMID: 25199902
-
Dynamic multivoxel-localized 31 P MRS during plantar flexion exercise with variable knee angle.NMR Biomed. 2018 Jun;31(6):e3905. doi: 10.1002/nbm.3905. Epub 2018 Mar 26. NMR Biomed. 2018. PMID: 29578260 Free PMC article. Clinical Trial.
-
Dynamic 31P MR spectroscopy of plantar flexion: influence of ergometer design, magnetic field strength (3 and 7 T), and RF-coil design.Med Phys. 2015 Apr;42(4):1678-89. doi: 10.1118/1.4914448. Med Phys. 2015. PMID: 25832057
-
Contributions to the understanding of gait control.Dan Med J. 2014 Apr;61(4):B4823. Dan Med J. 2014. PMID: 24814597 Review.
-
MR compatible ergometers for dynamic 31P MRS.J Appl Biomed. 2019 Jun;17(2):91-98. doi: 10.32725/jab.2019.006. Epub 2019 Apr 15. J Appl Biomed. 2019. PMID: 34907736 Review.
Cited by
-
Using physiologically based models to predict in vivo skeletal muscle energetics.J Exp Biol. 2025 Apr 1;228(7):jeb249966. doi: 10.1242/jeb.249966. Epub 2025 Mar 31. J Exp Biol. 2025. PMID: 39960312 Free PMC article.
-
Quantification of training-induced alterations in body composition via automated machine learning analysis of MRI images in the thigh region: A pilot study in young females.Physiol Rep. 2025 Feb;13(3):e70187. doi: 10.14814/phy2.70187. Physiol Rep. 2025. PMID: 39878619 Free PMC article. Clinical Trial.
References
-
- Arampatzis A., Karamanidis K., Stafilidis S., Morey-Klapsing G., DeMonte G., Brüggemann G. P. (2006). Effect of different ankle- and knee-joint positions on gastrocnemius medialis fascicle length and EMG activity during isometric plantar flexion. J. Biomech. 39, 1891–1902. 10.1016/j.jbiomech.2005.05.010 - DOI - PubMed
-
- Barbero M., Merletti R., Rainoldi A. (2012). Atlas of Muscle Innervation Zones: Understanding Surface Electromyography and Its Applications. Milano: Springer: 10.1007/978-88-470-2463-2 - DOI
LinkOut - more resources
Full Text Sources

