

Cerebrospinal fluid biomarkers of Alzheimer's disease in a cohort of adults with Down syndrome
- PMID: 32671183
- PMCID: PMC7346867
- DOI: 10.1002/dad2.12057
Cerebrospinal fluid biomarkers of Alzheimer's disease in a cohort of adults with Down syndrome
Abstract
Introduction: Virtually all individuals with Down syndrome (DS) will develop Alzheimer's disease (AD) pathology by age 40. Cerebrospinal fluid (CSF) biomarkers have characterized AD pathology in cohorts of late-onset AD (LOAD) and autosomal-dominant AD (ADAD). Few studies have evaluated such biomarkers in adults with DS.
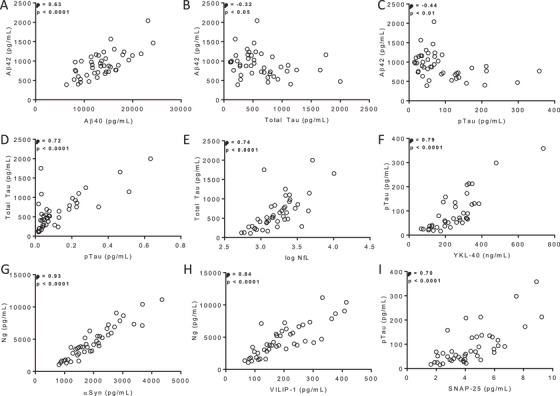
Methods: CSF concentrations of amyloid beta (Aβ)40, Aβ42, tau, phospho-tau181 (p-tau), neurofilament light chain (NfL), soluble triggering receptor expressed on myeloid cells 2 (sTREM2), chitinase-3-like protein 1 (YKL-40), alpha synuclein (αSyn), neurogranin (Ng), synaptosomal-associated protein 25 (SNAP-25), and visinin-like protein 1 (VILIP-1) were assessed in CSF from 44 adults with DS from the Alzheimer's Biomarker Consortium-Down Syndrome study. Biomarker levels were evaluated by cognitive status, age, and apolipoprotein E gene (APOE) ε4 carrier status.
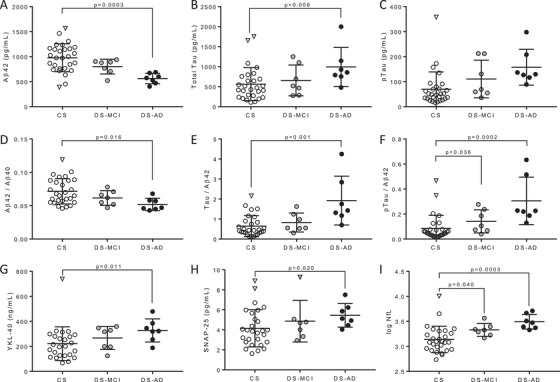
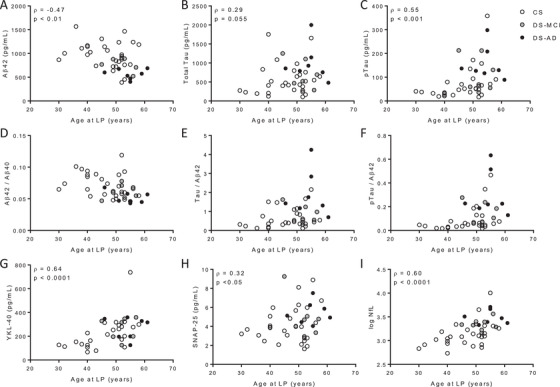
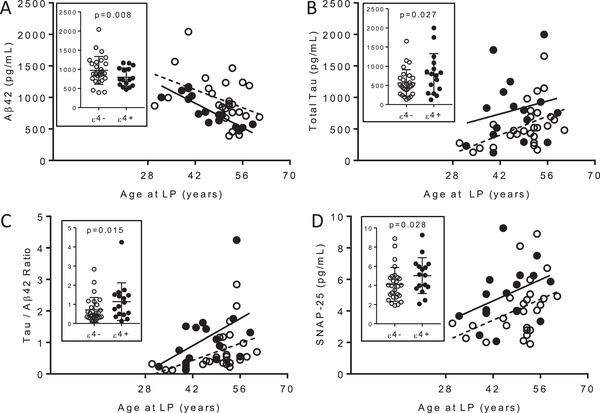
Results: Biomarker abnormalities indicative of amyloid deposition, tauopathy, neurodegeneration, synaptic dysfunction, and neuroinflammation were associated with increased cognitive impairment. Age and APOE ε4 status influenced some biomarkers.
Discussion: The profile of many established and emerging CSF biomarkers of AD in a cohort of adults with DS was similar to that reported in LOAD and ADAD, while some differences were observed.
Keywords: Alzheimer's disease; Down syndrome; amyloid; biomarkers; cerebrospinal fluid; tau.
© 2020 The Authors. Alzheimer's & Dementia: Diagnosis, Assessment & Disease Monitoring published by Wiley Periodicals, Inc. on behalf of Alzheimer's Association.
Conflict of interest statement
Ms. Henson, Mr. Doran, and Drs. Christian, Handen, Klunk, Lai, Lee, Rosas, Schupf, Zaman, and Lott report no conflicts. Dr. Fagan has received research support from Biogen, Fujirebio, and Roche Diagnostics. She is a member of the scientific advisory boards for Roche Diagnostics, Genentech, and AbbVie, and she also consults for Araclon/Griffols, DiademRes, and Otsuka Pharmaceuticals.
Figures
References
-
- Zigman WB, Schupf N, Sersen E, Silverman W. Prevalence of dementia in adults with and without Down syndrome. Am J Ment Retard. 1996;100:403‐412. - PubMed
Grants and funding
- P50 AG005681/AG/NIA NIH HHS/United States
- U19 AG068054/AG/NIA NIH HHS/United States
- U54 HD087011/HD/NICHD NIH HHS/United States
- P30 AG066462/AG/NIA NIH HHS/United States
- U01 AG051412/AG/NIA NIH HHS/United States
- P50 AG005133/AG/NIA NIH HHS/United States
- UL1 TR001414/TR/NCATS NIH HHS/United States
- UL1 TR002373/TR/NCATS NIH HHS/United States
- P30 AG062715/AG/NIA NIH HHS/United States
- U54 HD090256/HD/NICHD NIH HHS/United States
- UL1 TR002345/TR/NCATS NIH HHS/United States
- UL1 TR001857/TR/NCATS NIH HHS/United States
- U24 AG021886/AG/NIA NIH HHS/United States
- P30 AG062421/AG/NIA NIH HHS/United States
- P50 AG008702/AG/NIA NIH HHS/United States
- U01 AG051406/AG/NIA NIH HHS/United States
- UL1 TR001873/TR/NCATS NIH HHS/United States
LinkOut - more resources
Full Text Sources
Research Materials
Miscellaneous