

The origin of domestication genes in goats
- PMID: 32671210
- PMCID: PMC7314551
- DOI: 10.1126/sciadv.aaz5216
The origin of domestication genes in goats
Abstract
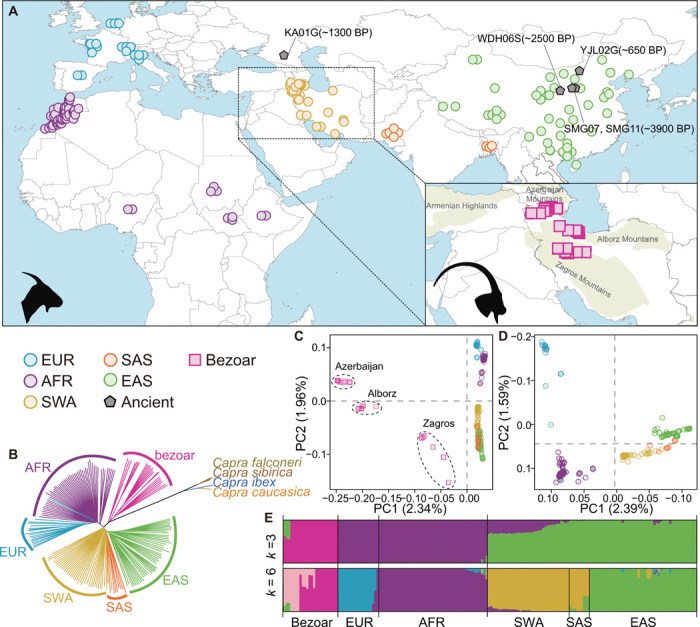
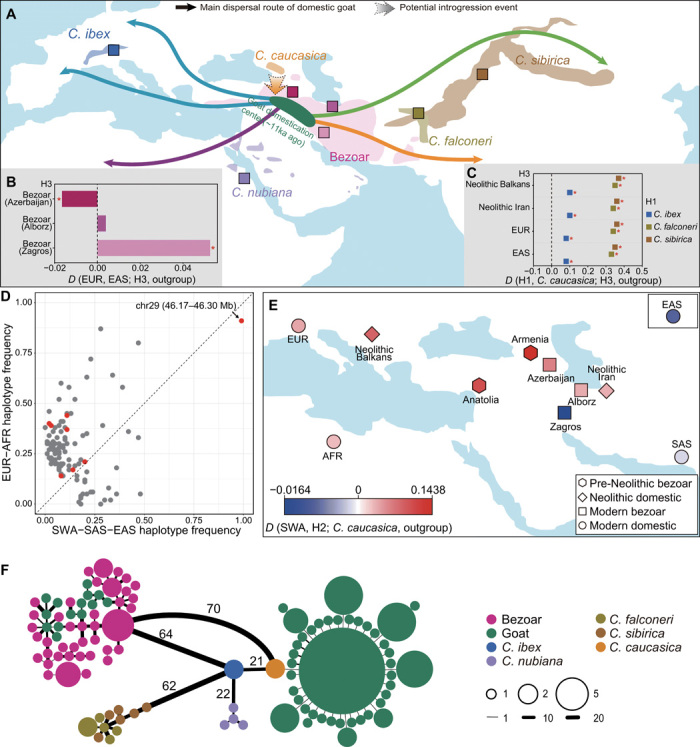
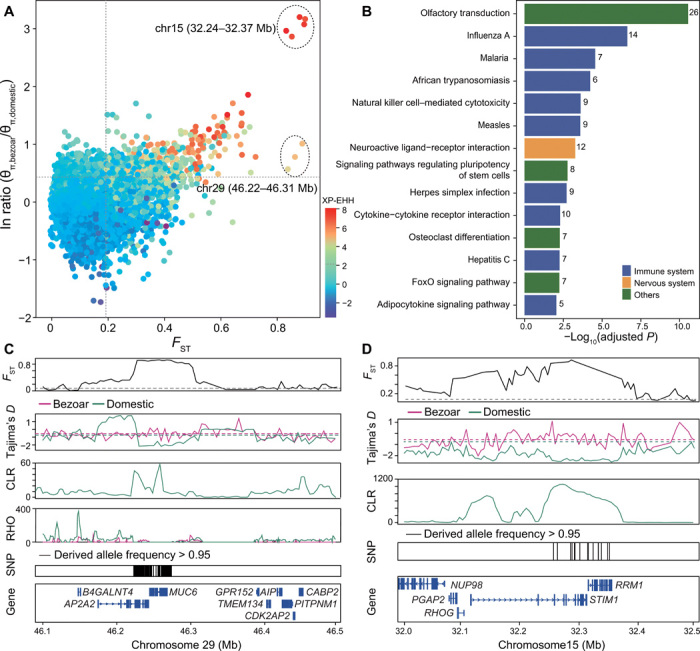
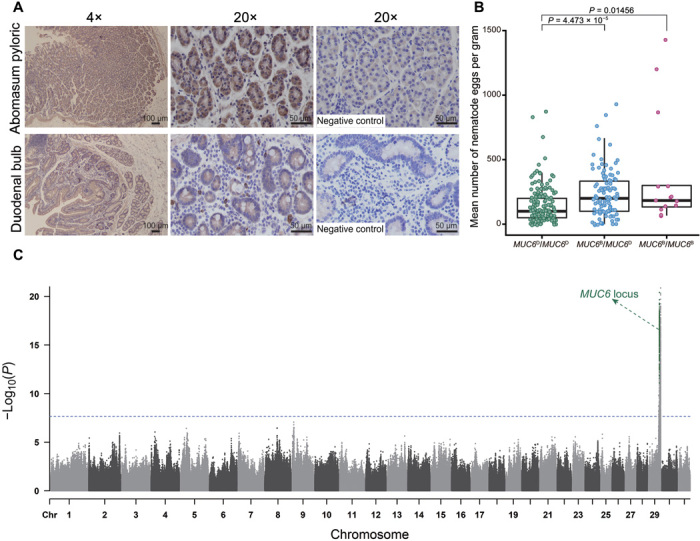
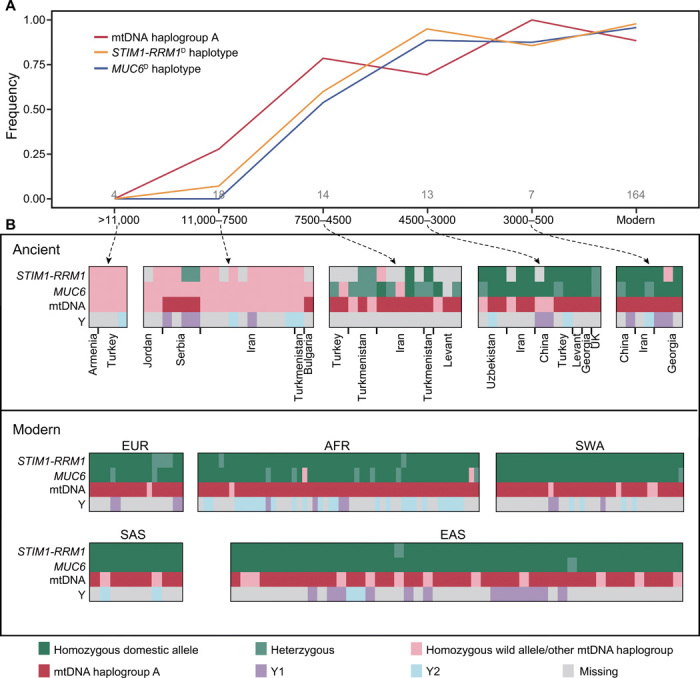
Goat domestication was critical for agriculture and civilization, but its underlying genetic changes and selection regimes remain unclear. Here, we analyze the genomes of worldwide domestic goats, wild caprid species, and historical remains, providing evidence of an ancient introgression event from a West Caucasian tur-like species to the ancestor of domestic goats. One introgressed locus with a strong signature of selection harbors the MUC6 gene, which encodes a gastrointestinally secreted mucin. Experiments revealed that the nearly fixed introgressed haplotype confers enhanced immune resistance to gastrointestinal pathogens. Another locus with a strong signal of selection may be related to behavior. The selected alleles at these two loci emerged in domestic goats at least 7200 and 8100 years ago, respectively, and increased to high frequencies concurrent with the expansion of the ubiquitous modern mitochondrial haplogroup A. Tracking these archaeologically cryptic evolutionary transformations provides new insights into the mechanisms of animal domestication.
Copyright © 2020 The Authors, some rights reserved; exclusive licensee American Association for the Advancement of Science. No claim to original U.S. Government Works. Distributed under a Creative Commons Attribution NonCommercial License 4.0 (CC BY-NC).
Figures
Similar articles
-
The goat domestication process inferred from large-scale mitochondrial DNA analysis of wild and domestic individuals.Proc Natl Acad Sci U S A. 2008 Nov 18;105(46):17659-64. doi: 10.1073/pnas.0804782105. Epub 2008 Nov 12. Proc Natl Acad Sci U S A. 2008. PMID: 19004765 Free PMC article.
-
Whole mitochondrial genomes unveil the impact of domestication on goat matrilineal variability.BMC Genomics. 2015 Dec 29;16:1115. doi: 10.1186/s12864-015-2342-2. BMC Genomics. 2015. PMID: 26714643 Free PMC article.
-
Whole-genome SNP genotyping unveils ancestral and recent introgression in wild and domestic goats.Mol Ecol. 2024 Jan;33(1):e17190. doi: 10.1111/mec.17190. Epub 2023 Nov 1. Mol Ecol. 2024. PMID: 37909668
-
Goat domestication and breeding: a jigsaw of historical, biological and molecular data with missing pieces.Anim Genet. 2017 Dec;48(6):631-644. doi: 10.1111/age.12598. Epub 2017 Sep 4. Anim Genet. 2017. PMID: 28872195 Review.
-
The origin and domestication history of domestic horses and the domestication characteristics of breeds.Yi Chuan. 2022 Mar 20;44(3):216-229. doi: 10.16288/j.yczz.21-260. Yi Chuan. 2022. PMID: 35307645 Review.
Cited by
-
A novel lineage of the Capra genus discovered in the Taurus Mountains of Turkey using ancient genomics.Elife. 2022 Oct 3;11:e82984. doi: 10.7554/eLife.82984. Elife. 2022. PMID: 36190761 Free PMC article.
-
Domestication of farmed fish via the attenuation of stress responses mediated by the hypothalamus-pituitary-inter-renal endocrine axis.Front Endocrinol (Lausanne). 2022 Jul 22;13:923475. doi: 10.3389/fendo.2022.923475. eCollection 2022. Front Endocrinol (Lausanne). 2022. PMID: 35937837 Free PMC article. Review.
-
SNP-Based Genotyping Provides Insight Into the West Asian Origin of Russian Local Goats.Front Genet. 2021 Jul 1;12:708740. doi: 10.3389/fgene.2021.708740. eCollection 2021. Front Genet. 2021. PMID: 34276802 Free PMC article.
-
Structural variant landscapes reveal convergent signatures of evolution in sheep and goats.Genome Biol. 2024 Jun 6;25(1):148. doi: 10.1186/s13059-024-03288-6. Genome Biol. 2024. PMID: 38845023 Free PMC article.
-
Whole-genome variants resource of 298 Saanen dairy goats.Sci Data. 2025 Mar 29;12(1):528. doi: 10.1038/s41597-025-04880-6. Sci Data. 2025. PMID: 40157930 Free PMC article.
References
-
- Larson G., Fuller D. Q., The evolution of animal domestication. Annu. Rev. Ecol. Evol. Syst. 45, 115–136 (2014).
-
- F. Pereira, A. Amorim, in Origin and Spread of Goat Pastoralism (John Wiley & Sons, 2010).
-
- Colli L., Milanesi M., Talenti A., Bertolini F., Chen M., Crisà A., Daly K. G., Del Corvo M., Guldbrandtsen B., Lenstra J. A., Rosen B. D., Vajana E., Catillo G., Joost S., Nicolazzi E. L., Rochat E., Rothschild M. F., Servin B., Sonstegard T. S., Steri R., Van Tassell C. P., Ajmone-Marsan P., Crepaldi P., Stella A.; AdaptMap Consortium , Genome-wide SNP profiling of worldwide goat populations reveals strong partitioning of diversity and highlights post-domestication migration routes. Genet. Sel. Evol. 50, 58 (2018). - PMC - PubMed
-
- Alberto F. J., Boyer F., Orozco-terWengel P., Streeter I., Servin B., de Villemereuil P., Benjelloun B., Librado P., Biscarini F., Colli L., Barbato M., Zamani W., Alberti A., Engelen S., Stella A., Joost S., Ajmone-Marsan P., Negrini R., Orlando L., Rezaei H. R., Naderi S., Clarke L., Flicek P., Wincker P., Coissac E., Kijas J., Tosser-Klopp G., Chikhi A., Bruford M. W., Taberlet P., Pompanon F., Convergent genomic signatures of domestication in sheep and goats. Nat. Commun. 9, 813 (2018). - PMC - PubMed
Publication types
LinkOut - more resources
Full Text Sources
