. 2020;2(1):fcaa068.
doi: 10.1093/braincomms/fcaa068. Epub 2020 May 27.

Progressive dysexecutive syndrome due to Alzheimer's disease: a description of 55 cases and comparison to other phenotypes

Affiliations

Progressive dysexecutive syndrome due to Alzheimer's disease: a description of 55 cases and comparison to other phenotypes

Ryan A Townley et al. Brain Commun. 2020.

Abstract

We report a group of patients presenting with a progressive dementia syndrome characterized by predominant dysfunction in core executive functions, relatively young age of onset and positive biomarkers for Alzheimer's pathophysiology. Atypical frontal, dysexecutive/behavioural variants and early-onset variants of Alzheimer's disease have been previously reported, but no diagnostic criteria exist for a progressive dysexecutive syndrome. In this retrospective review, we report on 55 participants diagnosed with a clinically defined progressive dysexecutive syndrome with 18F-fluorodeoxyglucose-positron emission tomography and Alzheimer's disease biomarkers available. Sixty-two per cent of participants were female with a mean of 15.2 years of education. The mean age of reported symptom onset was 53.8 years while the mean age at diagnosis was 57.2 years. Participants and informants commonly referred to initial cognitive symptoms as 'memory problems' but upon further inquiry described problems with core executive functions of working memory, cognitive flexibility and cognitive inhibitory control. Multi-domain cognitive impairment was evident in neuropsychological testing with executive dysfunction most consistently affected. The frontal and parietal regions which overlap with working memory networks consistently demonstrated hypometabolism on positron emission tomography. Genetic testing for autosomal dominant genes was negative in all eight participants tested and at least one APOE ε4 allele was present in 14/26 participants tested. EEG was abnormal in 14/17 cases with 13 described as diffuse slowing. Furthermore, CSF or neuroimaging biomarkers were consistent with Alzheimer's disease pathophysiology, although CSF p-tau was normal in 24% of cases. Fifteen of the executive predominate participants enrolled in research neuroimaging protocols and were compared to amnestic (n = 110), visual (n = 18) and language (n = 7) predominate clinical phenotypes of Alzheimer's disease. This revealed a consistent pattern of hypometabolism in parieto-frontal brain regions supporting executive functions with relative sparing of the medial temporal lobe (versus amnestic phenotype), occipital (versus visual phenotype) and left temporal (versus language phenotype). We propose that this progressive dysexecutive syndrome should be recognized as a distinct clinical phenotype disambiguated from behavioural presentations and not linked specifically to the frontal lobe or a particular anatomic substrate without further study. This clinical presentation can be due to Alzheimer's disease but is likely not specific for any single aetiology. Diagnostic criteria are proposed to facilitate additional research into this understudied clinical presentation.

Keywords: CSF biomarkers; FDG-PET; dysexecutive; early-onset Alzheimer’s disease; tau PET.


Figures

Graphical Abstract
Graphical Abstract
Figure 1
Figure 1
Box 2 Example Case Neuroimaging at presentation (2 years of symptoms) with (A) FDG–PET (Cortex ID, GE Healthcare) showing severe bilateral right > left temporal, parietal, precuneus, posterior cingulate and frontal hypometabolism; (B) MRI Axial T2 Flair and Coronal T1 images with mild right parietal atrophy with no frontal or hippocampal atrophy; (C) 18F-AV1451 tau PET with severe global tau radiotracer uptake; (D) Positive PiB amyloid-PET.
Figure 2
Figure 2
Discordance of CSF p-tau biomarkers and tau PET in five participants who had CSF p-tau in the normal range (< 61 pg/ml). Left: FDG–PET (using Cortex ID, GE Healthcare) with z-score bar at the top. Middle:18F-AV1451 tau PET with SUVR bar at the top and individual meta-ROI SUVR below each image. Right: PiB amyloid PET with SUVR bar at the top and individual meta-ROI SUVR below each image. Significant 18F-AV1451 uptake was present in all five participants (mean SUVR 2.05). CSF p-tau level, tau PET SUVR and mean time lag between CSF and tau PET for each participant can be found in Supplementary Table 1. *Bottom participant came to autopsy and was found to have A3, B3, C3 Alzheimer’s disease pathology.
Figure 3
Figure 3
Molecular neuroimaging and heterogeneity in dysexecutive Alzheimer’s disease of the remaining participants with all three molecular imaging modalities available (participant in Fig. 5 not included). Participants are separated into two columns. Within each column: Left: FDG–PET (using Cortex ID, GE Healthcare) with z-score bar at the top. Middle:18F-AV1451 tau PET with SUVR bar at the top and individual meta-ROI SUVR below each image. Right: PiB amyloid-PET with SUVR bar at the top and individual meta-ROI SUVR below each image. There is hypometabolism and tau PET uptake predominantly in the dorsolateral prefrontal, lateral temporoparietal, precuneus and posterior cingulate regions, with inter-individual heterogeneity in topography and degree of involvement. CSF p-tau level, tau PET SUVR and mean time lag between CSF and tau PET for each participant can be found in Supplementary Table 1.
Figure 4
Figure 4
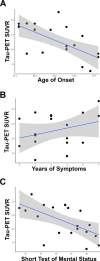
Age of onset association with tau PET burden: Scatter plots of the 20 participants with tau PET scans: (A) A younger age of onset was associated with a higher tau PET SUVR (multiple r2 = 0.41; adjusted r2 = 0.38, P < 0.005). (B) Years of symptoms prior to tau PET was not statistically significant (multiple r2 = 0.09; adjusted r2 = 0.04, P = 0.21). (C) Higher tau PET SUVR was associated with lower bedside cognitive testing (multiple r2 = 0.33; adjusted r2 = 0.29, P < 0.01).
Figure 5
Figure 5
Longitudinal case example: A 54-year-old female with 3 years of mild multi-tasking difficulties before presentation had 3 years of longitudinal molecular imaging with (A) FDG–PET (Cortex ID z-score 0 to −7, GE Healthcare) showing mild hypometabolism that progresses over 3 years. (B) 18F-AV1451 tau PET (SUVR scale 0–2.5) radioligand uptake preceding hypometabolism at each time point. (C) Significant PiB amyloid-PET (SUVR scale 0–3) radioligand uptake in an Alzheimer’s disease pattern. (D) Neuropsychological scores showing mild impairment at initial presentation (green bars) despite already significant tau PET uptake in the bilateral temporal, parietal and frontal lobes. Cognitive impairment progressed at two-time points (red and blue bars) consistent with FDG–PET and tau PET progression. Trails B and Stroop Color-Word testing were severely impaired and multiple cognitive domains were impaired after 3 years. Logical memory based tests were also significantly abnormal but orientation questions on MoCA were not altered until the third time point (6/6, 6/6, 4/6 at each visit). DRS-2, Dementia Rating Scale-2; Rey-O; SUVR, standardized uptake value ratio.
Figure 6
Figure 6
Autopsy results from two dysexecutive Alzheimer’s disease participants and one typical Alzheimer’s disease participant. (A–E) A 54-year-old female had 7 years of progressive symptoms that started with organizing/planning difficulties which lead to losing her job. She additionally repeated stories and had difficulty with numbers. Her initial MRI 2 years into symptoms showed moderate left parietal, mild right parietal and left frontal atrophy. Within 6 years her cognition rapidly decreased and her MoCA was zero. On autopsy, she had a Thal amyloid phase of 5 and Braak tangle stage of VI. (A) Upon macroscopic inspection, significant global atrophy was observed affecting parietal and frontal lobes to a greater extent compared to the temporal lobe. (B) Tau pathology was greatest in parietal and (C) frontal cortex compared to (D) temporal cortex. (E) TDP-43 immunohistochemistry in the amygdala revealed sparse neuronal cytoplasmic inclusions and neurites. (F–J) A 62-year-old male participant had 7 years of progressive symptoms that started with impairment in multi-tasking and problem-solving. Over time he developed severe aphasia and apraxia on the right side. (F) Macroscopic inspection revealed global atrophy, predominantly involving the frontal lobe. He had a Thal amyloid phase of 5 and Braak tangle stage of V. (G) The amount of tau pathology observed in the parietal and (H) frontal cortices was greater than that observed in (I) temporal cortex. (J) TDP-43 immunohistochemistry in the amygdala revealed subpial neurites, but no neuronal cytoplasmic inclusions were observed. (K–O) An 84-year-old male was first noted to have symptoms of memory loss with a slow, but significant progression to typical Alzheimer’s dementia. (K) Macroscopic inspection revealed global atrophy without focal lobar involvement. (L) Tau pathology was observed in parietal and (M) frontal cortices to a lesser extent than that observed in (N) temporal cortex. (O) TDP-43 immunohistochemistry in the amygdala revealed sparse neuronal cytoplasmic inclusions and neurites. Scale bar represents 50 μm for tau photomicrographs and 25 μm for TDP-43 photomicrographs.
Figure 7
Figure 7
FDG–PET in executive predominant presentations versus amnestic, visual and language predominant Alzheimer’s disease phenotypes. The FDG–PET scans from participants with dysexecutive predominate presentations (n = 15) were compared to (A) amnestic predominate (n = 110), (B) visual predominant (n = 18), (C) and language predominant (n = 7) presentations of Alzheimer’s disease. In each panel, the blue-black end of the spectrum encodes the t-score for a greater degree of hypometabolism in the dysexecutive phenotype with red-orange encoding the greater degree of either (A) amnestic, (B) visual or (C) language phenotype. The t-value corresponding to voxel-level P-value of FDR corrected 0.05 (A and B) or uncorrected 0.001 (C) is indicated with arrows in the colour-bar.
Figure 8
Figure 8
Violin scatter plots comparing variables between executive (n = 15), amnestic (n = 110), visual (n = 18) and language predominant (n = 7) Alzheimer’s disease phenotypes. There was a significant main effect of phenotype for (A) age at evaluation, (B) age at disease onset and (C) hippocampal volume. There was no significant main effect of phenotype for (D) disease duration, (E) short test of mental status (STMS), (F) or cortical thickness in Alzheimer’s disease signature regions. Pairwise P-values are indicated as follows: ns = 1, *0.05, **0.01, ***0.001, ****0.

References

    1. Andreasen N, Minthon L, Davidsson P, Vanmechelen E, Vanderstichele H, Winblad B, et al.Evaluation of CSF-tau and CSF-Abeta42 as diagnostic markers for Alzheimer disease in clinical practice. Arch Neurol 2001; 58: 373–9. - PubMed
    1. Ashburner J, Friston KJ.. Unified segmentation. Neuroimage 2005; 26: 839–51. - PubMed
    1. Baddeley A. Working memory Vol. 11 Oxford: Oxford University Press, Clarendon Press; 1986.
    1. Baddeley A. Working memory. Science 1992; 255: 556–9. - PubMed
    1. Baddeley A. The fractionation of working memory. Proc Natl Acad Sci U S A 1996; 93: 13468–72. - PMC - PubMed

LinkOut - more resources