. 2020 Oct;14(10):2384-2402.
doi: 10.1002/1878-0261.12764. Epub 2020 Sep 1.

A robust multiplex immunofluorescence and digital pathology workflow for the characterisation of the tumour immune microenvironment

Affiliations

A robust multiplex immunofluorescence and digital pathology workflow for the characterisation of the tumour immune microenvironment

Amélie Viratham Pulsawatdi et al. Mol Oncol. 2020 Oct.

Abstract

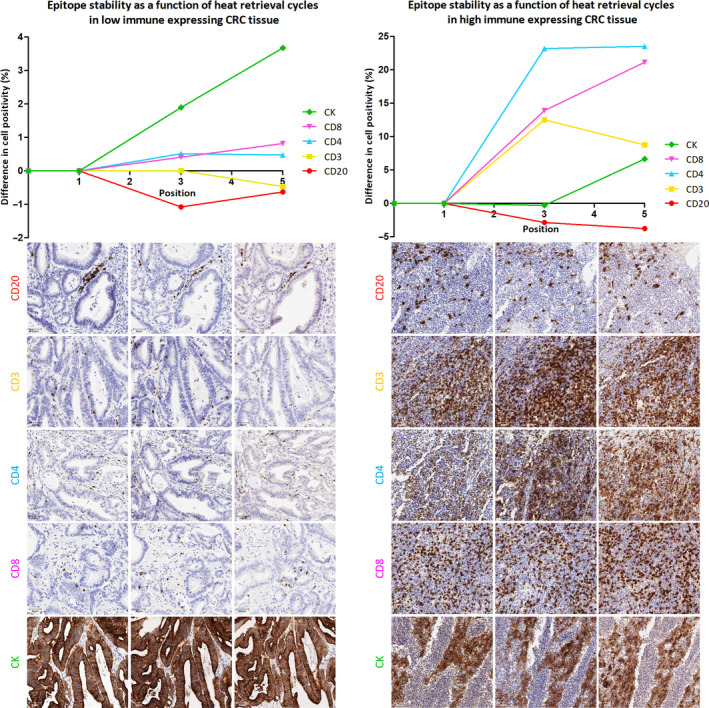
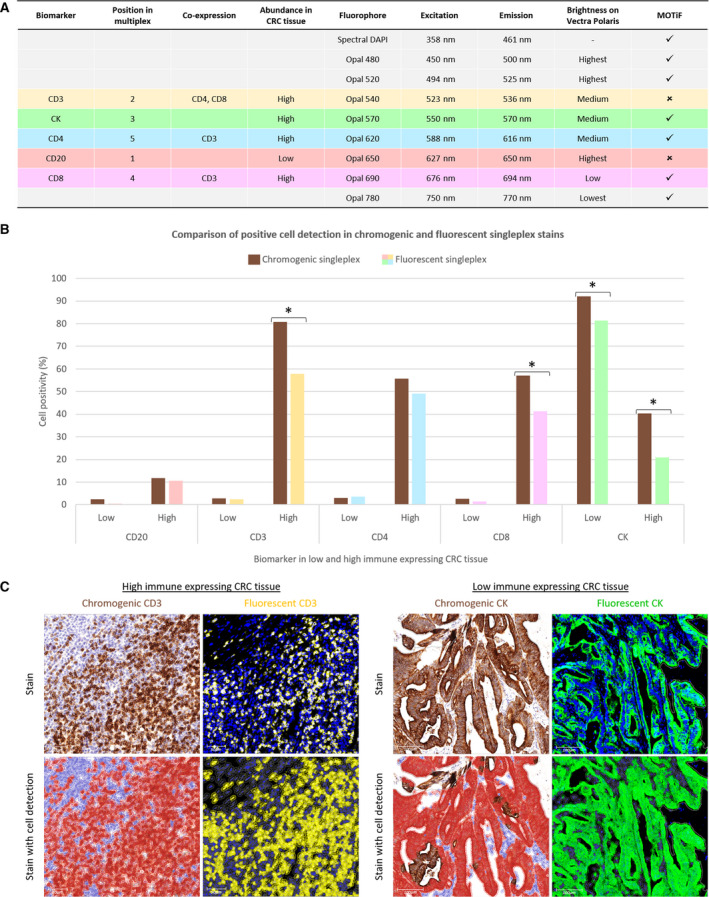
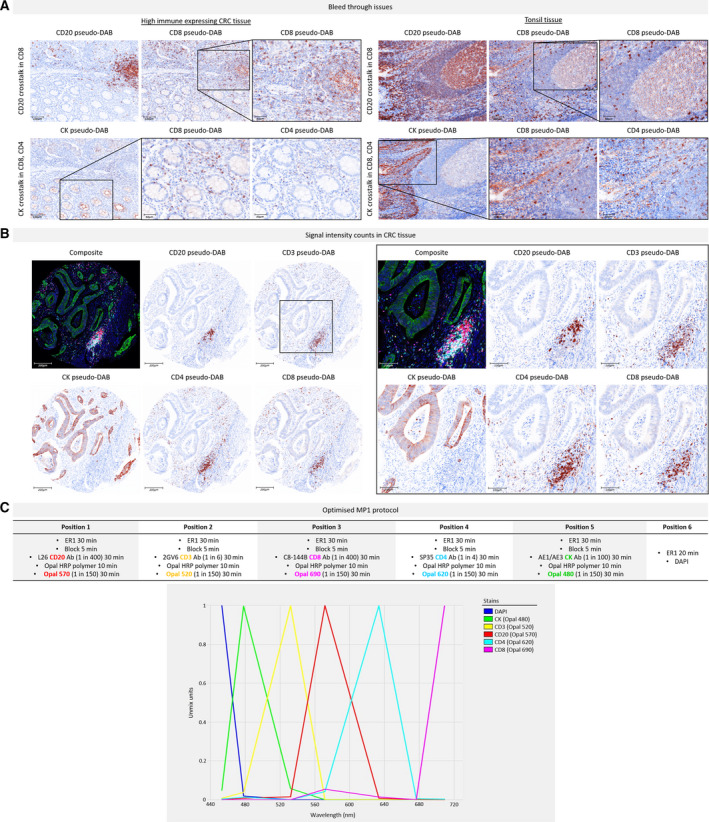
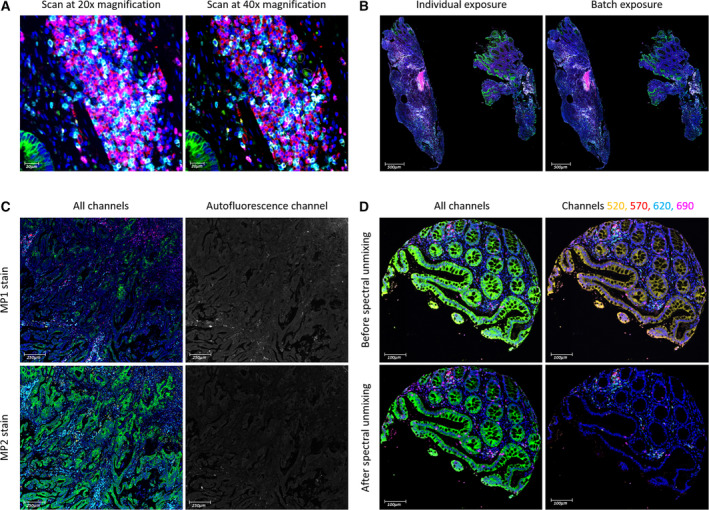
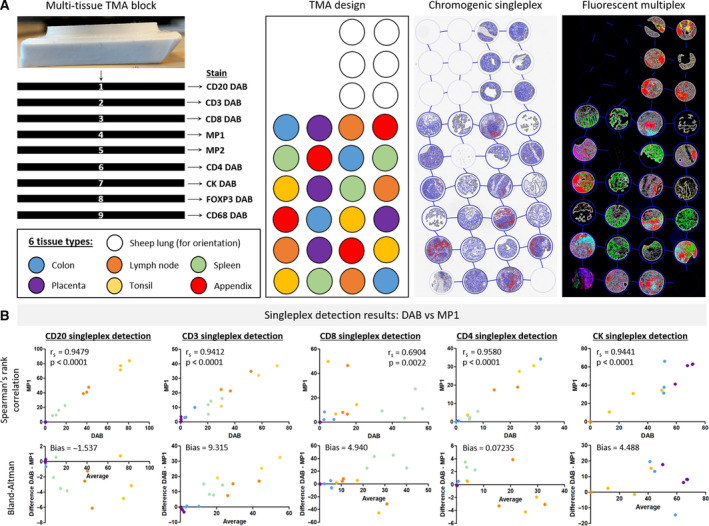
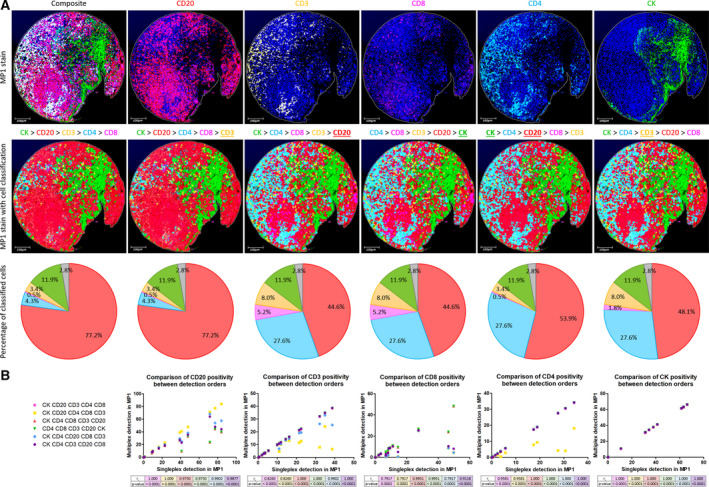
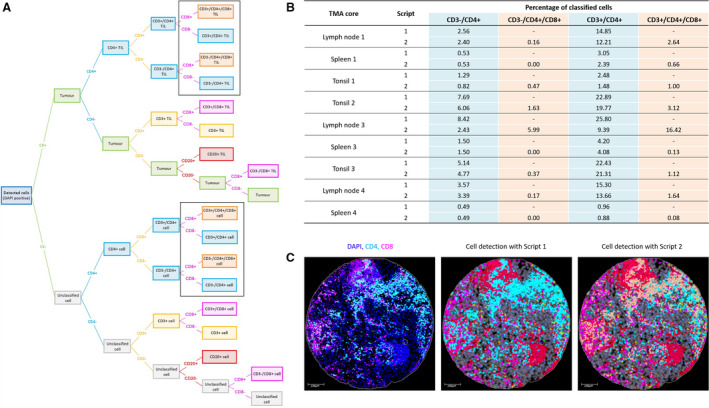
Multiplex immunofluorescence is a powerful tool for the simultaneous detection of tissue-based biomarkers, revolutionising traditional immunohistochemistry. The Opal methodology allows up to eight biomarkers to be measured concomitantly without cross-reactivity, permitting identification of different cell populations within the tumour microenvironment. In this study, we aimed to validate a multiplex immunofluorescence workflow in two complementary multiplex panels and evaluate the tumour immune microenvironment in colorectal cancer (CRC) formalin-fixed paraffin-embedded tissue. We stained CRC and tonsil samples using Opal multiplex immunofluorescence on a Leica BOND RX immunostainer. We then acquired images on an Akoya Vectra Polaris and performed multispectral unmixing using inform. Antibody panels were validated on tissue microarray sections containing cores from six normal tissue types, using qupath for image analysis. Comparisons between chromogenic immunohistochemistry and multiplex immunofluorescence on consecutive sections from the same tissue microarray showed significant correlation (rs > 0.9, P-value < 0.0001), validating both panels. We identified many factors that influenced the quality of the acquired fluorescent images, including biomarker co-expression, staining order, Opal-antibody pairing, sample thickness, multispectral unmixing and biomarker detection order during image analysis. Overall, we report the optimisation and validation of a multiplex immunofluorescence process, from staining to image analysis, ensuring assay robustness. Our multiplex immunofluorescence protocols permit the accurate detection of multiple immune markers in various tissue types, using a workflow that enables rapid processing of samples, above and beyond previous workflows.

Keywords: image analysis; multiplex immunofluorescence; opal methodology.


Conflict of interest statement

Prof Phil Quirke has research funding with Roche, GeneFirst and Amgen, previous research funding from Halio, consultancy with Nordlai‐Adlyte and advisory boards with Merck, Amgen and Roche. Prof Manuel Salto‐Tellez is a senior scientific advisor to Philips Computational Pathology and Sonrai Analytics, and has received honoraria from Roche, AstraZeneca, Merck and GSK. These declarations of interest have no relationship with the submitted publication. All other authors declare no competing interests.

Figures

Fig. 1
Fig. 1
Epitope stability as a function of antibody positioning in MP1. Line graphs depicting how biomarker detection in low (left) and high (right) immune expressing CRC tissue changes according to the number of HIER cycles preceding antibody application, that is the position of an antibody in a multiplex. Fifteen chromogenic singleplexes were performed on each of the two CRC cases (n = 30). The corresponding images are shown below each graph: position 1 (left), position 3 (middle) and position 5 (right). Images were scanned at 40× magnification and are displayed at 20× magnification (scale bar = 50 µm).
Fig. 2
Fig. 2
Fluorescent singleplex development and comparison to chromogenic singleplex. (A) MP1 Opal‐antibody pairings based on the position, colocalisation and expected abundance of the biomarkers (columns 1–5). Columns 6–8 present the spectral properties of the fluorophores and the last column the fluorophores that qualify for MOTiF scanning. (B) Fluorescent singleplexes (n = 10) were compared to the chromogenic singleplexes (n = 10) previously performed on the same low and high immune expressing CRC tissue. Bar graph demonstrating the percentage of cell positivity for each biomarker in low and high immune expressing CRC tissue when stained with DAB (brown) versus Opal (multicolour) reagents. Statistical significance was determined by the Mann–Whitney U‐test. Difference of > 10% in cell positivity in four cases, marked with an asterisk. (C) ROI of two of these cases is displayed. For each case, the chromogenic stain is seen on the left and fluorescent stain on the right, with the original image above and with cell detection applied below. The CD3 stains are viewed at 20× magnification (scale bar = 50 µm), and the CK stains are seen at 10× magnification (scale bar = 100 µm). In the chromogenic CD3 stain, there are more positive cells (in brown) than there are in the fluorescent CD3 stain (in yellow), which is reflective of the different immune expression profiles that exist between nonserial sections. In the chromogenic CK stain, some DAB‐positive cells are not detected by qupath as being a negative cell (blue) nor a positive cell (red). However, all cells are identified in the fluorescent CK stain as being either negative (grey) or positive (green).
Fig. 3
Fig. 3
Overview of MP1 optimisation. (A) Example images viewed in inform as simulated DAB IHC images (‘pseudo‐DAB’) to show the bleed through issues encountered during MP1 protocol optimisation, in CRC tissue (left) and tonsil tissue (right). Images are displayed at 10× magnification (scale bar = 100 µm) and magnified fields of view (in the black boxes) at 20× magnification (scale bar = 50 µm). Top row: CD20 crosstalk in the CD8 channel. Bottom row: CK crosstalk in the CD8 and CD4 channels. The CK crossover into CD8 is more evident since CD8 was positioned directly after CK in this early MP1 protocol (staining order CD20 > CD3 > CK > CD8 > CD4). (B) Example images of a CRC core stained with a more developed MP1 protocol, following resolution of the bleed through issues. Magnified images of the same core (within the black box) highlight the clean staining obtained for each marker. Images are viewed at 10× magnification (scale bar = 200 µm) and magnified fields of view at 20× magnification (scale bar = 100 µm). All signal intensity counts are within the acceptable range of 20–25 except for CD20 (43.6), but this was resolved in the final protocol. (C) The optimised MP1 protocol with the spectrum of the MOTiF Opals used below. No overlap is seen between the emission peaks. Obtaining the final optimised MP1 protocol required the development of nine protocols and the use of n = 40 tissue sections.
Fig. 4
Fig. 4
Factors considered for DIA. (A) A full‐face CRC section was scanned at 20× and 40× magnification. The same region, viewed at 40× magnification (scale bar = 20 µm), was selected on each scan. The only notable difference is the higher resolution of the 40× scan. (B) Full‐face CRC sections stained with MP1 (n = 5) were scanned using individual and batch exposure times. The scans of one of these samples are shown here at 1.5× magnification (scale bar = 500 µm). Spearman's rank correlation determined that no difference exists in their staining intensities. (C) Two serial full‐face CRC sections were stained, one for MP1 (top row) and one for MP2 (bottom row). The difference in their staining intensities is seen in the left column: CK (green) and CD4 (cyan), which are present in both panels, are more intense in MP2 than in MP1. This originates from the difference in their paraffin section thickness, seen in the right column via the autofluorescence channel: Autofluorescence in MP1 is greater than in MP2 on account of the MP1 section being thicker than the MP2 section. Images are viewed at 5× magnification (scale bar = 250 µm). (D) A colonic core before (top row) and after (bottom row) spectral unmixing in inform. The epithelium is expected to stain green for CK (Opal 480) and not yellow for CD3 (Opal 520). Other MP1 markers seen here are CD20 in red (Opal 570), CD4 in cyan (Opal 620) and CD8 in magenta (Opal 690). Images are viewed at 10× magnification (scale bar = 100 µm).
Fig. 5
Fig. 5
Overview of mIF validation. (A) Nine consecutive sections were cut from a TMA block, of which seven were stained for single antibody DAB IHC and two for mIF. Section 4 stained for MP1 and section 5 stained for MP2. Three right images depict overviews of the TMA layout, a chromogenic TMA and a multiplexed TMA, with tissue annotation and cell detection applied in the latter two. The TMA consists of six normal human tissue types, plus sheep lung tissue for orientation. (B) MP1 validation results. Spearman's rank correlation graphs (top) and Bland–Altman plots (bottom) illustrating the relationship and agreement between DAB detection (from TMAs 1, 2, 3, 6, 7) and singleplex IF detection (from TMA 4), for each biomarker in MP1. The same cores (n = 17) across all the TMAs were used for analysis of the biomarkers. All correlations are strong (r s > 0.9, P < 0.0001) except for CD8, and all biases are within the limits of agreement.
Fig. 6
Fig. 6
Importance of the detection order in digital assessment of MP1. (A) Example images of tonsil core 3 stained with MP1 protocol, seen at 10× magnification (scale bar = 100 µm). Top row shows the original stains: a composite image followed by an image for each individual marker. Middle row illustrates the same composite image to which six different detection orders were applied. From left to right, the accuracy of the detection orders increases. From one order to the next, the biomarker that has been modified is underlined. Bottom row presents the phenotypes identified by each detection order as a percentage of the classified cells. Pie chart colours are in accordance with cell classification colours above. Unclassified cells are indicated in grey. The final detection order (CK > CD4 > CD3 > CD20 > CD8) best represents the original stain visually. (B) Scatter graphs showing the correlation between each multiplex detection order and the singleplex detection of MP1 TMA 4, for each biomarker. The same cores (n = 17) of MP1 TMA 4 were used for analysis of the biomarkers. Statistical significance was measured by Spearman's rank correlation coefficient. The final detection order (purple) best matches the singleplex results quantitatively (r s > 0.9, P < 0.0001 for all the biomarkers).
Fig. 7
Fig. 7
Cell classification in MP1 using a bespoke script. (A) Decision tree visually representing the coding instructions in the script. Unexpected classes are indicated within the black boxes. The original script did not contain these unexpected phenotypes, as opposed to the updated script. TIL, tumour‐infiltrating lymphocyte. (B) Differences in cell classification were only observed in the lymphoid tissue cores (lymph node, spleen and tonsil) (n = 9) when comparing the original script (script 1) and the updated script (script 2). Only a percentage of CD4+ cells that were found in hot immune regions are reclassified by script 2 as CD4+/CD8+ cells. (C) Example displaying the reclassification of these CD4+ cells (cyan) to CD4+/CD8+ cells (orange). Colours are in accordance with the colour‐coded phenotypes of the decision tree. Unclassified cells are indicated in grey. The core shown is of lymph node 3, seen here at 10× magnification (scale bar = 100 µm).

Similar articles

Cited by

References

    1. Maiques O, Georgouli M & Sanz‐Moreno V (2019) Recent advances in tissue imaging for cancer research. F1000Res 8, F1000 Faculty Rev‐1980. - PMC - PubMed
    1. Stack EC, Wang C, Roman KA & Hoyt CC (2014) Multiplexed immunohistochemistry, imaging, and quantitation: a review, with an assessment of tyramide signal amplification, multispectral imaging and multiplex analysis. Methods 70, 46–58. - PubMed
    1. Tóth ZE & Mezey É (2007) Simultaneous visualization of multiple antigens with tyramide signal amplification using antibodies from the same species. J Histochem Cytochem 55, 545–554. - PubMed
    1. Blom S, Paavolainen L, Bychkov D, Turkki R, Mäki‐Teeri P, Hemmes A, Välimäki K, Lundin J, Kallioniemi O & Pellinen T (2017) Systems pathology by multiplexed immunohistochemistry and whole‐slide digital image analysis. Sci Rep 7, 15580. - PMC - PubMed
    1. Lim JCT, Yeong JPS, Lim CJ, Ong CCH, Wong SC, Chew VSP, Ahmed SS, Tan PH & Iqbal J (2018) An automated staining protocol for seven‐colour immunofluorescence of human tissue sections for diagnostic and prognostic use. Pathology 50, 333–341. - PubMed

Publication types