. 2020 Jul 16;15(7):e0209808.
doi: 10.1371/journal.pone.0209808. eCollection 2020.

One hundred years of climate change in Mexico

Affiliations

One hundred years of climate change in Mexico

Angela P Cuervo-Robayo et al. PLoS One. .

Abstract

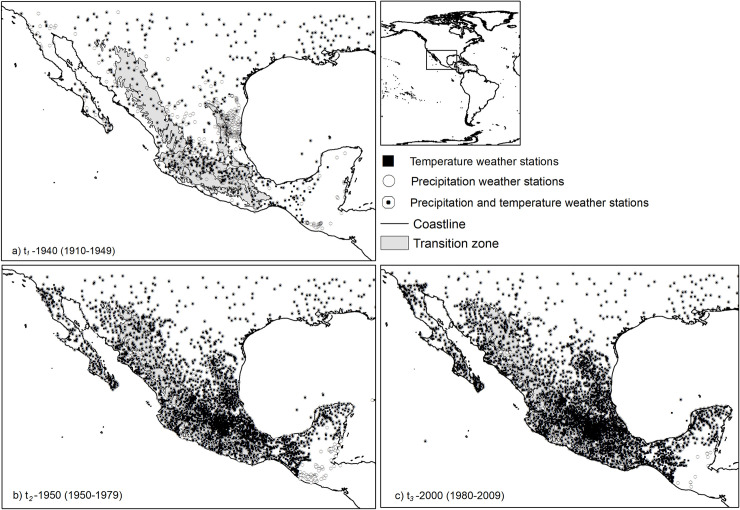
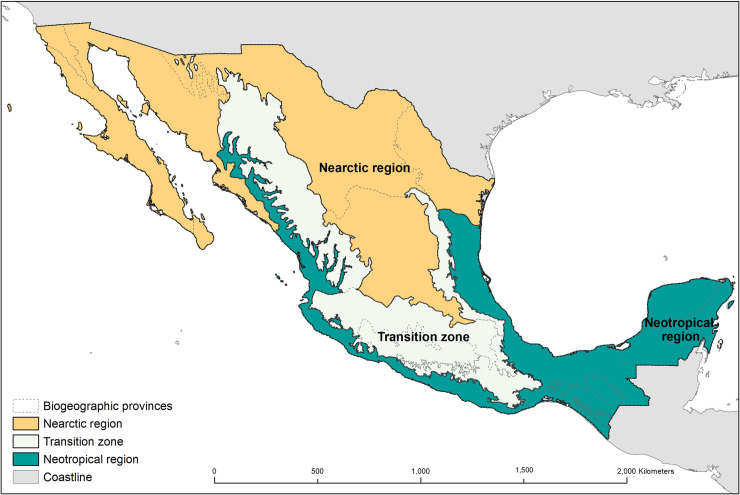
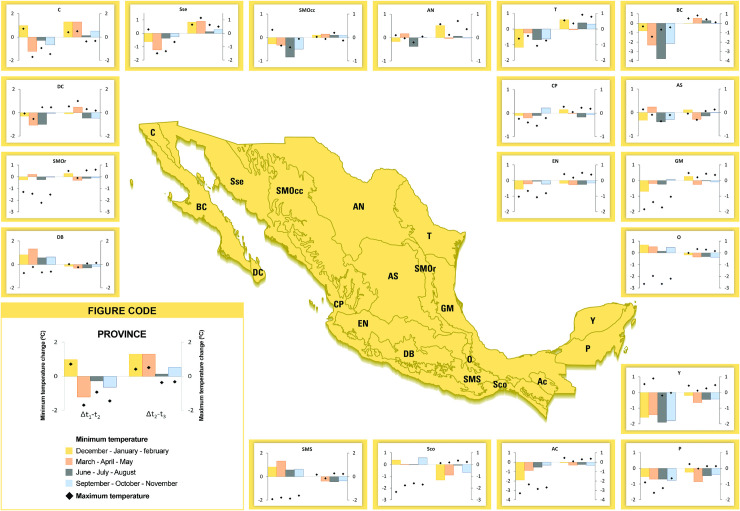
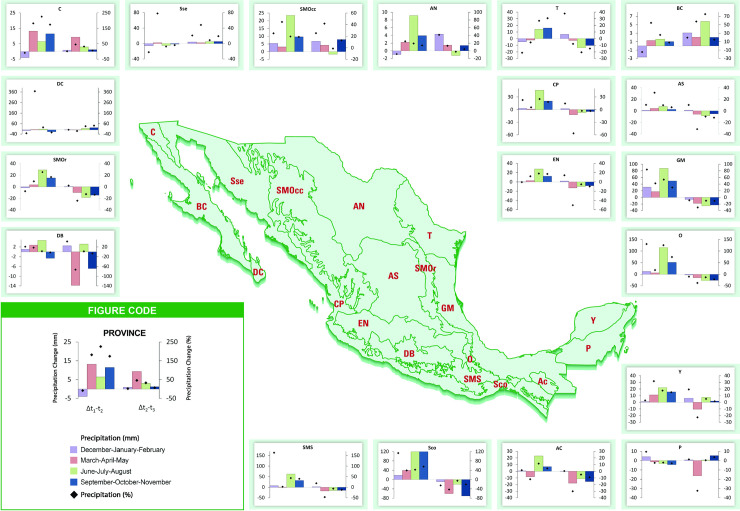
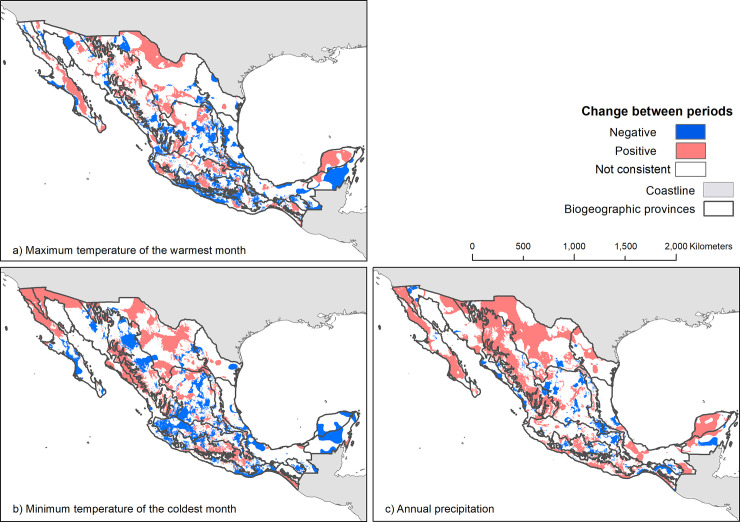
Spatial assessments of historical climate change provide information that can be used by scientists to analyze climate variation over time and evaluate, for example, its effects on biodiversity, in order to focus their research and conservation efforts. Despite the fact that there are global climatic databases available at high spatial resolution, they represent a short temporal window that impedes evaluating historical changes of climate and their impacts on biodiversity. To fill this gap, we developed climate gridded surfaces for Mexico for three periods that cover most of the 20th and early 21st centuries: t1-1940 (1910-1949), t2-1970 (1950-1979) and t3-2000 (1980-2009), and used these interpolated surfaces to describe how climate has changed over time, both countrywide and in its 19 biogeographic provinces. Results from our characterization of climate change indicate that the mean annual temperature has increased by nearly 0.2°C on average across the whole country from t2-1970 to t3-2000. However, changes have not been spatially uniform: Nearctic provinces in the north have suffered higher temperature increases than southern tropical regions. Central and southern provinces cooled at the beginning of the 20th century but warmed consistently since the 1970s. Precipitation increased between t1-1940 and t2-1970 across the country, more notably in the northern provinces, and it decreased between t2-1970 and t3-2000 in most of the country. Results on the historical climate conditions in Mexico may be useful for climate change analyses for both environmental and social sciences. Nonetheless, our climatology was based on information from climate stations for which 9.4-36.2% presented inhomogeneities over time probably owing to non-climatic factors, and climate station density changed over time. Therefore, the estimated changes observed in our analysis need to be interpreted cautiously.


Conflict of interest statement

No authors have competing interests.

Figures

Fig 1
Fig 1
Location of weather stations used to generate climate surfaces of precipitation, maximum and minimum temperature for three periods: a. t1-1940 (1910–1949), b. t2-1970 (1950–1979) and c. t3-2000 (1980–2009). Shaded areas represent mountainous regions above 1500 masl. Stations used were not corrected for inhomogeneities and densities vary between periods and climate variables. For t1-1940 we used 803 stations for precipitation and 500 for temperature, for t2-1970, we used 3411 and 3670 and in t3-2000, 3870 and 4200 for precipitation and temperature, respectively.
Fig 2
Fig 2. Biogeographic regions and provinces of Mexico: Nearctic and Neotropical regions, and the transition zone.
Reprinted from [57] under a CC BY license, with permission from [CONABIO], original copyright [1997].
Fig 3
Fig 3
Seasonal change of maximum (♦) and minimum (bars) temperature from t1-1940 to t2-1970 (Δt1-t2) and from t2-1970 to t3-2000 (Δt2-t3) in the biogeographic provinces of Mexico. Negative values indicate a decrease in temperature from the previous period and positive values indicate an increase. DB: Depresión del Balsas, SMOr: Sierra Madre Oriental, DC: Del Cabo, C: California, Sse: Sonorense, SMOcc: Sierra Madre Occidental; AN: Altiplano Norte, T: Tamaulipeca, BC: Baja California, CP: Costa del Pacífico, AS: Altiplano Sur, EN: Eje Neovolcánico, GM: Golfo de México, O: Oaxaca, Y: Yucatán, P: Petén, AC: Altos de Chiapas, Ssc: Soconusco, and SMS: Sierra Madre del Sur. Stations used were not corrected for inhomogeneities and densities vary between periods, especially between t1-1940 to t2-1970. Biogeographic provinces reprinted from [57] under a CC BY license, with permission from [CONABIO], original copyright [1997].
Fig 4
Fig 4. Seasonal precipitation changes in % (♦) and millimeters (bars) from t1-1940 to t2-1970 (Δt1-t2) and from t2-1970 to t3-2000 (Δt2-t3) in the biogeographic provinces of Mexico.
Negative values indicate a decrease in precipitation from the previous period and positive values indicate an increase. DB: Depresión del Balsas, SMOr: Sierra Madre Oriental, DC: Del Cabo, C: California, Sse: Sonorense, SMOcc: Sierra Madre Occidental; AN: Altiplano Norte, T: Tamaulipeca, BC: Baja California, CP: Costa del Pacífico, AS: Altiplano Sur, EN: Eje Neovolcánico, GM: Golfo de México, O: Oaxaca, Y: Yucatán, P: Petén, AC: Altos de Chiapas, Ssc: Soconusco, and SMS: Sierra Madre del Sur. Stations used were not corrected for inhomogeneities and densities vary between periods, especially between t1-1940 to t2-1970. Biogeographic provinces reprinted from [57] under a CC BY license, with permission from [CONABIO], original copyright [1997].
Fig 5
Fig 5. Climate change in Mexico from t1-1910 to t3-2000.
Negative and positive areas represent downwards and upwards changes, respectively, in annual precipitation (Bio 12), maximum temperature of the warmest month (Bio 05) and minimum temperature of the coldest month (Bio 06). Blue areas indicate negative signs (decrease) for the difference between t1-1940–t2-1970 and t2-1970–t3-2000. Red areas indicate positive signs (increase) for the difference between t1-1940–t2-1970 and t2-1970–t3-2000. White areas indicate that the sign between t1-1940–t2-1970 and t2-1970–t3-2000 were inconsistent. Biogeographic provinces reprinted from [57] under a CC BY license, with permission from [CONABIO], original copyright [1997].

Similar articles

Cited by

References

    1. Sala OE, Chapin FS, Armesto JJ, Berlow E, Bloomfield J, et al. (2000) Global biodiversity scenarios for the year 2100. Science 287: 1770–1774. 10.1126/science.287.5459.1770 - DOI - PubMed
    1. IPCC (2014) Climate change 2014: Impacts, adaptation and vulnerability. Summary for policy makers. 10.1016/j.renene.2009.11.012 - DOI
    1. Thuiller W (2004) Patterns and uncertainties of species' range shifts under climate change. Global change biology 10: 2020–2027. - PMC - PubMed
    1. Thuiller W, Albert C, Araújo MB, Berry PM, Cabeza M, et al. (2008) Predicting global change impacts on plant species´ distributions: Future challenges. Perspectives in Plant Ecology, Evolution and Systematics: 1–16.
    1. Williams J, Jackson S, Kutzbach J (2007) Projected distributions of novel and disappearing climates by 2100 AD. PNAS 104: 5738–5742. 10.1073/pnas.0606292104 - DOI - PMC - PubMed

Publication types