

Case Reports
doi: 10.1161/CIRCIMAGING.120.011222.
Epub 2020 Jul 15.
COVID-19-Associated Stress (Takotsubo) Cardiomyopathy
Affiliations
- PMID: 32673494
- PMCID: PMC7398589
- DOI: 10.1161/CIRCIMAGING.120.011222
Item in Clipboard
Case Reports
COVID-19-Associated Stress (Takotsubo) Cardiomyopathy
Circ Cardiovasc Imaging.
2020 Jul.
No abstract available
Keywords: Takotsubo cardiomyopathy; coronavirus; echocardiography; morbidity; stress cardiomyopathy.
Figures
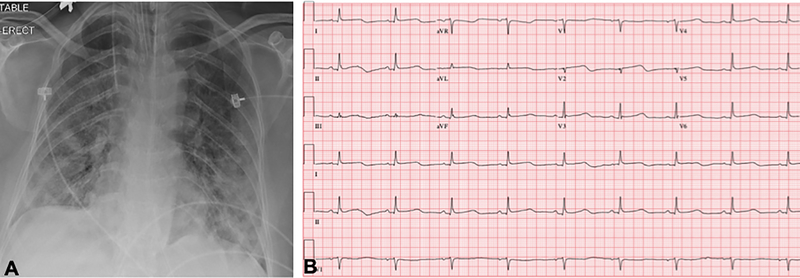
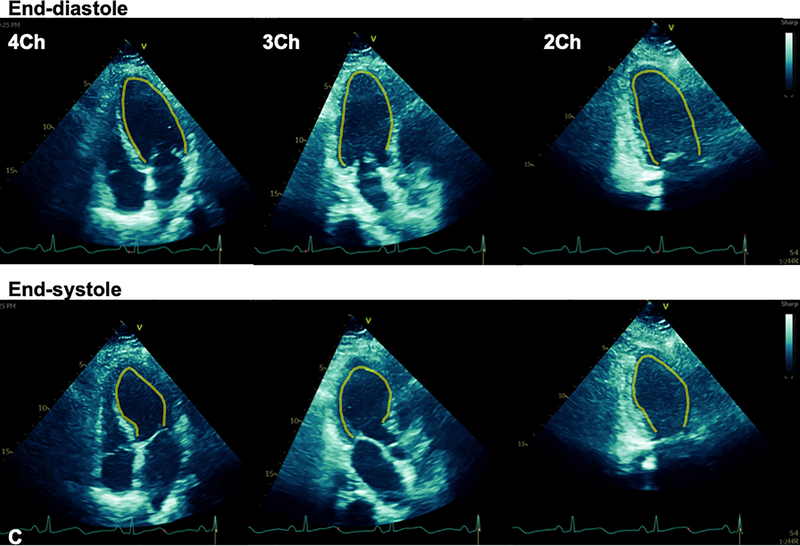
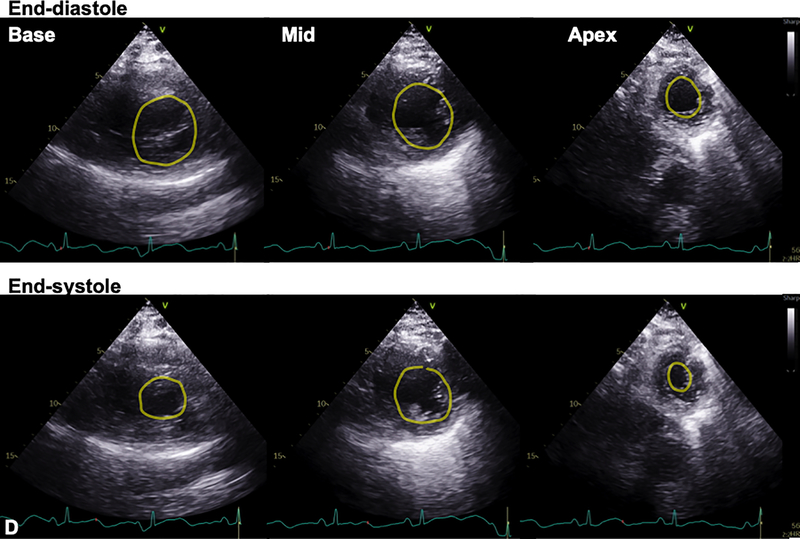
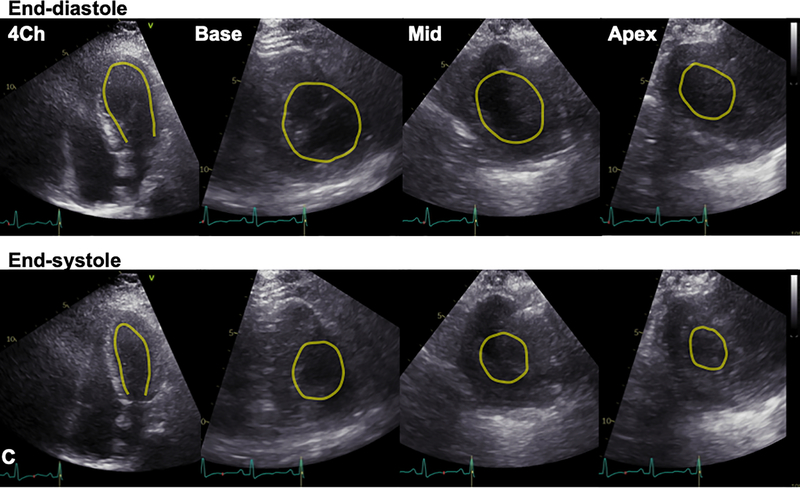
A. Chest x-ray demonstrated diffuse bilateral pulmonary infiltrates. B. 12-lead ECG acquired within the hour of echocardiogram demonstrated slight ST segment elevations. C. Transthoracic echocardiogram (TTE) demonstrated mid-wall hypokinesis of the left ventricular (LV) with normal contractility of the basal and apical segments, and normal right ventricular systolic function (L-R: 4-chamber, 3-chamber, and 2-chamber images; top panel: end-diastole; bottom: end-systole). D. Short axis TTE images demonstrate normal contractility of LV basal and apical segments and hypokinesis of the mid-ventricular segments (L-R: Basal, mid, and apical images; top panel: end-diastole; bottom: end-systole). Yellow contours in C and D outline the LV endocardial borders.
A. Chest x-ray demonstrated diffuse bilateral pulmonary infiltrates. B. 12-lead ECG acquired within the hour of echocardiogram demonstrated slight ST segment elevations. C. Transthoracic echocardiogram (TTE) demonstrated mid-wall hypokinesis of the left ventricular (LV) with normal contractility of the basal and apical segments, and normal right ventricular systolic function (L-R: 4-chamber, 3-chamber, and 2-chamber images; top panel: end-diastole; bottom: end-systole). D. Short axis TTE images demonstrate normal contractility of LV basal and apical segments and hypokinesis of the mid-ventricular segments (L-R: Basal, mid, and apical images; top panel: end-diastole; bottom: end-systole). Yellow contours in C and D outline the LV endocardial borders.
A. Chest x-ray demonstrated diffuse bilateral pulmonary infiltrates. B. 12-lead ECG acquired within the hour of echocardiogram demonstrated slight ST segment elevations. C. Transthoracic echocardiogram (TTE) demonstrated mid-wall hypokinesis of the left ventricular (LV) with normal contractility of the basal and apical segments, and normal right ventricular systolic function (L-R: 4-chamber, 3-chamber, and 2-chamber images; top panel: end-diastole; bottom: end-systole). D. Short axis TTE images demonstrate normal contractility of LV basal and apical segments and hypokinesis of the mid-ventricular segments (L-R: Basal, mid, and apical images; top panel: end-diastole; bottom: end-systole). Yellow contours in C and D outline the LV endocardial borders.
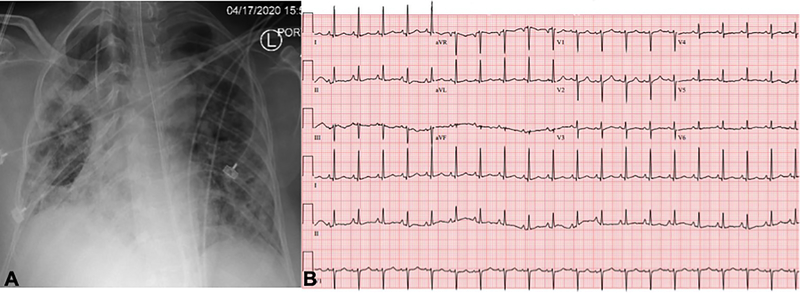
Panels A-C demonstrate data obtained on the day of extubation, 10 days following data in Figure 1. A. CXR continued to demonstrate pulmonary infiltrates. B. ECG abnormalities had normalized compared to prior. C. TTE demonstrated recovery of LV systolic function with resolution of regional dysfunction (L-R: 4-chamber and short-axis basal, mid, and apical images; top panel: end-diastole; bottom: end-systole). Yellow contours outline the LV endocardial borders.
Panels A-C demonstrate data obtained on the day of extubation, 10 days following data in Figure 1. A. CXR continued to demonstrate pulmonary infiltrates. B. ECG abnormalities had normalized compared to prior. C. TTE demonstrated recovery of LV systolic function with resolution of regional dysfunction (L-R: 4-chamber and short-axis basal, mid, and apical images; top panel: end-diastole; bottom: end-systole). Yellow contours outline the LV endocardial borders.
Comment in
-
Letter by Finsterer Regarding Article, "COVID-19-Associated Stress (Takotsubo) Cardiomyopathy".Circ Cardiovasc Imaging. 2020 Oct;13(10):e011577. doi: 10.1161/CIRCIMAGING.120.011577. Epub 2020 Sep 23. Circ Cardiovasc Imaging. 2020. PMID: 32967444 No abstract available.
References
Publication types
MeSH terms
Grants and funding
LinkOut - more resources
Full Text Sources
