. 2020 Sep 25;127(8):1056-1073.
doi: 10.1161/CIRCRESAHA.120.316742. Epub 2020 Jul 15.

JAM-A Acts via C/EBP-α to Promote Claudin-5 Expression and Enhance Endothelial Barrier Function

Affiliations

JAM-A Acts via C/EBP-α to Promote Claudin-5 Expression and Enhance Endothelial Barrier Function

Nikolaos Kakogiannos et al. Circ Res. .

Abstract

Rationale: Intercellular tight junctions are crucial for correct regulation of the endothelial barrier. Their composition and integrity are affected in pathological contexts, such as inflammation and tumor growth. JAM-A (junctional adhesion molecule A) is a transmembrane component of tight junctions with a role in maintenance of endothelial barrier function, although how this is accomplished remains elusive.

Objective: We aimed to understand the molecular mechanisms through which JAM-A expression regulates tight junction organization to control endothelial permeability, with potential implications under pathological conditions.

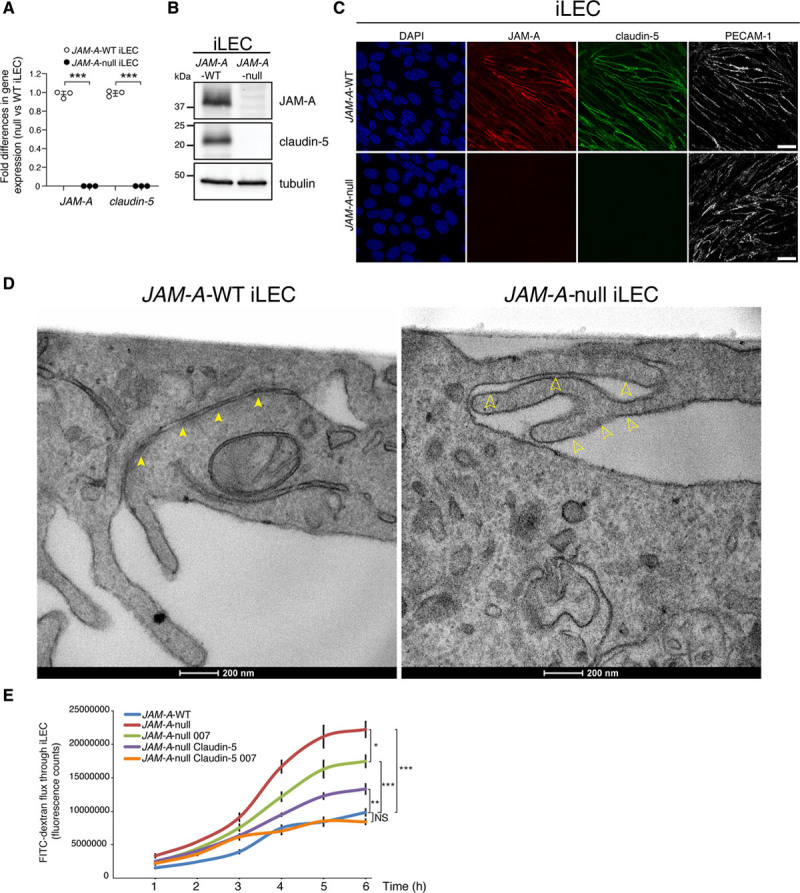
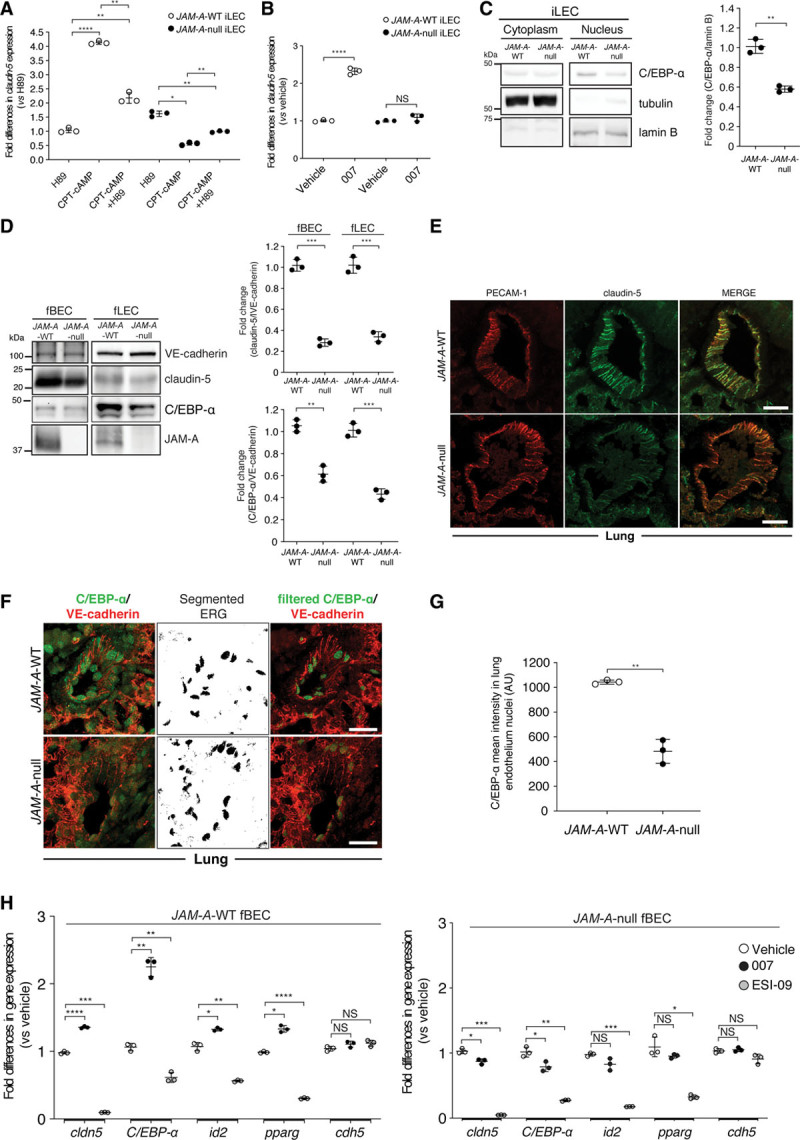
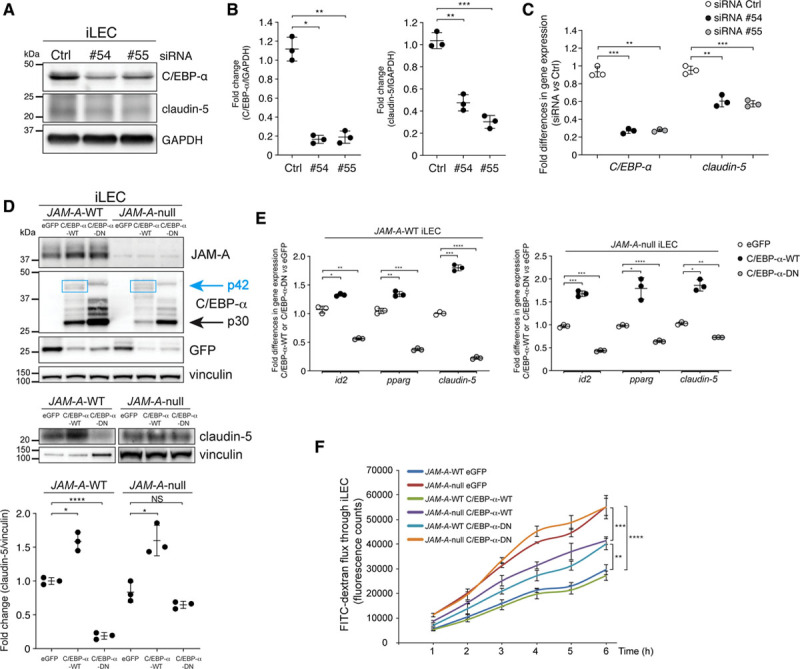
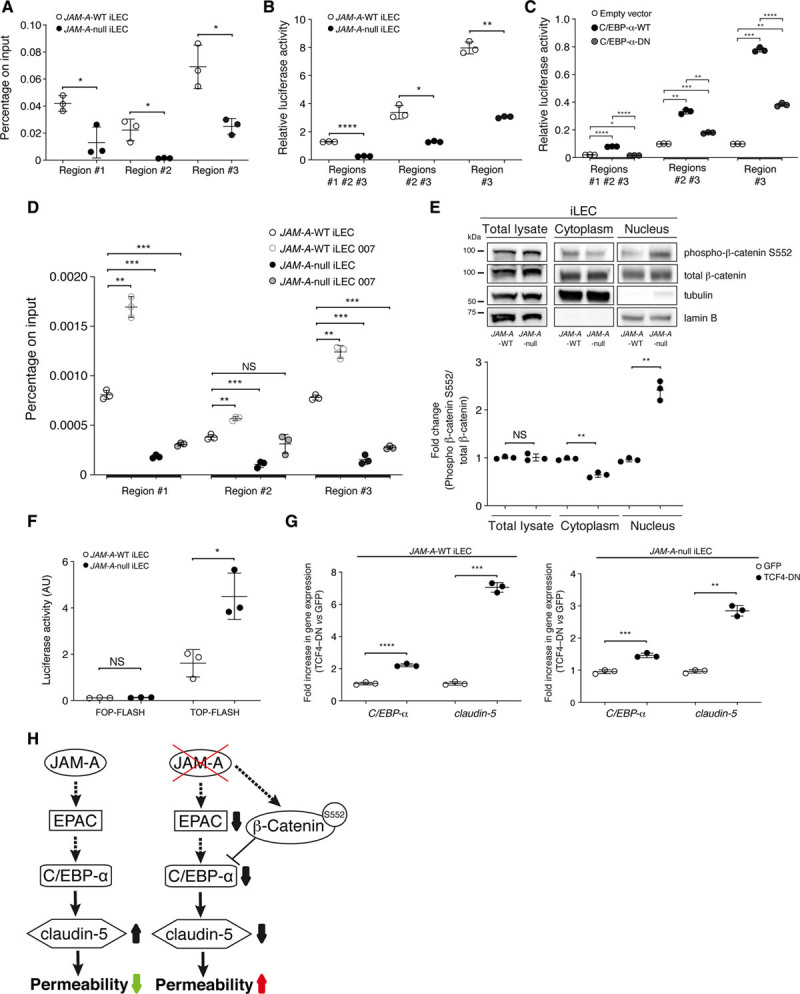
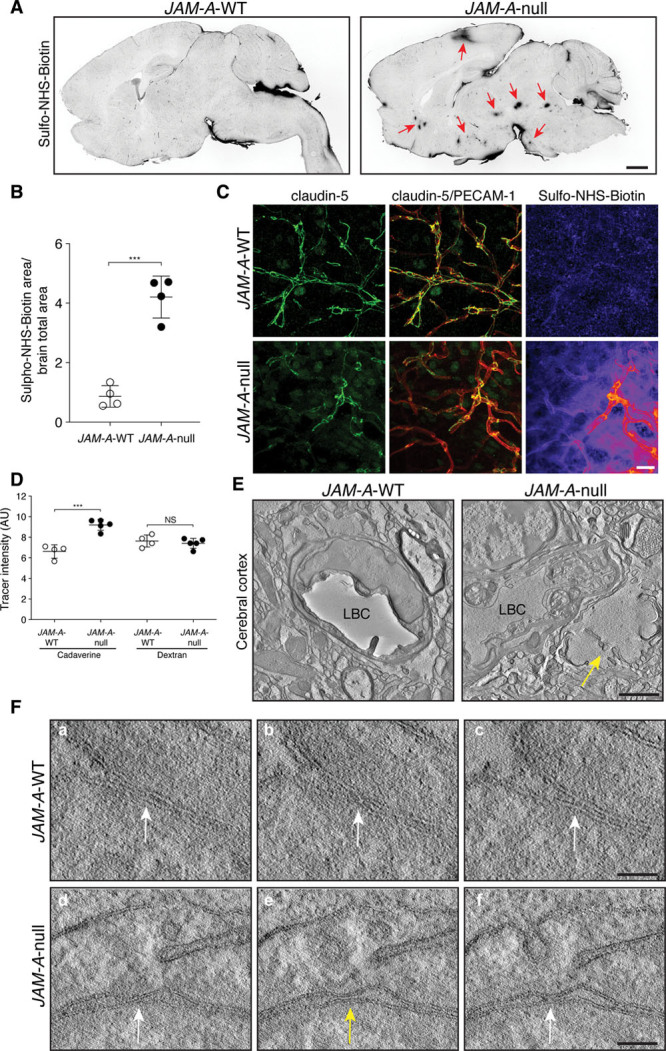
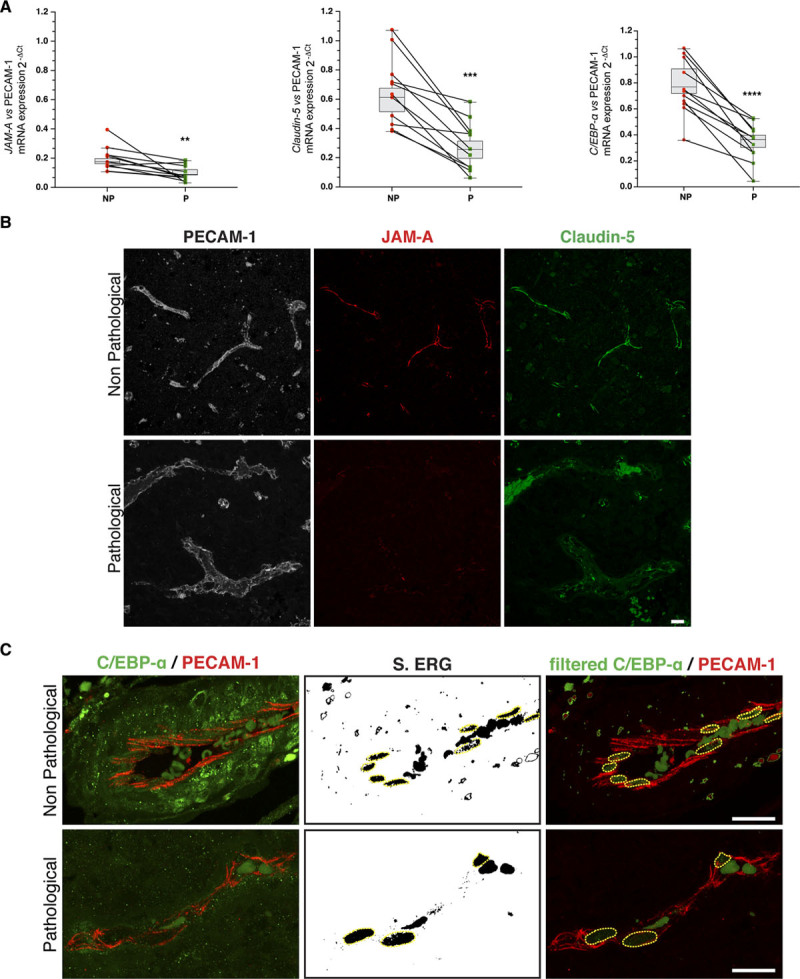
Methods and results: Genetic deletion of JAM-A in mice significantly increased vascular permeability. This was associated with significantly decreased expression of claudin-5 in the vasculature of various tissues, including brain and lung. We observed that C/EBP-α (CCAAT/enhancer-binding protein-α) can act as a transcription factor to trigger the expression of claudin-5 downstream of JAM-A, to thus enhance vascular barrier function. Accordingly, gain-of-function for C/EBP-α increased claudin-5 expression and decreased endothelial permeability, as measured by the passage of fluorescein isothiocyanate (FITC)-dextran through endothelial monolayers. Conversely, C/EBP-α loss-of-function showed the opposite effects of decreased claudin-5 levels and increased endothelial permeability. Mechanistically, JAM-A promoted C/EBP-α expression through suppression of β-catenin transcriptional activity, and also through activation of EPAC (exchange protein directly activated by cAMP). C/EBP-α then directly binds the promoter of claudin-5 to thereby promote its transcription. Finally, JAM-A-C/EBP-α-mediated regulation of claudin-5 was lost in blood vessels from tissue biopsies from patients with glioblastoma and ovarian cancer.

Conclusions: We describe here a novel role for the transcription factor C/EBP-α that is positively modulated by JAM-A, a component of tight junctions that acts through EPAC to up-regulate the expression of claudin-5, to thus decrease endothelial permeability. Overall, these data unravel a regulatory molecular pathway through which tight junctions limit vascular permeability. This will help in the identification of further therapeutic targets for diseases associated with endothelial barrier dysfunction. Graphic Abstract: An graphic abstract is available for this article.

Keywords: claudin-5; endothelium; junctional adhesion molecule A; tight junctions; vascular permeability.


Conflict of interest statement

None.

Figures

Figure 1.
Figure 1.
JAM-A (junctional adhesion molecule A) controls endothelial permeability through regulation of claudin-5 expression and Rap-1 (Ras-related protein-1) activation. A, Quantification of fold-differences in JAM-A and claudin-5 gene expression in immortalized lung endothelial cells (iLECs) from JAM-A–wild-type (WT) and JAM-A–null mice following real-time quantitative polymerase chain reaction analysis. Data are means±SD from 3 independent experiments. P value determined by 2-sided unpaired Welch t test. JAM-A–WT vs JAM-A–null: JAM-A ***P=9.54×10⁻⁷; claudin-5 ***P=4.17×10⁻⁷. B, Representative immunoblotting for JAM-A and claudin-5 JAM-A–WT and JAM-A–null iLECs. Tubulin is shown as the loading control. Data are representative of 3 independent experiments. C, Representative confocal microscopy of JAM-A (red) and claudin-5 (green) expression in JAM-A–WT and JAM-A–null iLECs. PECAM-1 (platelet/endothelial cell adhesion molecule-1; white) is an endothelial junctional marker; DAPI (4′,6-diamidino-2-phenylindole; blue) stains nuclei. Data are representative of 3 independent experiments. Scale bars: 20 µm. D, Representative transmission electron microscopy of JAM-A–WT and JAM-A–null iLECs. Arrows indicate the tight junction strands of the endothelial cells. Scale bars: 200 nm. E, Tracer flux assay. Permeability to fluorescein isothiocyanate (FITC)–dextran of JAM-A–WT and JAM-A–null iLECs and JAM-A–null stably expressing GFP (green fluorescent protein; JAM-A–WT and JAM-A–null) or claudin-5 (JAM-A–null claudin-5) with treatment with vehicle or 8-(4-chlorophenylthio)-2′-O-methyladenosine-3′,5′-cyclic monophosphate (8-pCPT-2′-O-Me-cAMP; 007; 100 µmol/L), to activate Rap-1. Data are means±SEM of triplicates from a single experiment, as representative of 3 independent experiments. P values determined by Brown-Forsythe ANOVA followed by Dunnett T3 test for multiple comparisons. Comparison at 6 h: (overall ****P=5.3×10⁻⁷), JAM-A–WT vs JAM-A–null ***P=3×10⁻⁴; JAM-A–WT vs JAM-A–null 007 ***P=5×10⁻⁴; JAM-A–WT vs JAM-A–null claudin-5 **P=4.3×10⁻³; JAM-A–WT vs JAM-A–null claudin-5 007, P=0.25, not statistically significant [NS]; JAM-A–null vs JAM-A–null 007 *P=0.0117.
Figure 2.
Figure 2.
JAM-A (junctional adhesion molecule A) sustains claudin-5 expression through an EPAC (exchange protein directly activated by cAMP)-dependent mechanism and C/EBP-α (CCAAT/enhancer-binding protein-α) regulation. A and B, Quantification of fold-differences in claudin-5 gene expression in JAM-A–wild-type (WT) and JAM-A–null immortalized lung endothelial cells (iLECs) following real-time quantitative polymerase chain reaction (RT-qPCR) analysis. Cells were treated with vehicle (A and B; fold-difference, 1.0) and the specific PKA (protein kinase A) inhibitor H89 (10 µmol/L), and the PKA and EPAC activator CPT-cAMP (8-(4-chlorophenylthio)adenosine 3′,5′-cyclic monophosphate sodium salt; 250 µmol/L) alone and in combination with H89 (A), or selective EPAC activator 8-(4-chlorophenylthio)-2′-O-methyladenosine-3′,5′-cyclic monophosphate (8-pCPT-2′-O-Me-cAMP; 007; 100 µmol/L; B). Data are means±SD from 3 independent experiments. P values determined by Brown-Forsythe ANOVA followed by Dunnett T3 test for multiple comparisons. JAM-A–WT: (overall ***P=10–4), H89 vs CPT-cAMP ****P=2×10⁻⁵; H89 vs CPT-cAMP +H89 **P=5.6×10⁻³; CPT-cAMP vs CPT-cAMP+H89 **P=7×10⁻³; JAM-A–null: (overall ***P=2.2×10⁻⁴), H89 vs CPT-cAMP *P=1.67×10⁻²; H89 vs CPT-cAMP+H89 **P=2.4×10⁻³; CPT-cAMP vs CPT-cAMP+H89 **P=10–3. B, P values determined by 2-sided unpaired Welch t test. JAM-A–WT: vehicle vs 007 ***P=6×10⁻⁴; JAM-A–null: vehicle vs 007 P=0.23, not statistically significant (NS). C, left, Representative immunoblotting for nuclear/cytoplasm distribution of C/EBP-α in JAM-A–WT and JAM-A–null iLECs. Tubulin and lamin B are shown as cytoplasmic and nuclear markers, respectively. Right, C/EBP-α/lamin B ratio quantified by densitometry scan and expressed as fold changes. Data are means±SD from 3 independent experiments. P value determined by 2-sided unpaired Welch t test. C/EBP-α: JAM-A–WT vs JAM-A–null **P=3.2×10⁻³. D, left, Representative immunoblotting for JAM-A, claudin-5, and C/EBP-α in freshly isolated endothelial cells from brains (fBECs) and lungs (fLECs) of JAM-A–WT and JAM-A–null mice. VE-cadherin (vascular endothelial cadherin) is shown as loading control for endothelial cell numbers. Right, Claudin-5/VE-cadherin and C/EBP-α/VE-cadherin ratios quantified by densitometry scan and expressed as fold changes. Data are means±SD from 3 independent experiments. P values determined by 2-sided unpaired Welch t test. Claudin-5: fBEC, JAM-A–WT vs JAM-A–null ***P=1.2×10⁻⁴; fLEC, JAM-A–WT vs JAM-A–null ***P=5.4×10⁻⁴; C/EBP-α: fBEC, JAM-A–WT vs JAM-A–null **P=1.5×10⁻³; fLEC, JAM-A–WT vs JAM-A–null ***P=2.9×10⁻⁴. E, Representative confocal microscopy for PECAM-1 (platelet/endothelial cell adhesion molecule-1; red) and claudin-5 (green) in paraffin-embedded lung sections from JAM-A–WT and JAM-A–null mice (n=3, JAM-A–WT; n=3, JAM-A–null). Sections were 4 μm thick. Scale bars: 20 µm. F, Representative confocal microscopy for C/EBP-α (green) and VE-cadherin (red) in paraffin-embedded lung sections from JAM-A–WT and JAM-A–null mice. As C/EBP-α was detected in the cytoplasm of the perivascular cells in the lung, ERG (ETS-related gene) staining (nuclear marker) was segmented with threshold 350-4.096 to isolate nuclear C/EBP-α (middle), for merged images of filtered C/EBP-α and VE-cadherin (right). Sections were 4 μm thick. Scale bars: 20 μm (n=3, JAM-A–WT; n=3, JAM-A–null). G, Quantification of nuclear C/EBP-α signal in lung vessels sections from JAM-A–WT and JAM-A–null mice as nuclear C/EBP-α mean fluorescence intensity in 4 sections containing at least 10 nuclei, expressed as arbitrary units (AU); n=3, JAM-A–WT; n=3, JAM-A–null, means±SD. P value determined by 2-sided unpaired Welch t test. JAM-A–WT vs JAM-A–null **P=8.3×10⁻³. H, Quantification of fold-differences for cldn-5, C/EBP-α, id2, pparg, cdh5 expression in JAM-A–WT (left) and JAM-A–null (right) fBECs following RT-qPCR analysis. Cells were treated with vehicle (fold-difference, 1.0), the selective EPAC activator 007 (100 µmol/L), and the specific EPAC inhibitor ESI-09 (10 µmol/L). Data are means±SD from 3 independent experiments (n=12, JAM-A–WT; n=12, JAM-A–null mice; for each experiment). P values determined by Brown-Forsythe ANOVA followed by Dunnett T3 test for multiple comparisons. JAM-A–WT fBECs: cldn-5: (overall ****P=6.3×10⁻⁸), vehicle vs 007 ****P=2.4×10⁻⁵; vehicle vs ESI-09 ***P=2.6×10⁻⁴; C/EBP-α: (overall ***P=1.1×10⁻⁴), vehicle vs 007 **P=1.4×10⁻³; vehicle vs ESI-09 **P=1.9×10⁻³; id2: (overall ***P=6.4×10⁻⁴), vehicle vs 007 *P=1.1×10⁻²; vehicle vs ESI-09 **P=8.4×10⁻³; pparg: (overall ***P=3.4×10⁻⁴), vehicle vs 007 *P=1.1×10⁻²; vehicle vs ESI-09 ****P=2.9×10⁻⁷; cdh5: (overall P=0.12, NS), vehicle vs 007 P=0.21, NS; vehicle vs ESI-09 P=0.13, NS. JAM-A–null fBECs: cldn-5: (overall ****P=5.7×10⁻⁶), vehicle vs 007 *P=1.4×10⁻²; vehicle vs ESI-09 ***P=8.4×10⁻⁴; C/EBP-α: (overall ***P=2.5×10⁻⁴), vehicle vs 007 *P=3.7×10⁻²; vehicle vs ESI-09 **P=5.8×10⁻³; id2: (overall **P=2.6×10⁻³), vehicle vs 007 P=0.17, NS; vehicle vs ESI-09 ***P=6×10⁻⁴; pparg: (overall **P=9.2×10⁻³), vehicle vs 007 P=0.39, NS; vehicle vs ESI-09 *P=2.1×10⁻²; cdh5: (overall P=0.058, NS), vehicle vs 007 P=0.74, NS; vehicle vs ESI-09 P=0.14, NS.
Figure 3.
Figure 3.
C/EBP-α (CCAAT/enhancer-binding protein-α) controls the endothelial barrier through claudin-5 expression. A, left, Representative immunoblotting for C/EBP-α and claudin-5 in immortalized lung endothelial cells (iLECs) transfected with nontargeting small-interfering RNA (siRNA; Ctrl [control]) or with siRNAs against C/EBP-α (no. 54, no. 55). GAPDH is shown as loading control. Right, C/EBP-α/GAPDH and claudin-5/GAPDH ratios quantified by densitometry scanning and expressed as fold changes. Data are means±SD from 3 independent experiments. P values determined by Brown-Forsythe ANOVA followed by Dunnett T3 test for multiple comparisons. C/EBP-α: (overall ***P=5.8×10⁻⁴), siRNA Ctrl vs siRNA no. 54 *P=1×10⁻², siRNA Ctrl vs siRNA no. 55 **P=2.5×10⁻³. Claudin-5: (overall ****P=3.9×10⁻⁵), siRNA Ctrl vs siRNA no. 54 **P=1.3×10⁻³; siRNA Ctrl vs siRNA no. 55 ***P=2.9×10⁻⁴. B, Quantification of fold-differences for C/EBP-α and claudin-5 gene expression in iLECs following real-time quantitative polymerase chain reaction analysis, as shown in A. Cells were treated with nontargeting siRNA (siRNA Ctrl; fold-difference, 1.0) and siRNAs against C/EBP-α (no. 54, no. 55). Data are means±SD from 3 independent experiments. P values determined by Brown-Forsythe ANOVA followed by Dunnett T3 test for multiple comparisons. C/EBP-α: (overall ***P=2.7×10⁻⁴), siRNA Ctrl vs siRNA no. 54 ***P=6.5×10⁻⁴; siRNA Ctrl vs siRNA no. 55 **P=4.4×10⁻³. Claudin-5: (overall ***P=5.1×10⁻⁴), siRNA Ctrl vs siRNA no. 54 **P=2.9×10⁻³; siRNA Ctrl vs siRNA no. 55 ***P=6.3×10⁻⁴. C, Representative immunoblotting for JAM-A (junctional adhesion molecule A), C/EBP-α (upper) and claudin-5 (lower) in JAM-A–wild-type (WT) and JAM-A–null iLECs stably expressing full-length C/EBP-α-WT (p42), C/EBP-α-dominant-negative (DN; p30), and eGFP (enhanced green fluorescent protein) as control. Vinculin is shown as loading control. Upper, Blue boxes highlight bands corresponding to full-length C/EBP-α (p42 isoform). Bottom, 10 μg JAM-A–WT and 80 μg JAM-A–null were loaded. Claudin-5/vinculin ratios quantified by densitometry scanning and expressed as fold changes. Data are means±SD from 3 independent experiments. P values determined by Brown-Forsythe ANOVA followed by Dunnett T3 test for multiple comparisons. JAM-A–WT: (overall ***P=5.5×10⁻⁴), eGFP vs C/EBP-α-WT *P=10-2; eGFP vs C/EBP-α-DN ****P=6.7×10⁻⁵; JAM-A–null: (overall **P=5.2×10⁻³), eGFP vs C/EBP-α-WT *P=2.8×10⁻²; eGFP vs C/EBP-α-DN P=0.27, not statistically significant (NS). D, Quantification of fold-differences for id2, pparg, and claudin-5 gene expression in JAM-A–WT (left) and JAM-A–null (right) iLECs, under stable expression of eGFP (control; fold-difference 1.0) or C/EBP-α-WT or C/EBP-α-DN. Data are means±SD from 3 independent experiments. P values determined by Brown-Forsythe ANOVA followed by Dunnett T3 test for multiple comparisons. JAM-A–WT iLECs: id2: (overall ***P=6.4×10⁻⁴), eGFP vs C/EBP-α-WT *P=1.1×10⁻²; eGFP vs C/EBP-α-DN **P=8.4×10⁻³; pparg: (overall ****P=4.1×10⁻⁶), eGFP vs C/EBP-α-WT **P=2.6×10⁻³; eGFP vs C/EBP-α-DN ***P=3×10⁻⁴; cldn-5: (overall ****P=2.8×10⁻⁶), eGFP vs C/EBP-α-WT ***P=3×10⁻⁴; eGFP vs C/EBP-α-DN ****P=4.6×10⁻⁶. JAM-A–null iLECs: id2: (overall ****P=3.9×10⁻⁵), eGFP vs C/EBP-α-WT ***P=6.6×10⁻⁴; eGFP vs C/EBP-α-DN ***P=2.1×10⁻⁴; pparg: (overall *P=1.5×10⁻²), eGFP vs C/EBP-α-WT *P=4.3×10⁻²; eGFP vs C/EBP-α-DN ****P=5.9×10⁻⁵; cldn-5: (overall **P=2.9×10⁻³), eGFP vs C/EBP-α-WT *P=1.2×10⁻²; eGFP vs C/EBP-α-DN **P=5.9×10⁻³. E, Quantification of permeability to fluorescein isothiocyanate (FITC)–dextran (40 kDa) in JAM-A–WT and JAM-A–null iLECs stably expressing full-length C/EBP-α-WT (p42), C/EBP-α-DN (p30), and eGFP as control. Data are means±SEM of triplicates from a single experiment, representative of 3 independent experiments. P values determined by Brown-Forsythe ANOVA followed by Dunnett T3 test for multiple comparisons. Comparison at 6 h: (overall ****P=7.8×10⁻⁷), JAM-A–WT eGFP vs JAM-A–null eGFP ****P=1.3×10⁻⁵; JAM-A–WT eGFP vs JAM-A–WT C/EBP-α-DN **P=1.7×10⁻³; JAM-A–null eGFP vs JAM-A–null C/EBP-α-DN null ***P=6.9×10⁻⁴.
Figure 4.
Figure 4.
JAM-A (junctional adhesion molecule A) promotes upregulation of claudin-5 expression via C/EBP-α (CCAAT/enhancer-binding protein-α), which is inhibited by active β-catenin. A, Quantification of chromatin immunoprecipitation analysis of C/EBP-α binding to the claudin-5 promoter in JAM-A–wild-type (WT) and JAM-A–null immortalized lung endothelial cells (iLECs; for details see Figure IVA in the Data Supplement). DNA levels were normalized to the input. Data are means±SD of triplicates from a single experiment, as representative of 3 experiments. P values determined by 2-sided unpaired Welch t test. JAM-A–WT vs JAM-A–null: region no. 1 *P=3×10⁻²; region no. 2 *P=4.5×10⁻²; region no. 3 *P=2.9×10⁻². B, Quantification of transcriptional reporter assays in JAM-A–WT and JAM-A–null iLECs under overexpression of luciferase reporters for all 3 C/EBP-α binding site regions of the claudin-5 promoter (region no. 1, no. 2, no. 3), or both region no. 1 and no. 2 (region no. 1 and no. 2), or only region no. 3 (region no. 3; for details see Figure IVB in the Data Supplement). Data are means±SD of triplicates from a single experiment, representative of 3 experiments. P values determined by 2-sided unpaired Welch t test. JAM-A–WT vs JAM-A–null: region no. 1, no. 2, no. 3 ****P=4.9×10⁻⁷; region no. 2 and no. 3 *P=1.6×10⁻²; region no. 3 **P=1.9×10⁻³. C, Quantification of transcriptional reporter assays in HEK-293T cells overexpressing claudin-5 promoter-reporter plasmids (as in B) together with empty vector as control, and full-length C/EBP-α-WT, or C/EBP-α–dominant-negative (DN), as indicated. Data are means±SD of triplicates from a single experiment, as representative of 3 experiments. P values determined by Brown-Forsythe ANOVA followed by Dunnett T3 test for multiple comparisons. Region no. 1, no. 2, and no. 3: (overall ****P=1.8×10⁻⁷), empty vector vs C/EBP-α-WT ****P=3.2×10⁻⁶; empty vector vs C/EBP-α-DN *P=3.2×10⁻²; C/EBP-α-WT vs C/EBP-α-DN ****P=2.2×10⁻⁵; region no. 2 and no. 3: (overall ***P=7×10⁻⁴), empty vector vs C/EBP-α-WT **P=3.3×10⁻³; empty vector vs C/EBP-α-DN ***P=3×10⁻⁴; C/EBP-α-WT vs C/EBP-α-DN **P=8.1×10⁻³; region no. 3: (overall ****P=9.2×10⁻⁷), empty vector vs C/EBP-α-WT ***P=3.7×10⁻⁴; empty vector vs C/EBP-α-DN **P=1.3×10⁻³; C/EBP-α-WT vs C/EBP-α-DN ****P=10-5. D, Quantification of chromatin immunoprecipitation analysis of C/EBP-α binding to the claudin-5 promoter in JAM-A–WT and JAM-A–null iLECs treated with vehicle as control, or with 8-(4-chlorophenylthio)-2′-O-methyladenosine-3′,5′-cyclic monophosphate (8-pCPT-2′-O-Me-cAMP; 007). DNA levels were normalized to the input. Data are means±SD of triplicates from a single experiment, representative of 3 experiments. P values determined by Brown-Forsythe ANOVA followed by Dunnett T3 test for multiple comparisons. Region no. 1: (overall ***P=2.1×10⁻⁴), JAM-A–WT vs JAM-A–WT 007 **P=2.1×10⁻³; JAM-A–WT vs JAM-A–null ***P=4.8×10⁻⁴; JAM-A–WT vs JAM-A–null 007 ***P=9.3×10⁻⁴; region no. 2: (overall **P=7.4×10⁻³), JAM-A–WT vs JAM-A–WT 007 **P=1.5×10⁻³; JAM-A–WT vs JAM-A–null ***P=8.7×10⁻³; JAM-A–WT vs JAM-A–null 007 P=0.64, not statistically significant (NS); region no. 3: (overall ****P=4×10⁻⁶), JAM-A–WT vs JAM-A–WT 007 **P=3.2×10⁻³; JAM-A–WT vs JAM-A–null ***P=5.8×10⁻⁴; JAM-A–WT vs JAM-A–null 007 ***P=2.1×10⁻⁴. E, Representative immunoblotting for total lysate, cytoplasm and nuclear distribution of total and active β-catenin S552 (phosphor-β-catenin) in JAM-A–WT and JAM-A–null iLECs. Tubulin and lamin B are shown as cytoplasmic and nuclear markers, respectively. Bottom, phospho-β-catenin S552/total- β-catenin ratios quantified by densitometry scan and expressed as fold changes. Data are means±SD from 3 independent experiments. P values determined by 2-sided unpaired Welch t test. Total lysate: JAM-A–WT and JAM-A–null, P=0.94, NS; cytoplasm: JAM-A–WT and JAM-A–null **P=3×10⁻³; nucleus: JAM-A–WT and JAM-A–null **P=4.9×10⁻³. F, Quantification of transcriptional activity of TCF (T-cell-factor)–β-catenin in JAM-A–WT and JAM-A–null iLECs underexpression of TOP-FLASH or FOP-FLASH constructs. Data are means±SD from 3 independent experiments. P values determined by 2-sided unpaired Welch t test. JAM-A–WT and JAM-A–null: FOP-FLASH P=0.38, NS; TOP-FLASH, *P=1.9×10⁻². G, Quantification of fold-differences of C/EBP-α and claudin-5 gene expression in JAM-A–WT (left) and JAM-A–null (right) iLECs, underexpression of GFP (green fluorescent protein) or TCF4-DN. Data are means±SD from 3 independent experiments. P values determined by 2-sided unpaired Welch t test. C/EBP-α: JAM-A–WT: GFP vs TCF4-DN ****P=8.6×10⁻⁶; claudin-5: JAM-A–WT: GFP vs TCF4-DN ***P=2.3×10⁻⁴; JAM-A–null: GFP vs TCF4-DN ***P=7.1×10⁻⁴; claudin-5: JAM-A–null: GFP vs TCF4-DN **P=10–3. H, Schematic model of JAM-A signaling in the regulation of vascular permeability. Full arrows, direct effects on downstream targets; dashed arrows, regulation of downstream targets (eg, mRNA, protein expression or activity). The molecular mechanisms of this regulatory pathway remain to be defined. AU indicates arbitrary units; and EPAC, exchange protein directly activated by cAMP.
Figure 5.
Figure 5.
Endothelial permeability is increased in vivo by JAM-A (junctional adhesion molecule A) deficiency in areas of decreased claudin-5. A, Representative confocal microscopy for streptavidin to detect sulpho–N-hydroxysuccinimide–biotin (sulpho-NHS-biotin) leakage in vibratome brain sections (100 μm) from JAM-A–wild-type (WT) and JAM-A–null mice. Red arrows (right) indicate foci of leakage in different brain regions. Scale bar: 1 mm (n=3, JAM-A–WT; n=3, JAM-A–null). B, Quantification of sulpho-NHS-biotin leakage in JAM-A–WT and JAM-A–null mice brain sections, as shown in A. Data are means±SD, as ratio of sulpho-NHS-biotin area/brain total area (n=4, JAM-A–WT; n=4, JAM-A–null mice). P value determined by 2-sided unpaired Welch t test. JAM-A–WT vs JAM-A–null ***P=6.4×10⁻⁴. C, Representative confocal microscopy for claudin-5 (green), PECAM-1 (platelet/endothelial cell adhesion molecule-1; red), and streptavidin, for sulpho-NHS-biotin leakage (pseudocolor) in brain sections from JAM-A–WT and JAM-A–null mice. Scale bar: 20 µm (n=3, JAM-A–WT; n=3, JAM-A–null). D, Quantification of cadaverine and dextran leakage in JAM-A–WT and JAM-A–null mice brain sections. Data are means±SD, measured as relative intensities (arbitrary units; AU; n=4, JAM-A–WT; n=5, JAM-A–null mice). P values determined by 2-sided unpaired Welch t test. JAM-A–WT vs JAM-A–null: cadaverine ***P=7.9×10⁻⁴; dextran P=0.56, not statistically significant (NS). E, Representative transmission electron microscopy of cerebral cortex from JAM-A–WT and JAM-A–null mice. Arrow denotes locus of edema. Scale bar: 1200 nm (n=3, JAM-A–WT; n=3, JAM-A–null). F, Representative 2-step transmission electron microscopy tomography of cerebral cortex from JAM-A–WT (a–c) and JAM-A–null mice (d–f). Parts (a–c) and (d–f) are 3 consecutive serial tomography sections showing a tight junction strand. White arrows, tight junction that appears as the translucent area (osmiophobic channel) between 2 plasma membranes; yellow arrow; interruption along the pale strand channel. Scale bars (a–c): 80 nm; (d–f) 90 nm (n=3, JAM-A–WT; n=3, JAM-A–null). LBC indicates lumen of brain capillary.
Figure 6.
Figure 6.
JAM-A (junctional adhesion molecule A) positively regulates claudin-5 and C/EBP-α (CCAAT/enhancer-binding protein-α) expression in glioblastoma multiforme. A, Quantification of JAM-A, claudin-5, and C/EBP-α expression in tissue biopsies from 11 patients with grade IV glioblastoma multiforme (GBM) following real-time quantitative polymerase chain reaction analysis. mRNA expression for each gene was normalized to PECAM-1 (platelet/endothelial cell adhesion molecule-1). The lines link values between GBM and patient-matched healthy tissues. P values determined by 2-sided paired t test. Non-pathological (NP) vs pathological (P): JAM-A **P=6.8×10⁻³; claudin-5 ***P=1.3×10⁻⁴; C/EBP-α ****P=2.1×10⁻⁵. B, Representative confocal microscopy for PECAM-1 (white), JAM-A (red), and claudin-5 (green) in paraffin-embedded tissue sections (4 µm) from GBM and patient-matched healthy tissue. Images are representative of 11 patients. Scale bars: 20 µm. C, Representative confocal microscopy for C/EBP-α (green) and PECAM-1 (red) in paraffin-embedded tissue sections (4 μm) from GBM and patient-matched healthy tissue. ERG (ETS-related gene) staining was segmented with threshold 350-4.096 (S. ERG) for merged images of filtered C/EBP-α and PECAM-1 (filtered C/EBP-α PECAM-1). Yellow dashed circles outline ERG-positive nuclei to exclude signals belonging to circulating cells. Scale bars: 20 µm.

References

    1. Mehta D, Malik AB. Signaling mechanisms regulating endothelial permeability. Physiol Rev. 2006;86:279–367. doi: 10.1152/physrev.00012.2005 - PubMed
    1. Nelson WJ. Regulation of cell-cell adhesion by the cadherin-catenin complex. Biochem Soc Trans. 2008;36:149–155. doi: 10.1042/BST0360149 - PMC - PubMed
    1. Dejana E. Endothelial cell-cell junctions: happy together. Nat Rev Mol Cell Biol. 2004;5:261–270. doi: 10.1038/nrm1357 - PubMed
    1. Bazzoni G, Dejana E. Endothelial cell-to-cell junctions: molecular organization and role in vascular homeostasis. Physiol Rev. 2004;84:869–901. doi: 10.1152/physrev.00035.2003 - PubMed
    1. Lampugnani MG. Endothelial cell-to-cell junctions: adhesion and signaling in physiology and pathology. Cold Spring Harb Perspect Med. 2012;2:a006528. - PMC - PubMed

Publication types

MeSH terms