Comparative Study
. 2020 Sep;40(9):2265-2278.
doi: 10.1161/ATVBAHA.120.314883. Epub 2020 Jul 16.

Neutrophil Extracellular Trap Degradation by Differently Polarized Macrophage Subsets

Affiliations
Comparative Study

Neutrophil Extracellular Trap Degradation by Differently Polarized Macrophage Subsets

Patrick Haider et al. Arterioscler Thromb Vasc Biol. 2020 Sep.

Abstract

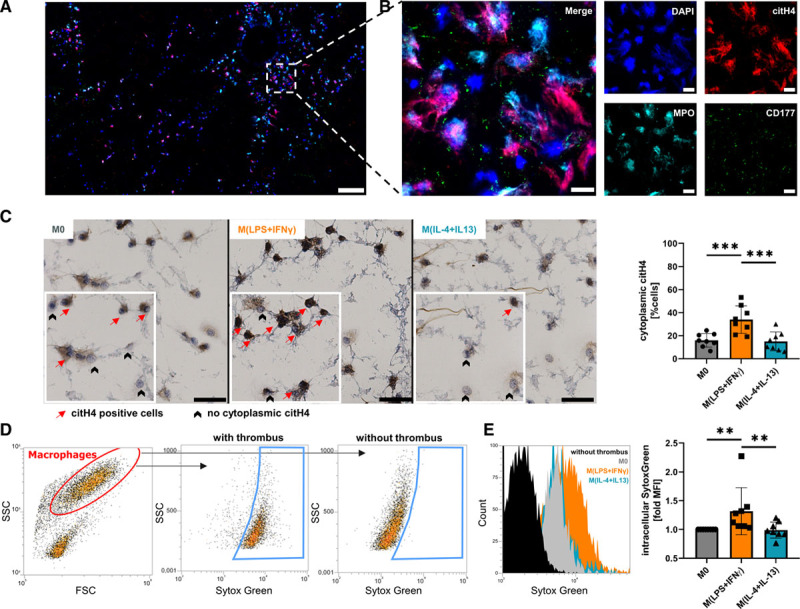
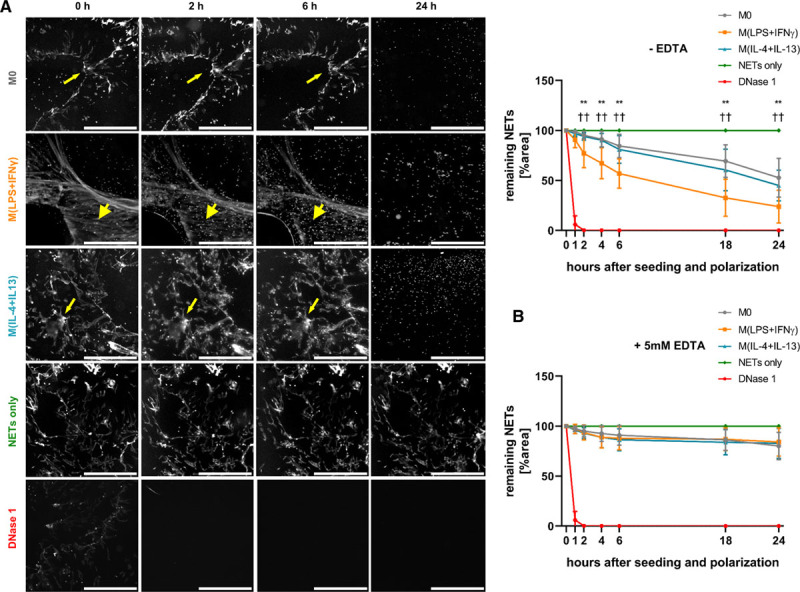
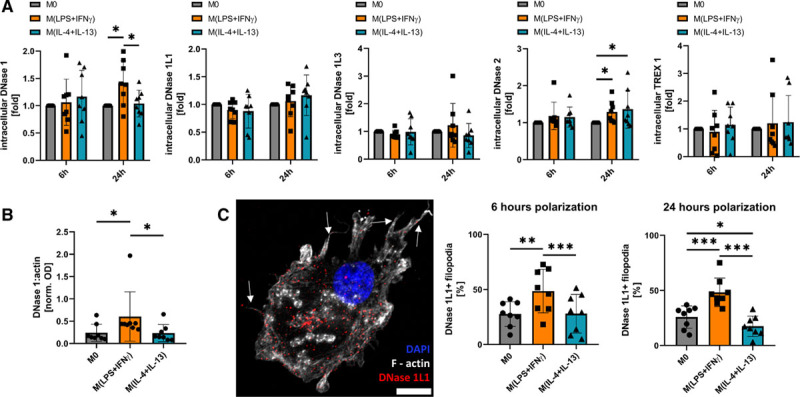
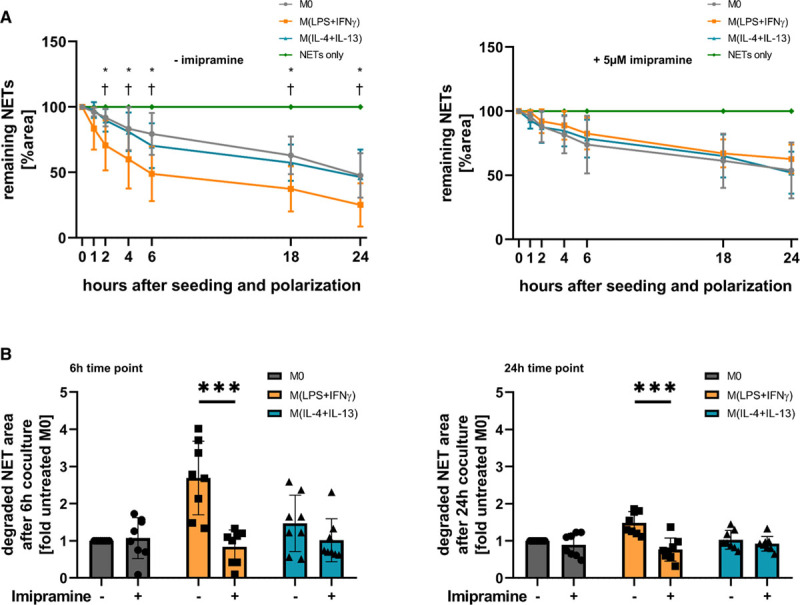
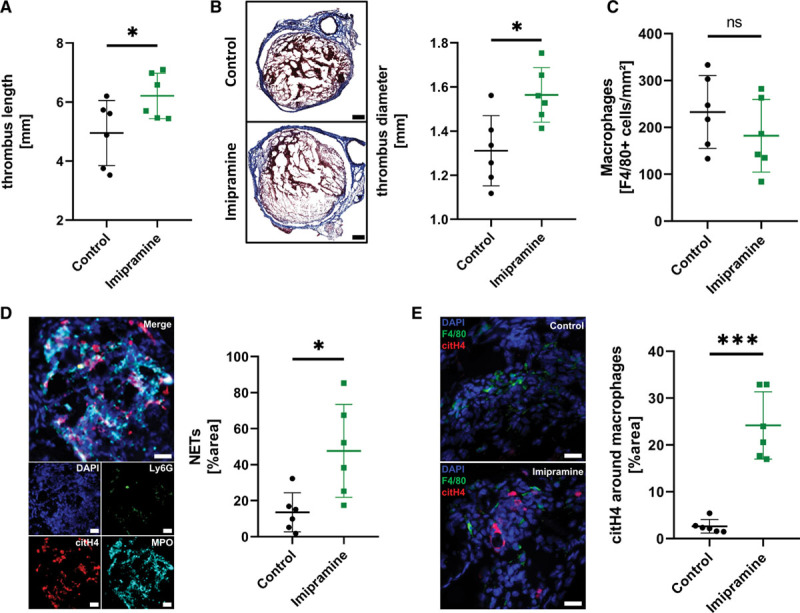
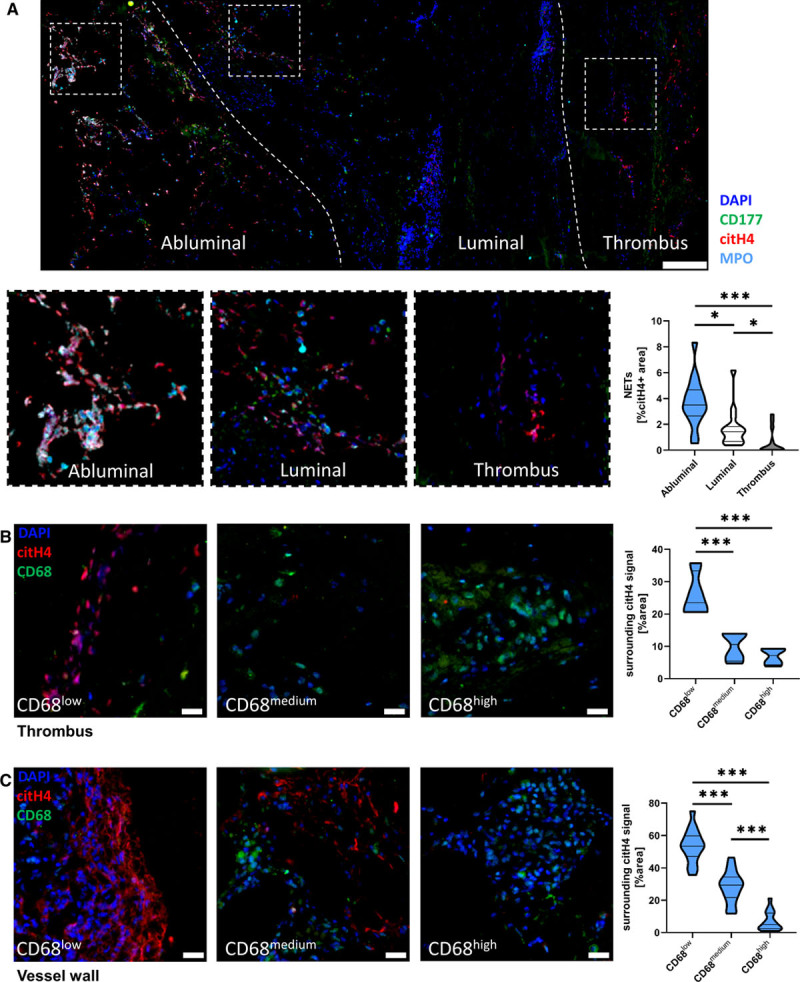
Objective: Macrophages are immune cells, capable to remodel the extracellular matrix, which can harbor extracellular DNA incorporated into neutrophil extracellular traps (NETs). To study the breakdown of NETs we studied the capability of macrophage subsets to degrade these structures in vitro and in vivo in a murine thrombosis model. Furthermore, we analyzed human abdominal aortic aneurysm samples in support of our in vitro and in vivo results. Approach and Results: Macrophages were seeded onto blood clots or isolated NETs and polarized. All macrophages were capable to degrade NETs. For initial breakdown, macrophages relied on extracellular deoxyribonucleases. Proinflammatory polarization enhanced NET degradation. The boost in degradation was because of increased macropinocytosis, as inhibition by imipramine diminished their NET breakdown. Inhibition of macropinocytosis in a murine thrombosis model led to increased NET burden and reduced thrombus resolution in vivo. When analyzing abdominal aortic aneurysm samples, macrophage density furthermore corresponded negatively with the amount of local NETs in the intraluminal thrombi as well as in the vessel wall, as increased macrophage density was associated with a reduction in NET burden.

Conclusions: We provide evidence that macrophages degrade NETs by extracellular predigestion and subsequent uptake. Furthermore, we show that proinflammatory macrophages increase NET degradation through enhanced macropinocytosis, priming them for NET engulfment. Based on our findings, that inhibition of macropinocytosis in mice corresponded to increased NET amounts in thrombi and that local macrophage density in human abdominal aortic aneurysm is negatively associated with surrounding NETs, we hypothesize, that macrophages are able to degrade NETs in vivo.

Keywords: aortic aneurysm; extracellular traps; humans; macrophages; thrombosis.


Conflict of interest statement

None.

Figures

Figure 1.
Figure 1.
Macrophages take up DNA and neutrophil extracellular traps (NETs) from in vitro generated blood clots. A, Spontaneous NET formation was visualized by immunofluorescent staining of citrullinated histone 4 (citH4), myeloperoxidase (MPO), and CD177 (×20 magnification, scale bar 200 μm). B, Magnification of the marked area in (A; scale bar 20 μm). C, Macrophage subsets were seeded onto blood clots, and cytoplasmic citH4 was quantified after 2 h by immunohistochemical staining. A zoomed area from each picture is shown in the canvas. Data represent mean±SD (×20 magnification, scale bar 50 μm; n=8, D’Agostino-Pearson test, 1-way ANOVA with Benjamini-Krieger-Yekutieli false discovery rate). D, Differently polarized macrophages were incubated for 2 h on SytoxGreen-labeled clots, and DNA uptake was analyzed by fluorescence-activated cell sorting. Representative fluorescence-activated cell sorting plot of DNA uptake. E, Quantification of D. An overlay of histograms is shown left. Data represent mean±SD of fold change to M0 (n=8, D’Agostino-Pearson test, Friedman test for non-normally distributed paired data with Benjamini-Krieger-Yekutieli false discovery rate). **P<0.01 and ***P<0.001.
Figure 2.
Figure 2.
Degradation of in vitro generated neutrophil extracellular traps (NETs) by differently polarized macrophages. A, NETs were generated in vitro and labeled fluorescently, 1×10⁴ macrophages were seeded onto the NET layer, polarized and the extent of remaining NETs was quantified at different time points. Values are given in percent remaining NET area in comparison to time point 0 and are normalized towards a control without cells (NETs only). Four mU/mL deoxyribonuclease (DNase) 1 was used as positive control and added at time point 0. M(lipopolysaccharide [LPS]+IFN [interferon]-γ) significantly faster degraded the NET layer (thick arrowheads) compared with the other 2 subsets, which did not differ in their NET degradation capacity (thin arrowheads; ×2.5 magnification, scale bar 50 μm). Data represent mean±SD (n=8, 2-way ANOVA for different time points with Benjamini-Krieger-Yekutieli false discovery rate). B, NETs were generated as in A and 1×10⁴ macrophages were seeded in the presence of 5 mmol/L EDTA onto them, polarized and remaining NETs were quantified as in A (scale bar 50 μm). Data represent mean±SD (n=8) **P<0.01 between M0 and M(lipopolysaccharide [LPS]+IFN-γ); ††P<0.01 between M(lipopolysaccharide [LPS]+IFN-γ) and M(IL-4+IL-13).
Figure 3.
Figure 3.
Characterization of intracellular deoxyribonucleases (DNases). A, Intracellular DNases in polarized macrophages were quantified as described in the Materials and Methods section. Data are given as fold compared with M0 and represent mean±SD (n=8, 2-way ANOVA for different time points with Benjamini-Krieger-Yekutieli false discovery rate). B, Intracellular DNase 1:actin complexes were analyzed by a custom-made ELISA. Data are given as normalized OD of each sample and represent mean±SD (n=8, D’Agostino-Pearson test, Friedman test for non-normally distributed paired values with Benjamini-Krieger-Yekutieli false discovery rate). C, Fluorescence microscopy of surface DNase 1L1 in macrophages polarized for 6 or 24 h. On the left side, a representative picture of a 6 h polarized M(lipopolysaccharide [LPS]+IFN [interferon]-γ) macrophage is shown with arrows pointing to DNase 1L1 positive filopodia. Data are expressed as percent DNase 1L1 positive filopodia and represent mean±SD (×63 magnification, scale bar 10 μm; n=8, D’Agostino-Pearson test, 1-way ANOVA with Benjamini-Krieger-Yekutieli false discovery rate). *P<0.05, **P<0.01, and ***P<0.001.
Figure 4.
Figure 4.
Increased neutrophil extracellular trap (NET) degradation by M(lipopolysaccharide [LPS]+IFN [interferon]-γ) is dependent on macropinocytosis. A, Macrophages were either untreated (left) or treated with 5 μmol/L imipramine (right) for 30 min, seeded onto a NET layer and polarized. Degradation was measured at the indicated time points after seeding and the extent of remaining NETs was quantified at these time points. Values are given in percent remaining NET area in comparison to time point 0, normalized towards a control without cells (NETs only). Data represent mean±SD (n=8, 2-way ANOVA with Benjamini-Krieger-Yekutieli false discovery rate) *P<0.05 between M0 and M(lipopolysaccharide [LPS]+IFN-γ); †P<0.05 between M(lipopolysaccharide [LPS]+IFN-γ) and M(IL-4+IL-13). B, The remaining NET area at 6 and 24 h is shown from the experiment in A, and data are plotted for each donor as fold to untreated M0 macrophages (n=8, 2-way ANOVA with Benjamini-Krieger-Yekutieli false discovery rate). ***P<0.001.
Figure 5.
Figure 5.
Inhibition of macropinocytosis in an in vivo murine thrombosis model leads to increased thrombus neutrophil extracellular trap (NET) burden and reduced thrombus resolution. A, Thrombus length was assessed using a caliper. B, Frozen sections were stained using Masson Trichrome staining. The maximum diameter was measured using a virtual caliper built into the TissueFAXS software. A representative comparison is shown on the left side (×20 magnification, scale bar 200 μm). C, Macrophage density was quantified by fluorescence staining using an anti-F4/80 antibody. F4/80+ cells were measured using FIJI and cells per mm2 were calculated. D, NETs were identified by fluorescence staining in sections of the thrombi using citrullinated histone 4 (citH4), myeloperoxidase (MPO), Ly6G and DAPI. A representative image of NETs is shown on the left side (×20 magnification, scale bar 20 μm). E, CitH4 was measured in macrophage-rich areas. A representative comparison of the 2 groups is shown on the left side (×20 magnification, scale bar 20 μm). For all subfigures: Data are given as mean±SD (n=6 per group, Shapiro-Wilk test, unpaired t test) ns indicates not significant, *P<0.05, ***P<0.001.
Figure 6.
Figure 6.
Local macrophage density is inversely associated with surrounding neutrophil extracellular trap (NET) amount in the thrombus and vessel wall of human abdominal aortic aneurysm (AAA). A, NETs in AAA samples were stained by immunofluorescence against citrullinated histone 4 (citH4), myeloperoxidase (MPO), CD177, and DAPI. The left dashed line represents the approximate border between abluminal and luminal parts of the vessel wall, the right dashed line between the vessel wall and intraluminal thrombus (×20 magnification, scale bar 1 mm). Relative NET area was quantified as citH4+ areas. Data are given as percent citH4+ and are shown as violin plot of 16 patients for abluminal and luminal data and of 14 patients for the thrombi (D’Agostino-Pearson test, Kruskal-Wallis test with Benjamini-Krieger-Yekutieli false discovery rate). B, In thrombi with detectable NETs (>0.1% citH4), nine 200×200 μm sized regions of interest (ROIs) of the thrombus per patient were analyzed for their macrophage density and divided into CD68low, CD68medium, and CD68high areas. The relative citH4+ area was calculated in each ROI with FIJI. Data are represented as violin plot (scale bar 20 μm; n=4, Shapiro-Wilk test, 1-way ANOVA with Benjamini-Krieger-Yekutieli false discovery rate). C, Nine 200×200 μm sized ROIs of the abluminal part of the vessel wall per patient were analyzed for their macrophage density and divided into CD68low, CD68medium, and CD68high areas. The relative citH4+ area was calculated in each ROI with FIJI. Data are represented as violin plot (scale bar 20 μm; n=16, D’Agostino-Pearson test, 1-way ANOVA with Benjamini-Krieger-Yekutieli false discovery rate). *P<0.05 and ***P<0.001.

Comment in

References

    1. Watanabe S, Alexander M, Misharin AV, Budinger GRS. The role of macrophages in the resolution of inflammation. J Clin Invest 20191292619–2628doi: 10.1172/JCI124615 - PMC - PubMed
    1. Murray PJ. Macrophage polarization. Annu Rev Physiol 201779541–566doi: 10.1146/annurev-physiol-022516-034339 - PubMed
    1. Mantovani A, Biswas SK, Galdiero MR, Sica A, Locati M. Macrophage plasticity and polarization in tissue repair and remodelling. J Pathol 2013229176–185doi: 10.1002/path.4133 - PubMed
    1. Lim W, Gee K, Mishra S, Kumar A. Regulation of B7.1 costimulatory molecule is mediated by the IFN regulatory factor-7 through the activation of JNK in lipopolysaccharide-stimulated human monocytic cells. J Immunol 20051755690–5700doi: 10.4049/jimmunol.175.9.5690 - PubMed
    1. Gordon S, Plüddemann A. Tissue macrophages: heterogeneity and functions. BMC Biol. 2017;15:53. - PMC - PubMed

Publication types

MeSH terms