Meta-Analysis of Leukocyte Diversity in Atherosclerotic Mouse Aortas
- PMID: 32673538
- PMCID: PMC7371244
- DOI: 10.1161/CIRCRESAHA.120.316903
Meta-Analysis of Leukocyte Diversity in Atherosclerotic Mouse Aortas
Abstract
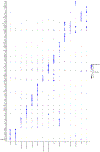
The diverse leukocyte infiltrate in atherosclerotic mouse aortas was recently analyzed in 9 single-cell RNA sequencing and 2 mass cytometry studies. In a comprehensive meta-analysis, we confirm 4 known macrophage subsets-resident, inflammatory, interferon-inducible cell, and Trem2 (triggering receptor expressed on myeloid cells-2) foamy macrophages-and identify a new macrophage subset resembling cavity macrophages. We also find that monocytes, neutrophils, dendritic cells, natural killer cells, innate lymphoid cells-2, and CD (cluster of differentiation)-8 T cells form prominent and separate immune cell populations in atherosclerotic aortas. Many CD4 T cells express IL (interleukin)-17 and the chemokine receptor CXCR (C-X-C chemokine receptor)-6. A small number of regulatory T cells and T helper 1 cells is also identified. Immature and naive T cells are present in both healthy and atherosclerotic aortas. Our meta-analysis overcomes limitations of individual studies that, because of their experimental approach, over- or underrepresent certain cell populations. Mass cytometry studies demonstrate that cell surface phenotype provides valuable information beyond the cell transcriptomes. The present analysis helps resolve some long-standing controversies in the field. First, Trem2+ foamy macrophages are not proinflammatory but interferon-inducible cell and inflammatory macrophages are. Second, about half of all foam cells are smooth muscle cell-derived, retaining smooth muscle cell transcripts rather than transdifferentiating to macrophages. Third, Pf4, which had been considered specific for platelets and megakaryocytes, is also prominently expressed in the main population of resident vascular macrophages. Fourth, a new type of resident macrophage shares transcripts with cavity macrophages. Finally, the discovery of a prominent innate lymphoid cell-2 cluster links the single-cell RNA sequencing work to recent flow cytometry data suggesting a strong atheroprotective role of innate lymphoid cells-2. This resolves apparent discrepancies regarding the role of T helper 2 cells in atherosclerosis based on studies that predated the discovery of innate lymphoid cells-2 cells.
Keywords: T lymphocytes; atherosclerosis; interferons; macrophages; monocytes; mouse; neutrophils.
Figures


References
-
- Jonasson L, Holm J, Skalli O, Bondjers G, Hansson GK. Regional accumulations of t cells, macrophages, and smooth muscle cells in the human atherosclerotic plaque. Arteriosclerosis. 1986;6:131–138. - PubMed
-
- Bonanno E, Mauriello A, Partenzi A, Anemona L, Spagnoli LG. Flow cytometry analysis of atherosclerotic plaque cells from human carotids: A validation study. Cytometry. 2000;39:158–165. - PubMed
-
- Bandura DR, Baranov VI, Ornatsky OI, et al. Mass cytometry: Technique for real time single cell multitarget immunoassay based on inductively coupled plasma time-of-flight mass spectrometry. Analytical chemistry. 2009;81:6813–6822. - PubMed
Publication types
MeSH terms
Substances
Grants and funding
- R00 HL138163/HL/NHLBI NIH HHS/United States
- R01 HL139000/HL/NHLBI NIH HHS/United States
- R35 HL145241/HL/NHLBI NIH HHS/United States
- R01 CA202987/CA/NCI NIH HHS/United States
- R01 HL140976/HL/NHLBI NIH HHS/United States
- R01 HL136098/HL/NHLBI NIH HHS/United States
- R01 HL148094/HL/NHLBI NIH HHS/United States
- R01 HL137229/HL/NHLBI NIH HHS/United States
- R01 HL146134/HL/NHLBI NIH HHS/United States
- P01 HL136275/HL/NHLBI NIH HHS/United States
- R01 HL142129/HL/NHLBI NIH HHS/United States
- P01 HL055798/HL/NHLBI NIH HHS/United States
- R01 HL134236/HL/NHLBI NIH HHS/United States
- R01 HL141853/HL/NHLBI NIH HHS/United States
LinkOut - more resources
Full Text Sources
Medical
Research Materials
Miscellaneous

