. 2020 Aug 18;53(2):384-397.e5.
doi: 10.1016/j.immuni.2020.06.022. Epub 2020 Jul 15.

The Cytokine IL-17A Limits Th17 Pathogenicity via a Negative Feedback Loop Driven by Autocrine Induction of IL-24

Affiliations

The Cytokine IL-17A Limits Th17 Pathogenicity via a Negative Feedback Loop Driven by Autocrine Induction of IL-24

Wai Po Chong et al. Immunity. .

Abstract

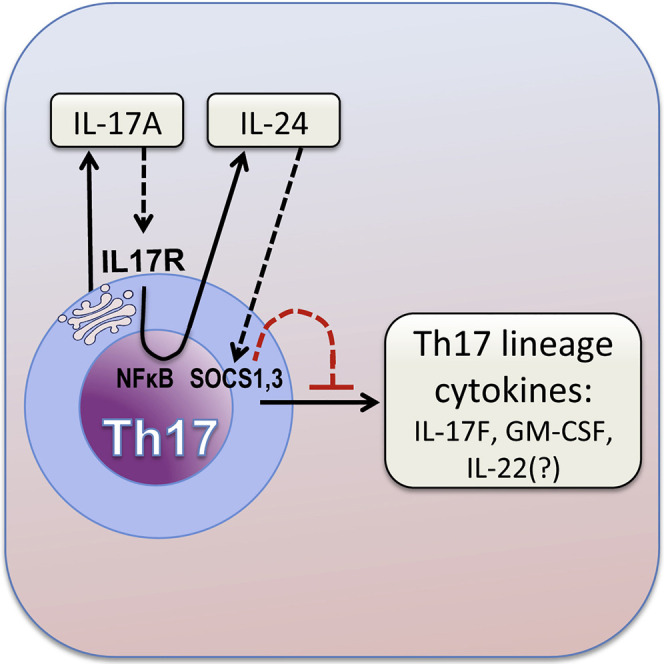
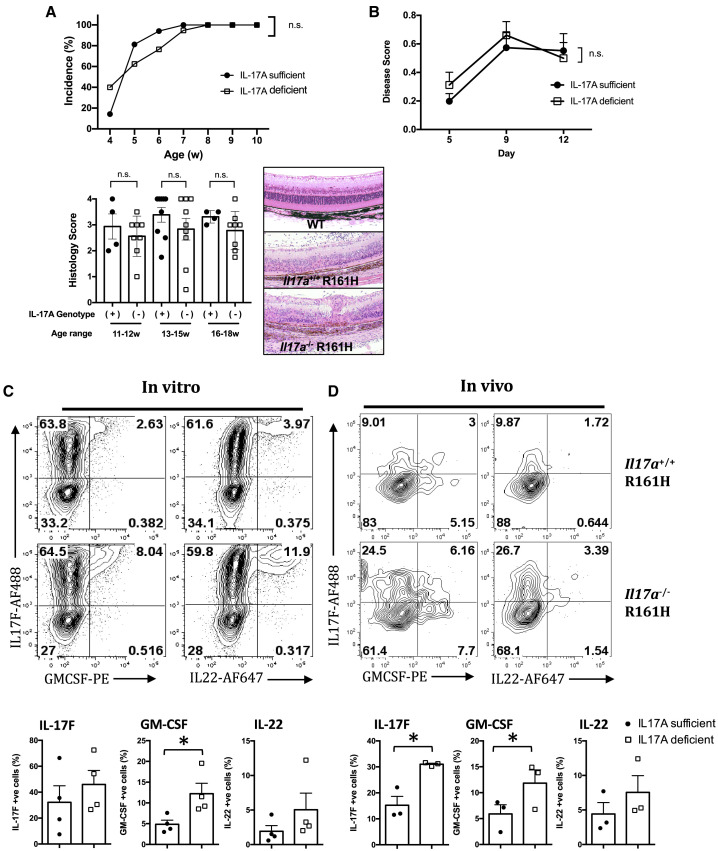
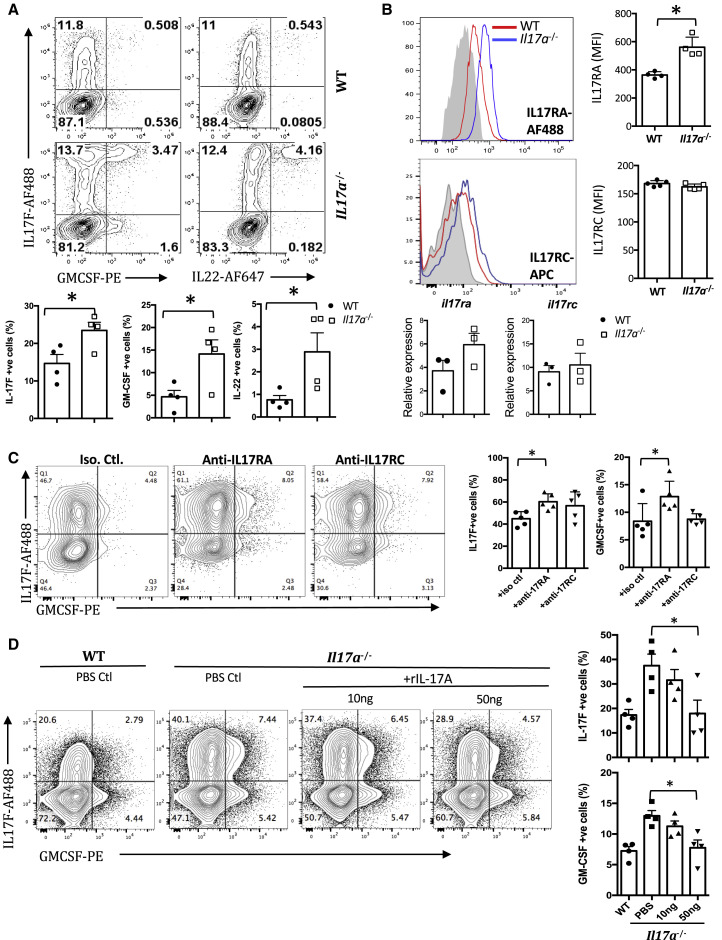
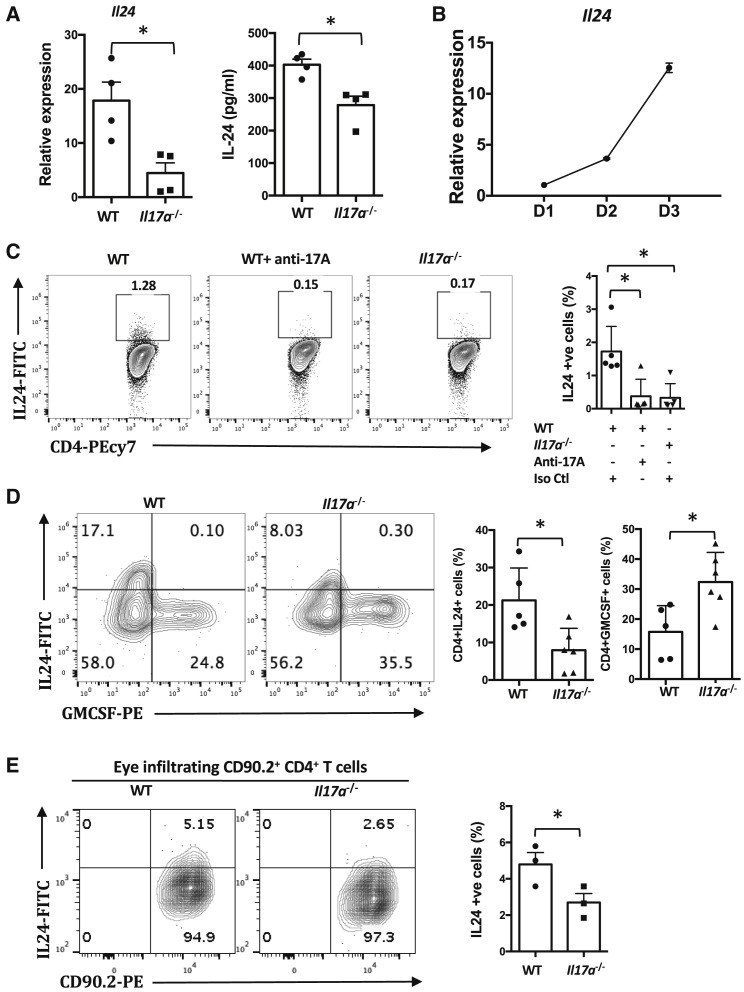
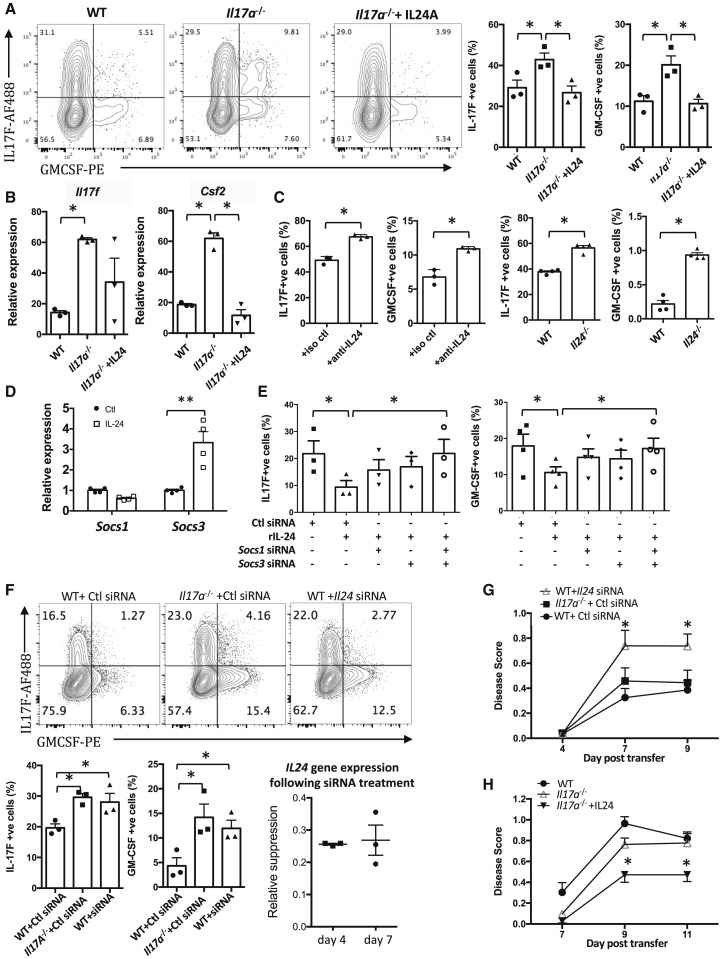
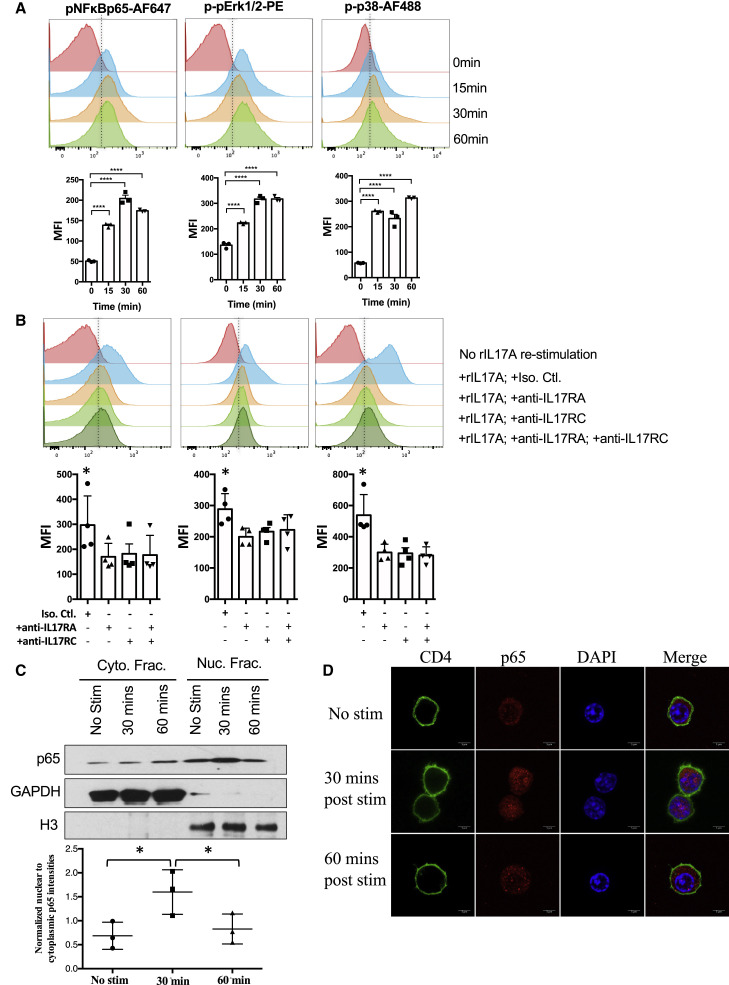
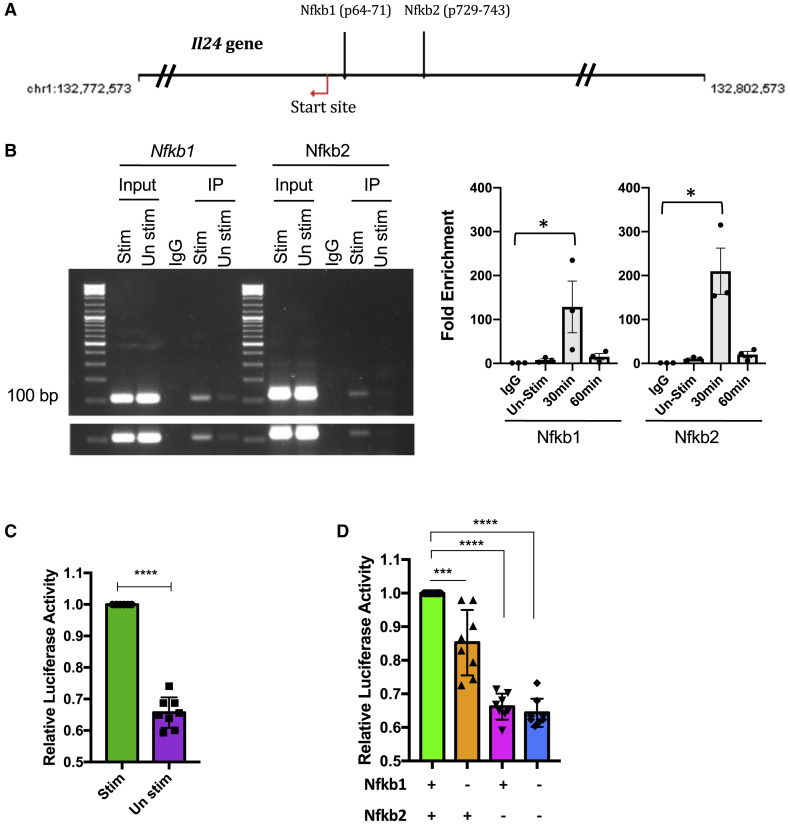
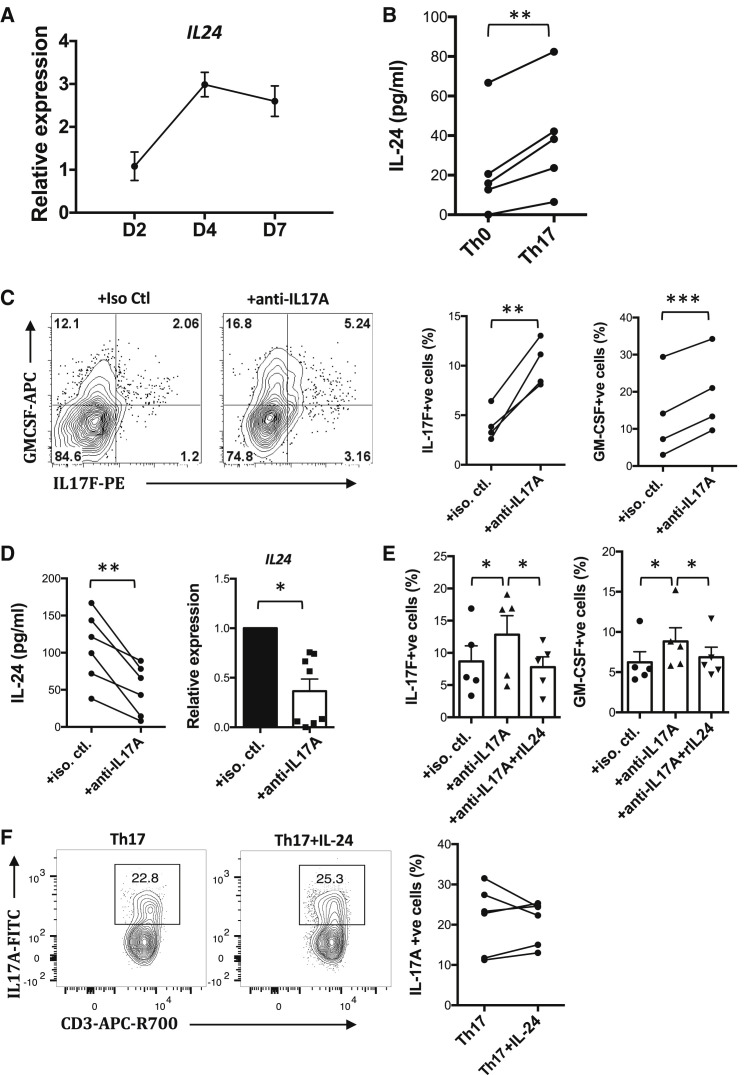
Dysregulated Th17 cell responses underlie multiple inflammatory and autoimmune diseases, including autoimmune uveitis and its animal model, EAU. However, clinical trials targeting IL-17A in uveitis were not successful. Here, we report that Th17 cells were regulated by their own signature cytokine, IL-17A. Loss of IL-17A in autopathogenic Th17 cells did not reduce their pathogenicity and instead elevated their expression of the Th17 cytokines GM-CSF and IL-17F. Mechanistic in vitro studies revealed a Th17 cell-intrinsic autocrine loop triggered by binding of IL-17A to its receptor, leading to activation of the transcription factor NF-κB and induction of IL-24, which repressed the Th17 cytokine program. In vivo, IL-24 treatment ameliorated Th17-induced EAU, whereas silencing of IL-24 in Th17 cells enhanced disease. This regulatory pathway also operated in human Th17 cells. Thus, IL-17A limits pathogenicity of Th17 cells by inducing IL-24. These findings may explain the disappointing therapeutic effect of targeting IL-17A in uveitis.

Keywords: GM-CSF; IL-17; IL-24; Th17; encephalomyelitis; experimental autoimmune uveitis; neuroinflammation; secukinumab.


Conflict of interest statement

Declaration of Interests U.S. Patent No. 10,512,671, issued December 24, 2019 (R.R.C., W.P.C., R.H., and M.J.M.).

Figures

None
Graphical abstract
Figure 1
Figure 1
Spontaneous Uveitis in IL-17A-Deficient Mice Develops in the Context of Increased Expression of Other Th17-Lineage Cytokines (A) Incidence of spontaneous uveitis in Il17a−/− R161H mice and their Il17a+/+ or − R161H littermates was measured. Incidence was determined by fundus examination (upper panel; at least 5 mice per group at weaning at 4 weeks and at least 15 mice per group for all other time points), disease score by histology of eyes collected between 11 and 18 weeks of age (lower panel; at least 4 mice per group at each time point), and representative images of the H&E staining of the retina (100× original magnification). (B) IL-17A-sufficient or IL-17A-deficient R161H cells were adoptively transferred into WT B10.RIII recipients. Data are combined from two experiments with at least 14 mice per point. Disease was scored at the indicated time points using fundoscopy. (C and D) Cells were obtained from the eye-draining lymph nodes (LNs) of IL-17A-sufficient or IL-17A-deficient CD90.2 R161H mice and were polarized under Th17 conditions with IRBP161–180 peptide for 3 days and adoptively transferred into CD90.1 WT B10.RIII recipients. (C) Cytokine profiles of in vitro-polarized CD4+ T cells were analyzed using intracellular staining. Shown are representative fluorescence-activated cell sorting (FACS) plots (top) and compiled data (bottom) from four independent experiments. (D) Five days after adoptive transfer, eyes (6 or more) were pooled, and the cytokine profiles of eye-infiltrating donor (CD90.2) CD4+ T cells were determined using intracellular staining. Representative FCM plots (top) and compiled data (bottom) from three independent experiments. p < 0.05, Student’s t test. Data are depicted as mean ± SEM.
Figure 2
Figure 2
IL-17A Inhibits Expression of Other Th17-Lineage Cytokines through the IL-17A Receptor Cells were obtained from the spleen of IL-17A-sufficient or IL-17A-deficient B10RIII. CD4+CD62L+ T cells were isolated and polarized under Th17 conditions with anti-CD3/CD28 antibodies for 3 days. (A) Cytokine profiles of polarized CD4+ T cells were analyzed using intracellular staining and shown as representative FCM plots (top) and compiled data (bottom) from three to five independent experiments. (B) Th17-polarized CD4+ cells were stained with IL-17RA or IL-17RC. Gray filled histogram, isotype control; red histogram, WT Th17 cells; blue histogram, Il17a−/− Th17 cells. Shown are representative histograms (top left plots) and compiled mean fluorescence intensity (MFI) data (top right plots) from four or five independent experiments. Their gene expression was also determined using real-time PCR. Data were compiled from three independent experiments (bottom graphs) and were normalized to GAPDH and expressed as relative to WT Th0 cells. (C) Th17-polarized WT CD4+ T cells with or without indicated isotype control, anti-IL-17RA, or anti-IL-17RC antibodies. Shown are representative FCM plots (left) and compiled data (right) from five independent experiments. (D) Th17-polarized CD4+ T cells were cultured with or without recombinant IL-17A. Shown are representative FCM plots (left) and compiled data (right) from four independent experiments. p < 0.05, Student’s t test (A and B) and one-way ANOVA (C and D). Data are depicted as mean ± SEM. See also Figures S1 and S2.
Figure 3
Figure 3
IL-24 Is Expressed by Th17 Cells, and Its Expression Is Dependent on IL-17A (A) IL-24 expression in WT and Il17a−/− Th17 cells as determined using q-PCR (left, n = 3 or 4, relative to resting CD4+ CD62L+ T cells) and ELISA (right, n = 4). (B) Kinetics of IL-24 expression over 3 days of polarization in WT Th17 cells were studied (n = 3, relative to resting CD4+ CD62L+ T cells). (C) CD4+CD62L+ T cells from WT and Il17a−/− mice were polarized under Th17 conditions with anti-CD3/CD28 antibodies for 3 days with or without an anti-IL-17A antibody. Shown are representative FCM plots (left) and compiled data (right) from five independent experiments. (D) WT or Il17a−/− mice were immunized with IRBP161–180 peptide. Cytokine profiles of eye-infiltrating CD4+ T cells were determined using intracellular staining. Representative data of two independent experiments with at least five mice per group. (E) Cells were obtained from the eye-draining LNs of IL-17A-sufficient or IL-17A-deficient CD90.2 R161H mice and were polarized under Th17 conditions with IRBP161–180 peptide for 3 days. Cells were adoptively transferred into CD90.1 WT B10.RIII recipients. Five days after adoptive transfer, eyeballs (six or more) were pooled, and the cytokine profiles of eye-infiltrating CD90.2+CD4+ T cells were determined using intracellular staining. Representative FCM plots (right) and compiled data (left) from three independent experiments. p < 0.05, Student’s t test (A and E) or one-way ANOVA (C and D). Data are depicted as mean ± SEM. See also Figure S3.
Figure 4
Figure 4
IL-24 Inhibits the Effector Functions of Th17 Cells (A–E) CD4+CD62L+ T cells from WT, Il17a−/− mice were isolated and polarized under Th17 conditions with anti-CD3/CD28 antibodies for 3 days with or without (A and B) recombinant IL-24 or (C) anti-IL-24 antibody or isotype control in WT. CD4+CD62L+ T cells were also isolated from Il24−/− mice for Th17 polarization. (D) Il17a−/− Th17 cells were re-stimulated with anti-CD3/CD28 antibodies for 24 h with or without IL-24. The mRNA expression of SOCS1 and SOCS3 was determined using real-time PCR. (E) Il17a−/− Th17 cells were polarized in presence of different combinations of IL-24 and siRNAs; expression of IL-17F and GM-CSF was determined using flow cytometry. (F–H) Cells were obtained from the draining LNs of IL-17A-sufficient or IL-17A-deficient R161H mice and were polarized under Th17 conditions with IRBP161–180 peptide for 3 days with Il24 siRNA or scrambled control. (F) The expression of IL-17F and GM-CSF was determined by intracellular cytokine staining. Stability of the knockdown was confirmed using RT-PCR (normalized to control siRNA). (G) Cells were polarized in the presence of control siRNA or Il24 siRNA and were transferred to naive WT recipients. (H) After the adoptive transfer, the recipient mice received recombinant IL-24 (intraperitoneal [i.p.] injection) every other day. In (A)–(F), data are combined from at least three independent experiments. In (G) and (H), data are combined from two independent experiments with at least seven mice per group. p < 0.05; ∗∗p < 0.01, Student’s t test (A and C), one-way ANOVA (B, E, and F), and two-way ANOVA with Dunnett’s correction for multi-group comparison (G and H). Data are depicted as mean ± SEM. See also Figures S4–S7.
Figure 5
Figure 5
IL-17A Induces NF-κB Signaling in Th17 Cells (A and B) CD4+CD62L+ T cells from WT mice were isolated and polarized under Th17 conditions with anti-CD3/CD28 antibodies for 3 days. Cells were pulsed with IL-17A. (A and B) Phosphorylation of NF-κBp65, Erk1/2, and p38 was determined using flow cytometry. Data are shown as representative histogram and as compiled data from three (A) and four (B) independent experiments. (C and D) NF-κBp65 translocated into the nucleus after IL-17A re-stimulation. Representative of three (C) and two (D) independent experiments. p < 0.05 and ∗∗∗∗p < 0.0001, one-way ANOVA (A–C). Data are depicted as mean ± SEM.
Figure 6
Figure 6
IL-17A Induces the Il24 Gene Promoter Activity through NF-κB (A) The Il24 gene has two potential binding sites for NF-κB (predicted by Genomatix). (B) PCR and real-time PCR showing the result of the two Il24 promoter sequences after the DNA was pulled down by anti-p65 antibody. Left panel shows representative data after 30 min; right panel shows average data compiled from three independent experiments. (C and D) CD4+CD62L+ T cells from WT mice were isolated and polarized under Th17 conditions with anti-CD3/CD28 antibodies for 3 days. Cells were pulsed with IL-17A. Cells were transfected with the indicated reporter constructs (C) Il24 promoter and (D) Il24 promoter with mutation at Nfkb1 and/or Nfkb2. Fold change in Firefly/Renilla (FL/RL) ratio is plotted with respect to control (n = 8). p < 0.05, ∗∗∗p < 0.001, and ∗∗∗∗p < 0.0001, one-way ANOVA (B and D) and Student’s t test (C). Data are depicted as mean ± SEM.
Figure 7
Figure 7
IL-17A Induces Human Th17 Cells to Produce IL-24, Which Suppresses Expression of Th17-Lineage Cytokines (A–F) Naive human CD4+ T cells were isolated using naive CD4+ T cell isolation kit (Miltenyi) and were polarized under Th17 conditions for 14 days. (A) Kinetics of IL-24 expression during Th17 polarization were studied. Cells were collected at the indicated time points and were analyzed using real-time PCR (n = 4). (B) Expression of IL-24 by human Th0 and Th17 cells was determined from supernatant collected by ELISA on day 5 (n = 5). (C, E, and F) Cells were harvested on day 14 and subjected to intracellular staining for the indicated cytokines (C, n = 4; E, n = 5; F, n = 6). (D) Supernatant and cells were harvested on day 5 for ELISA (n = 6) and real-time PCR (n = 8), respectively, to detect IL-24 expression. p < 0.05, ∗∗p < 0.01, and ∗∗∗p < 0.001, paired t test (A, C, and D) and one-way ANOVA (E). (F) Not significant. Data are depicted as mean ± SEM.

References

    1. Agarwal R.K., Caspi R.R. Rodent models of experimental autoimmune uveitis. Methods Mol. Med. 2004;102:395–419. - PubMed
    1. Al Omar S., Flanagan B.F., Almehmadi M., Christmas S.E. The effects of IL-17 upon human natural killer cells. Cytokine. 2013;62:123–130. - PubMed
    1. Amadi-Obi A., Yu C.R., Liu X., Mahdi R.M., Clarke G.L., Nussenblatt R.B., Gery I., Lee Y.S., Egwuagu C.E. TH17 cells contribute to uveitis and scleritis and are expanded by IL-2 and inhibited by IL-27/STAT1. Nat. Med. 2007;13:711–718. - PubMed
    1. Andoh A., Shioya M., Nishida A., Bamba S., Tsujikawa T., Kim-Mitsuyama S., Fujiyama Y. Expression of IL-24, an activator of the JAK1/STAT3/SOCS3 cascade, is enhanced in inflammatory bowel disease. J. Immunol. 2009;183:687–695. - PubMed
    1. Anuradha R., Munisankar S., Dolla C., Kumaran P., Nutman T.B., Babu S. Modulation of CD4+ and CD8+ T-cell function by interleukin 19 and interleukin 24 during filarial infections. J. Infect. Dis. 2016;213:811–815. - PMC - PubMed

Publication types