. 2020 Aug 20;182(4):843-854.e12.
doi: 10.1016/j.cell.2020.06.044. Epub 2020 Jul 13.

Longitudinal Isolation of Potent Near-Germline SARS-CoV-2-Neutralizing Antibodies from COVID-19 Patients

Affiliations

Longitudinal Isolation of Potent Near-Germline SARS-CoV-2-Neutralizing Antibodies from COVID-19 Patients

Christoph Kreer et al. Cell. .

Erratum in

  • Longitudinal Isolation of Potent Near-Germline SARS-CoV-2-Neutralizing Antibodies from COVID-19 Patients.
    Kreer C, Zehner M, Weber T, Ercanoglu MS, Gieselmann L, Rohde C, Halwe S, Korenkov M, Schommers P, Vanshylla K, Di Cristanziano V, Janicki H, Brinker R, Ashurov A, Krähling V, Kupke A, Cohen-Dvashi H, Koch M, Eckert JM, Lederer S, Pfeifer N, Wolf T, Vehreschild MJGT, Wendtner C, Diskin R, Gruell H, Becker S, Klein F. Kreer C, et al. Cell. 2020 Sep 17;182(6):1663-1673. doi: 10.1016/j.cell.2020.08.046. Cell. 2020. PMID: 32946786 Free PMC article. No abstract available.

Abstract

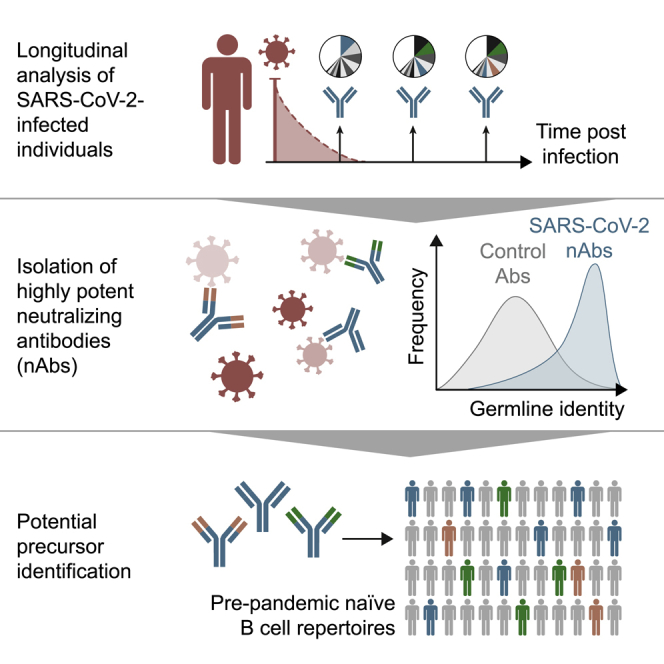
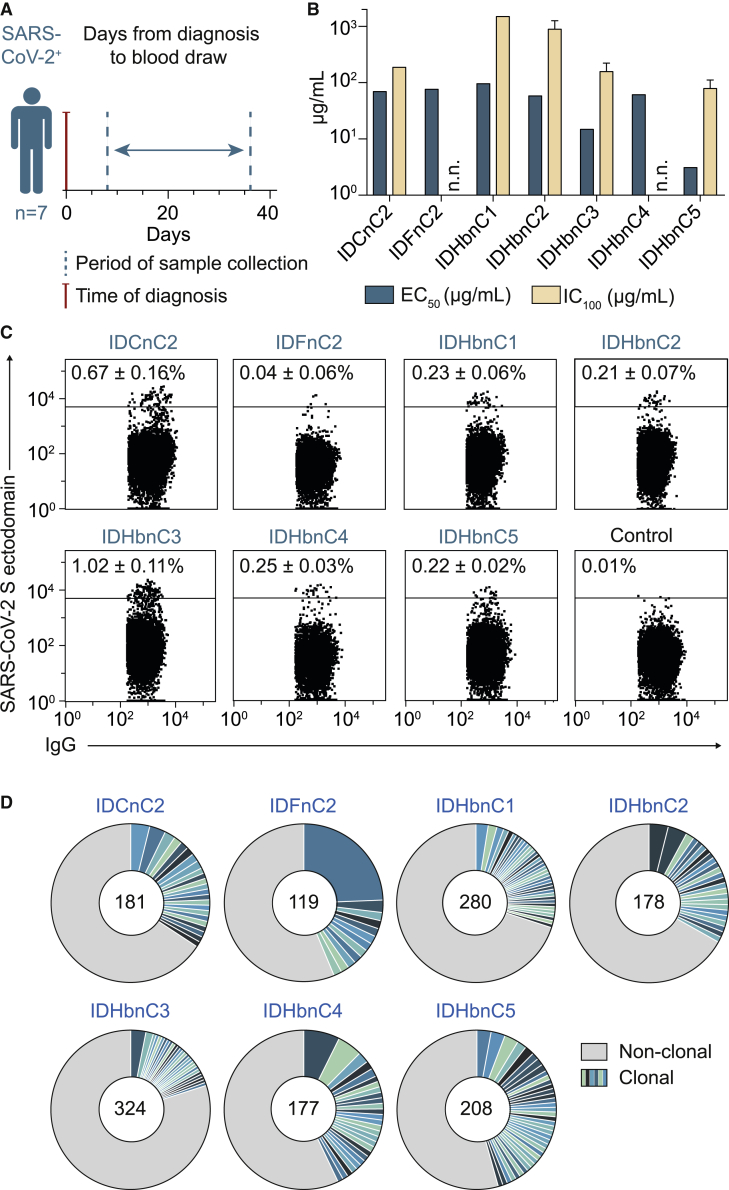
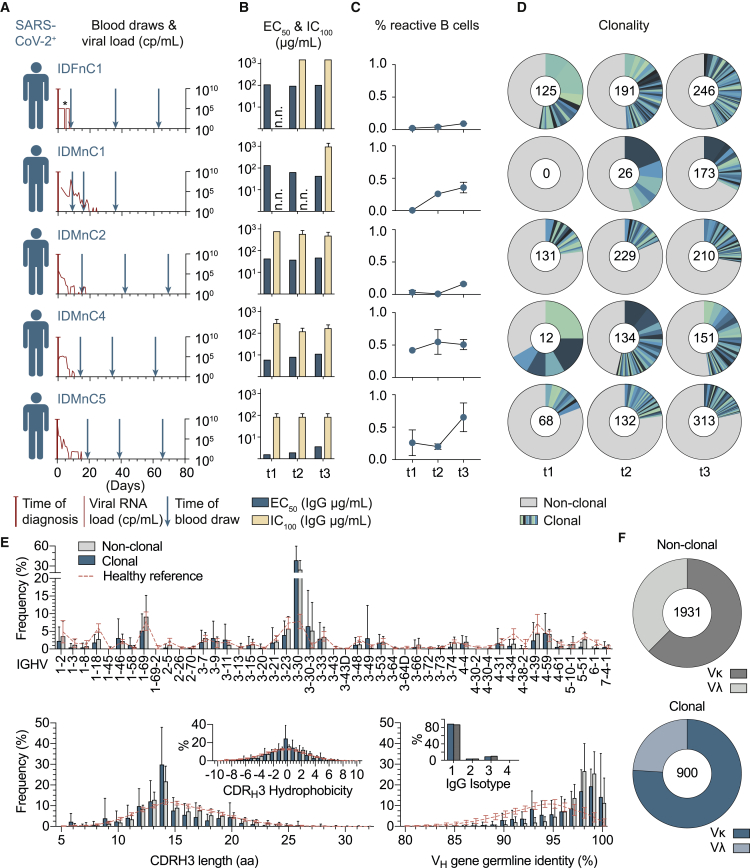
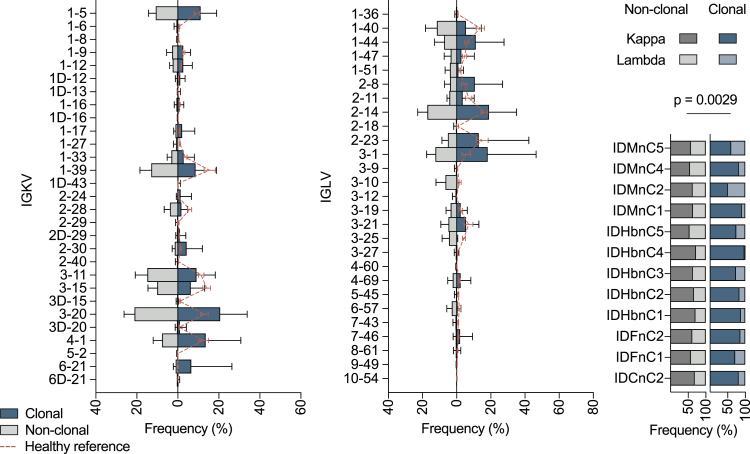
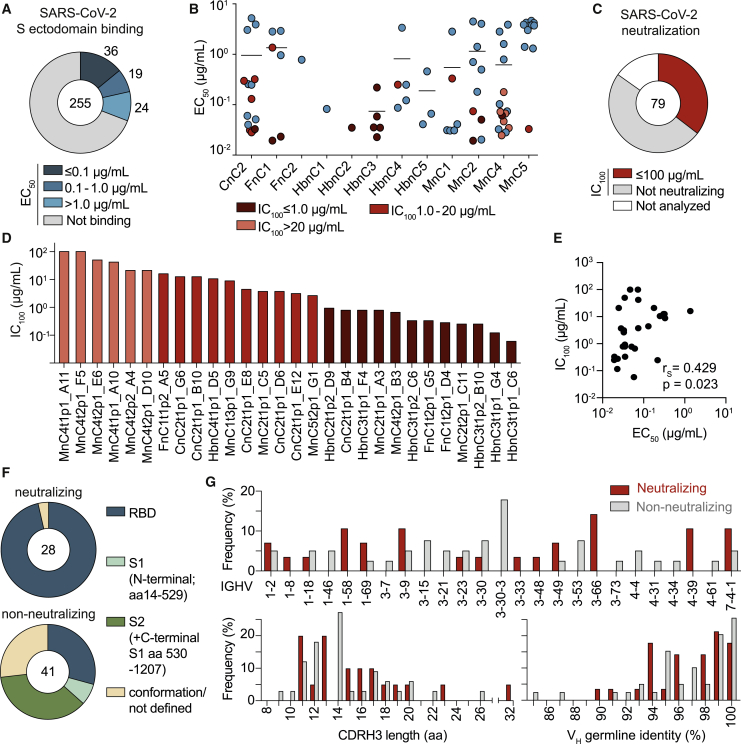
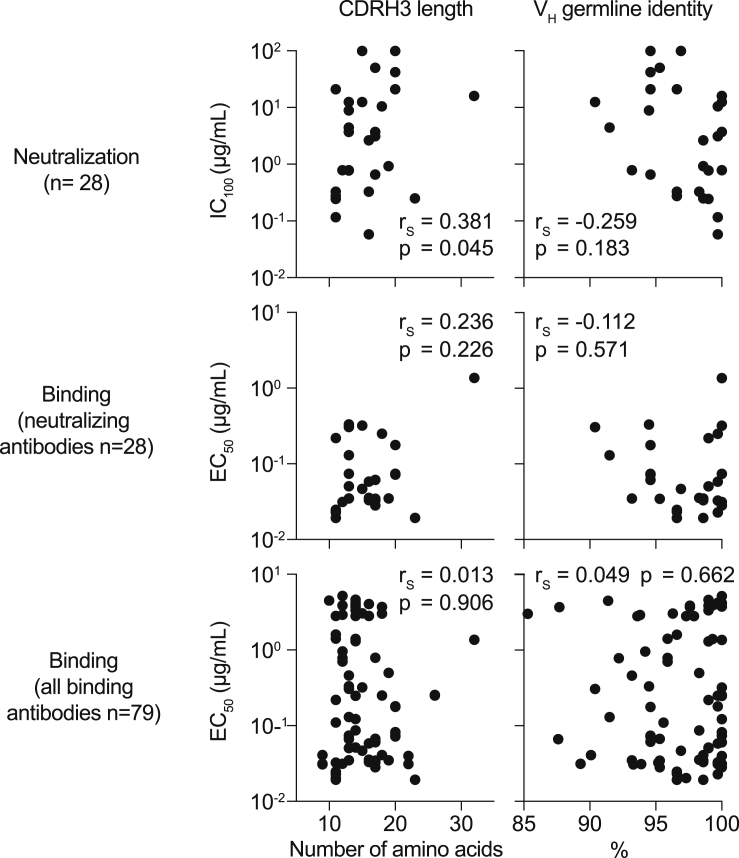
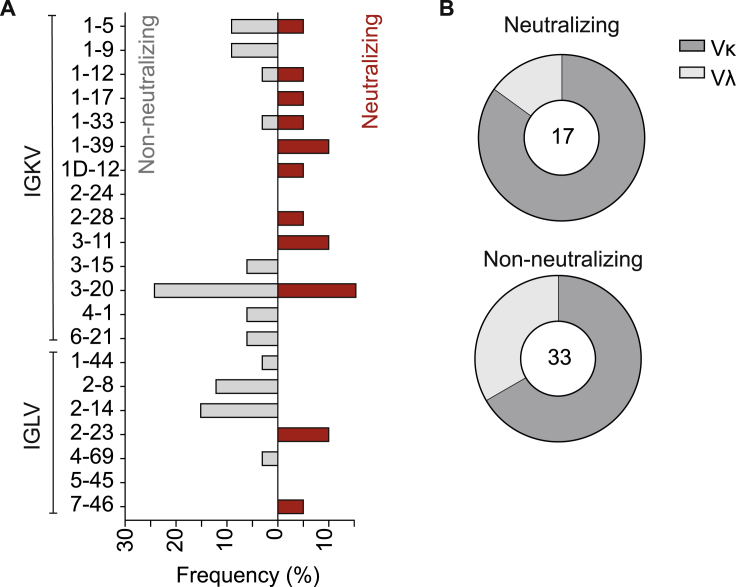
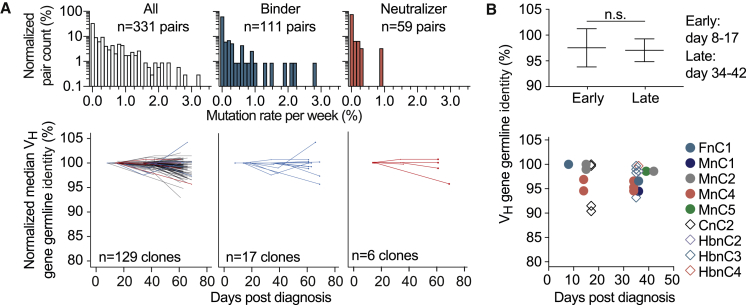
The SARS-CoV-2 pandemic has unprecedented implications for public health, social life, and the world economy. Because approved drugs and vaccines are limited or not available, new options for COVID-19 treatment and prevention are in high demand. To identify SARS-CoV-2-neutralizing antibodies, we analyzed the antibody response of 12 COVID-19 patients from 8 to 69 days after diagnosis. By screening 4,313 SARS-CoV-2-reactive B cells, we isolated 255 antibodies from different time points as early as 8 days after diagnosis. Of these, 28 potently neutralized authentic SARS-CoV-2 with IC100 as low as 0.04 μg/mL, showing a broad spectrum of variable (V) genes and low levels of somatic mutations. Interestingly, potential precursor sequences were identified in naive B cell repertoires from 48 healthy individuals who were sampled before the COVID-19 pandemic. Our results demonstrate that SARS-CoV-2-neutralizing antibodies are readily generated from a diverse pool of precursors, fostering hope for rapid induction of a protective immune response upon vaccination.

Keywords: 2019-nCoV; COVID-19; SARS-CoV-2; monoclonal antibody; neutralizing antibody; single B cell analysis.


Conflict of interest statement

Declaration of Interests A patent application encompassing aspects of this work has been filed by the University of Cologne, listing F.K., S.B., C.K., M.Z., and H.G. as inventors.

Figures

None
Graphical abstract
Figure 1
Figure 1
SARS-CoV-2 infection induces a polyclonal B cell and antibody response (A) Scheme of cross-sectional sample collection (see also Table S1). (B) Binding to the trimeric SARS-CoV-2 S ectodomain (ELISA, EC50) and authentic SARS-CoV-2 neutralization activity (complete inhibition of VeroE6 cell infection, IC100) of cross-sectional plasma-purified IgG samples. Bar plots show arithmetic or geometric means ± SD of duplicates or quadruplicates for EC50 and IC100, respectively. Abbreviation is as follows: n.n., no neutralization as defined by IC100 > 1,500 g/mL IgG. (C) Dot plots of IgG+ B cell analysis. Depicted numbers (percent ± SD) indicate average frequencies of S-reactive B cells (see also Tables S2, S3, and Figure S1). (D) Clonal relationship of S ectodomain-reactive B cells. Individual clones are colored in shades of blue and green. Numbers of productive heavy-chain sequences are depicted in the center of the pie charts. Clone sizes are proportional to the total number of productive heavy chains per clone.
Figure S1
Figure S1
Gating strategy for single-cell sorting, related to Figures 1 and 2 CD19+ B cells isolated by MACS were used and cell aggregates were excluded by FSC. Living CD20+ IgG+ cells were gated and cells with a positive SARS-CoV-2 S ectodomain staining were selected for single cell sort.
Figure 2
Figure 2
SARS-CoV-2-specific IgG+ B cells readily develop after infection with recurring B cell clones and a preference for the VH gene segment 3-30 (A) Scheme of longitudinal sample collection. The viral RNA load from nasopharyngeal swabs is indicated in red (copies [cp] per milliliter, right y axis). The viral load for IDFnC1 is given as positive or negative result (see also Table S1). (B) Binding to the trimeric SARS-CoV-2 S ectodomain (ELISA, EC50) and authentic SARS-CoV-2 neutralization activity (complete inhibition of VeroE6 cell infection, IC100) of longitudinal purified plasma IgG samples. n.n., no neutralization as defined by IC100 > 1,500 µg/mL IgG. Bar plots show arithmetic or geometric means ± SD of duplicates or quadruplicates for EC50 and IC100, respectively. (C) Percentage of SARS-CoV-2 S ectodomain-reactive IgG+ B cells over time (mean ± SD; see also Tables S2, S3, and Figure S1). (D) Clonal relationship over time. Individual clones are colored in shades of blue and green. Numbers of productive heavy-chain sequences per time point are given in the center of pie charts. (E) Frequencies of VH gene segments (top), CDRH3 length and CDRH3 hydrophobicity (bottom left), as well as VH gene germline identity and IgG isotype of clonal and non-clonal sequences (bottom right) from all 12 subjects and time points. NGS reference data from 48 healthy individuals (collected before the outbreak of SARS-CoV-2) are depicted in red (see also Tables S1 and S2). Bar and line plots show mean ± SD. (F) Ratio of κ and λ light chains in non-clonal (top, gray) and clonal (bottom, blue) sequences (see also Figure S2).
Figure S2
Figure S2
Light-chain characteristics of sorted single cells, related to Figure 2 Left and middle graphics: frequencies of VL gene segments of clonal and non-clonal sequences are shown (κ left, λ middle). Shown on the right are ratios of κ and λ within the single sample sets in clonal and non-clonal sequences. A two-tailed Wilcoxon matched-pairs signed rank test was performed on κ / λ ratios to test for significance.
Figure 3
Figure 3
Infected individuals can develop potent near-germline SARS-CoV-2-neutralizing antibodies that preferentially bind to the S-protein RBD (A) Interaction of isolated antibodies with the SARS-CoV-2 S ectodomain by ELISA. Binding antibodies (blue) were defined by an EC50 of less than 30 μg/mL and an optical density 415–695 nm (OD415–695) of 0.25 or more (data not shown). (B) EC50 values (mean of duplicates) of SARS-CoV-2 S ectodomain-interacting antibodies per individual. Neutralizing antibodies are labeled in shades of red (see also Figure S5 and Table S4). (C) Authentic SARS-CoV-2 neutralization activity (complete inhibition of VeroE6 cell infection, IC100, in quadruplicates) of S-ectodomain-specific antibodies (red). (D) Geometric mean potencies (IC100) of all neutralizing antibodies. (E) Correlation between S ectodomain binding (EC50) and neutralization potency (IC100). The correlation coefficient rS and approximate p value were calculated by Spearman’s rank-order correlation (see also Figure S3). (F) Epitope mapping of SARS-CoV-2 S ectodomain-specific antibodies against the RBD, truncated N-terminal the S1 subunit (aa 14–529), and a monomeric S ectodomain construct by ELISA. S2 binding was defined by interaction with monomeric S but not RBD or S1. Antibodies interacting with none of the subdomains were specified as conformational epitopes or not defined. (G) Top: frequencies of VH gene segments for non-neutralizing and neutralizing antibodies. Clonal sequence groups were collapsed and treated as one sample for calculation of the frequencies. Shown on the bottom are the CDRH3 length (left) and VH gene germline identity (right) of non-neutralizing and neutralizing antibodies (see also Figure S4).
Figure S3
Figure S3
Correlation of binding and neutralization with VH gene characteristics, related to Figure 3 Correlation plots of EC50 values of binding or neutralizing antibodies or IC100 values of neutralizing antibodies with CDRH3 lengths or VH germline identities. Spearman correlation coefficient rS and approximate p values are given.
Figure S4
Figure S4
VL gene distribution in non-neutralizing and neutralizing antibodies, related to Figure 3 (A) Frequencies of VL gene segments for non-neutralizing (left, gray) and neutralizing antibodies (right, red). Clonal sequence groups were collapsed and treated as one sample for calculation of the frequencies. (B) Ratio of λ and κ light chains for neutralizing (left) and non-neutralizing S-ectodomain-specific antibodies (bottom, blue).
Figure S5
Figure S5
Autoreactivity of selected SARS-CoV-2-binding and -neutralizing antibodies, related to Figure 3 HEp-2 cells were incubated with SARS-CoV-2 S-ectodomain antibodies at concentrations of 100 μg/mL and analyzed by indirect immunofluorescence. Representative pictures of the scoring system are shown.
Figure 4
Figure 4
Dynamics of somatic mutations for SARS-CoV-2-specific antibodies (A) Distribution of mutation rates per week for clonal members (top) and median change in VH germline identity normalized by the first measurement for each longitudinal clone (bottom). (B) VH gene germline identity of neutralizing antibodies from different time points. Shown on top is the mean ± SD for groups of antibodies from early or late time points (two-tailed Mann-Whitney U test). Shown on the bottom are the VH germline identities of all isolated neutralizing antibodies depending on the time between diagnosis and blood sample collection (see also Table S4).
Figure 5
Figure 5
Sequence precursor frequencies of SARS-CoV-2-specific antibodies in naive repertoires of healthy individuals (A) Strategy for sequence precursor identification from healthy naive B cell receptor (BCR) repertoires. HC, heavy chain; KC, κ chain; LC, λ chain; VH and VL, heavy- and light-chain V gene; CDRH3 and CDRL3, heavy- and light-chain CDR3. (B) Number of clonotypes in healthy naive B cell receptor repertoires (n = 48) with matched V/J genes from SARS-CoV-2-binding antibodies (n = 79), plotted against the CDR3 difference. Bars of included potential sequence precursors are highlighted in shades of blue. For heavy chains, CDR3s were allowed to differ 1 aa in length and contain up to 3 aa mutations. For light chains, only identical CDR3s were counted. (C) Number of different antibody heavy and light chains for which precursors were identified and number of different individuals from which precursor sequences were isolated. Numbers in overlapping circles indicate that both heavy and light chains were detected. See also Table S5.

References

    1. Andreano E., Nicastri E., Paciello I., Pileri P., Manganaro N., Piccini G., Manenti A., Pantano E., Kabanova A., Troisi M. Identification of neutralizing human monoclonal antibodies from Italian Covid-19 convalescent patients. bioRxiv. 2020 doi: 10.1101/2020.05.05.078154. - DOI - PMC - PubMed
    1. Baum A., Fulton B.O., Wloga E., Copin R., Pascal K.E., Russo V., Giordano S., Lanza K., Negron N., Ni M. Antibody cocktail to SARS-CoV-2 spike protein prevents rapid mutational escape seen with individual antibodies. Science. 2020 doi: 10.1126/science.abd0831. - DOI - PMC - PubMed
    1. Braun J., Loyal L., Frentsch M., Wendisch D., Georg P., Kurth F., Hippenstiel S., Dingeldey M., Kruse B., Fauchere F. Presence of SARS-CoV-2 reactive T cells in COVID-19 patients and healthy donors. MedRxiv. 2020 doi: 10.1101/2020.04.17.20061440. - DOI - PubMed
    1. Brouwer P.J.M., Caniels T.G., van der Straten K., Snitselaar J.L., Aldon Y., Bangaru S., Torres J.L., Okba N.M.A., Claireaux M., Kerster G. Potent neutralizing antibodies from COVID-19 patients define multiple targets of vulnerability. Science. 2020 doi: 10.1126/science.abc5902. - DOI - PMC - PubMed
    1. Burton D.R., Walker L.M. Rational Vaccine Design in the Time of COVID-19. Cell Host Microbe. 2020;27:695–698. - PMC - PubMed

Publication types

MeSH terms

Substances