Observational Study
. 2020 Sep 1;32(3):366-378.e3.
doi: 10.1016/j.cmet.2020.06.018. Epub 2020 Jul 15.

Effects of 4- and 6-h Time-Restricted Feeding on Weight and Cardiometabolic Health: A Randomized Controlled Trial in Adults with Obesity

Affiliations
Observational Study

Effects of 4- and 6-h Time-Restricted Feeding on Weight and Cardiometabolic Health: A Randomized Controlled Trial in Adults with Obesity

Sofia Cienfuegos et al. Cell Metab. .

Abstract

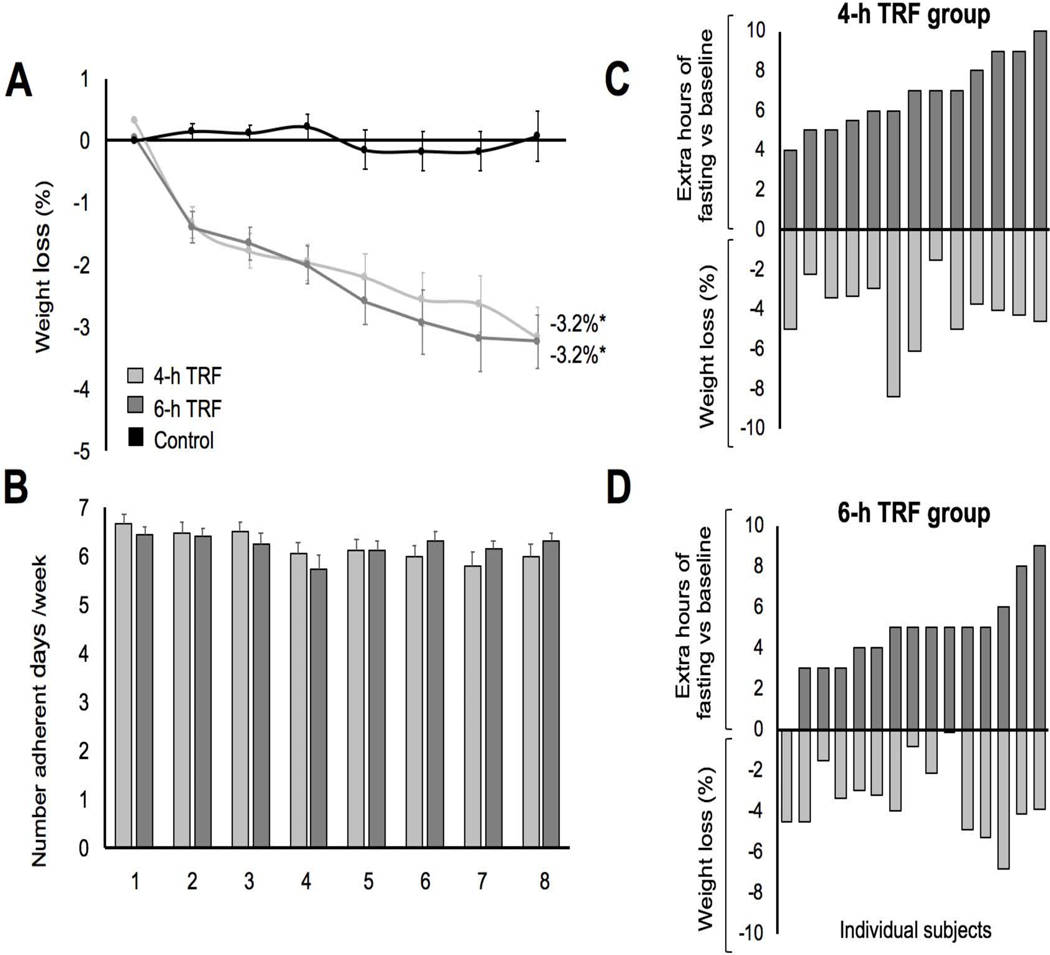
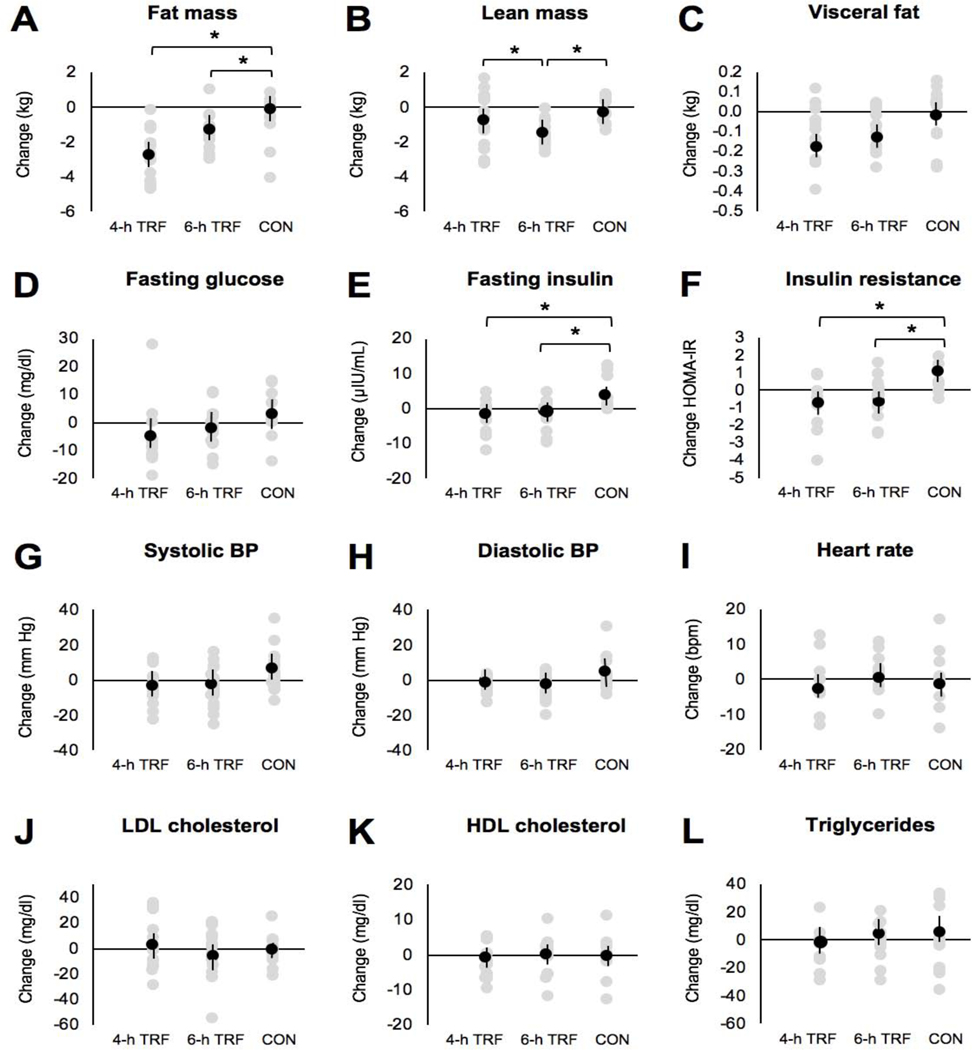
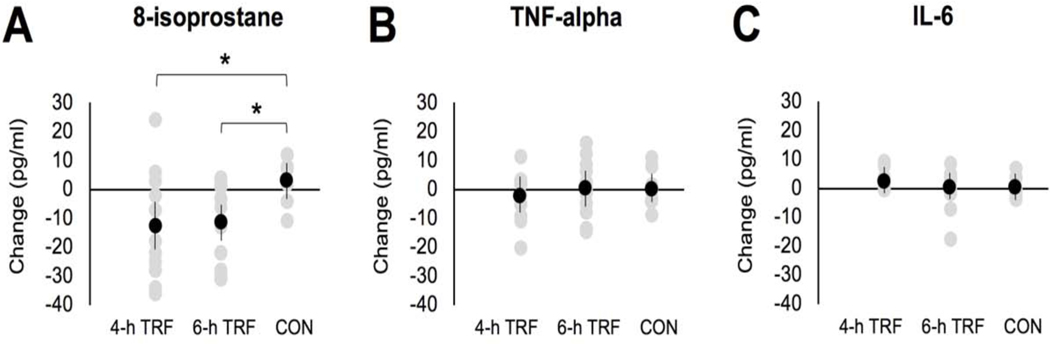
Time-restricted feeding (TRF) regimens have grown in popularity; however, very few studies have examined their weight-loss efficacy. We conducted the first human trial (Clinicaltrials.gov NCT03867773) to compare the effects of two popular forms of TRF (4 and 6 h) on body weight and cardiometabolic risk factors. Adults with obesity were randomized to 4-h TRF (eating only between 3 and 7 p.m.), 6-h TRF (eating only between 1 and 7 p.m.), or a control group (no meal timing restrictions). After 8 weeks, 4- and 6-h TRF produced comparable reductions in body weight (∼3%), insulin resistance, and oxidative stress, versus controls. Energy intake was reduced by ∼550 kcal/day in both TRF groups, without calorie counting. These findings suggest that 4- and 6-h TRF induce mild reductions in body weight over 8 weeks and show promise as interventions for weight loss. These diets may also improve some aspects of cardiometabolic health.

Keywords: blood pressure; body weight; energy intake; insulin resistance; intermittent fasting; metabolic disease; obesity; plasma lipids; time-restricted feeding.


Conflict of interest statement

Declaration of Interests K.A.V. received author fees from Hachette Book Group for the book The Every-Other-Day Diet. The other authors declare no competing interests.

Figures

Figure 1.
Figure 1.. Time restricted feeding interventions
During the 8-week intervention period, the 4-h TRF group ate ad libitum (Ad lib) from 3:00–7:00 pm daily (20-h fast). The 6-h TRF group ate ad libitum from 1:00–7:00 pm daily (18-h fast). During the feeding window, there were no restrictions on types or quantities of foods consumed and participants were not required to monitor caloric intake. Controls were instructed to continue their usual diet pattern and did not have any meal timing restrictions.
Figure 2.
Figure 2.. CONSORT diagram showing participant flow through the trial
A total of 82 individuals were screened and 24 were excluded as they did not meet one or more inclusion criteria. 58 participants were randomized into 1 of 3 groups: 4-h TRF, 6-h TRF, or control. Baseline measures were assessed after randomization. At the conclusion of the 8-week intervention period, there were 16 completers in the 4-h TRF group, 19 completers in the 6-h TRF group, and 14 completers in the control group.
Figure 3.
Figure 3.. Weight loss and diet compliance
(A) Percentage weight loss vs baseline for the 4-h TRF, 6-h TRF group and Ad lib control group during the 8-week intervention period of the study. Each data point represents each week of the 8-week period, starting at week 1. (B) The number of adherent days of the dietary regimen for the 4-h (light grey) and 8- hr (dark grey) TRF groups over the 8-week intervention period of the study. (C) The extent of the fasting window and the percentage weight loss in the 4-h TRF group. Completers only analysis. (D) The extent of the fasting window and the percentage weight loss in the 6-h TRF group. Completers only analysis. Values reported as mean ± SEM, where appropriate. Data were included for 58 participants; means were estimated by an intention-to-treat analysis using last observation carried forward. *P < 0.001, change score between baseline to week 8 by ANCOVA.
Figure 4.
Figure 4.. Body composition and metabolic risk markers
A) Change in fat mass after 8-weeks of intervention for the 4-h TRF, 6-h TRF and Ad lib control group. B) Change in lean mass after 8-weeks of intervention for the 4-h TRF, 6-h TRF and Ad lib control group. C) Change in visceral fat mass after 8-weeks of intervention for the 4-h TRF, 6-h TRF and Ad lib control group. D) Change in fasting glucose levels after 8-weeks of intervention for the 4-h TRF, 6-h TRF and Ad lib control group. E) Change in fasting insulin levels after 8-weeks of intervention for the 4-h TRF, 6-h TRF and Ad lib control group. F) Change in insulin resistance (measured by HOMA-IR) after 8-weeks of intervention for the 4-h TRF, 6-h TRF and Ad lib control group. G) Change in systolic blood pressure after 8-weeks of intervention for the 4-h TRF, 6-h TRF and Ad lib control group. H) Change in diastolic blood pressure after 8-weeks of intervention for the 4-h TRF, 6-h TRF and Ad lib control group. I) Change in heart rate after 8-weeks of intervention for the 4-h TRF, 6-h TRF and Ad lib control group. J) Change in LDL cholesterol levels after 8-weeks of intervention for the 4-h TRF, 6-h TRF and Ad lib control group. K) Change in HDL cholesterol levels after 8-weeks of intervention for the 4-h TRF, 6-h TRF and Ad lib control group. L) Change in triglycerides after 8-weeks of intervention for the 4-h TRF, 6-h TRF and Ad lib control group. Values reported as mean ± SEM. Data were included for 58 participants; means were estimated by an intention-to-treat analysis using last observation carried forward. Each data point represents an individual participant. Mean change is indicated by a black data point. *P < 0.05, change score between baseline to week 8 by ANCOVA.
Figure 5.
Figure 5.. Oxidative stress and inflammatory markers
A) Change in 8-isoprostane levels (marker of oxidative stress to lipids) after 8-weeks of intervention for the 4-h TRF, 6-h TRF and Ad lib control group. B) Change in plasma TNF-alpha levels after 8-weeks of intervention for the 4-h TRF, 6-h TRF and Ad lib control group. C) Change in plasma IL-6 levels after 8-weeks of intervention for the 4-h TRF, 6-h TRF and Ad lib control group. Values reported as mean ± SEM. Data were included for 58 participants; means were estimated by an intention-to-treat analysis using last observation carried forward. Each data point represents an individual participant. Mean change is indicated by a black data point. *P < 0.05, change score between baseline to week 8 by ANCOVA.
Figure 6.
Figure 6.. Adverse events
A) Percent occurrences of dizziness at each week of the study. B) Percent occurrences of nausea at each week of the study. C) Percent occurrences of headache at each week of the study. D) Percent occurrences of diarrhea at each week of the study. E) Percent occurrences of fatigue at each week of the study. F) Percent occurrences of constipation at each week of the study. G) Percent occurrences of dry mouth at each week of the study. H) Percent occurrences of irritability at each week of the study. All values reported as percent occurrences at each week of the study. * P < 0.05, percent occurrences significantly different from controls at each time point by ANCOVA.

Comment in

References

    1. Antoni R, Johnston KL, Collins AL, and Robertson MD (2018). Intermittent v. continuous energy restriction: differential effects on postprandial glucose and lipid metabolism following matched weight loss in overweight/obese participants. Br J Nutr 119, 507–516. - PubMed
    1. Antoni R, Robertson TM, Robertson MD, Johnston JD (2018). A pilot feasibility study exploring the effects of a moderate time-restricted feeding intervention on energy intake, adiposity and metabolic physiology in free-living human subjects. J Nutr Sci 7, 22.
    1. Bhutani S, Klempel MC, Kroeger CM, Trepanowski JF, and Varady KA (2013). Alternate day fasting and endurance exercise combine to reduce body weight and favorably alter plasma lipids in obese humans. Obesity (Silver Spring) 21, 1370–1379. - PubMed
    1. Bowen J, Brindal E, James-Martin G, and Noakes M (2018). Randomized Trial of a High Protein, Partial Meal Replacement Program with or without Alternate Day Fasting: Similar Effects on Weight Loss, Retention Status, Nutritional, Metabolic, and Behavioral Outcomes. Nutrients 10. - PMC - PubMed
    1. Carlson O, Martin B, Stote KS, Golden E, Maudsley S, Najjar SS, Ferrucci L, Ingram DK, Longo DL, Rumpler WV, et al. (2007). Impact of reduced meal frequency without caloric restriction on glucose regulation in healthy, normal-weight middle- aged men and women. Metabolism 56, 1729–1734. - PMC - PubMed

Publication types

Associated data