. 2020 Jul 24;23(7):101330.
doi: 10.1016/j.isci.2020.101330. Epub 2020 Jun 30.

A Viral Toolbox of Genetically Encoded Fluorescent Synaptic Tags

Affiliations

A Viral Toolbox of Genetically Encoded Fluorescent Synaptic Tags

Seth Bensussen et al. iScience. .

Abstract

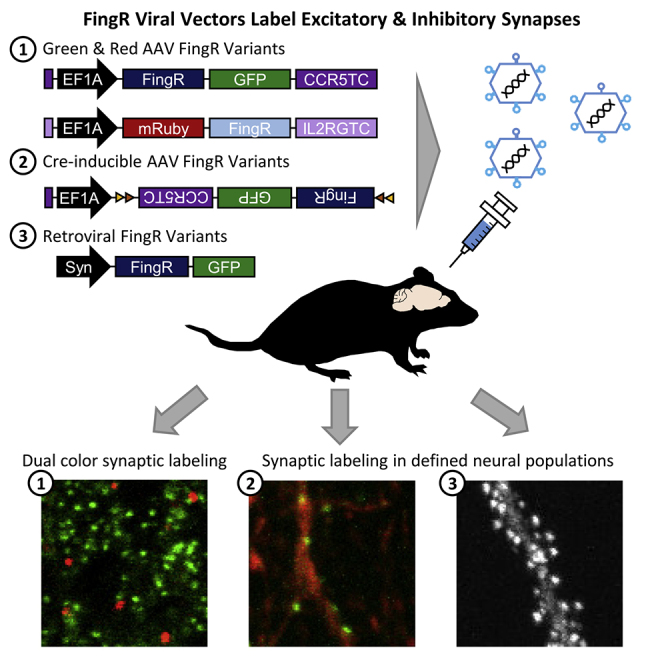
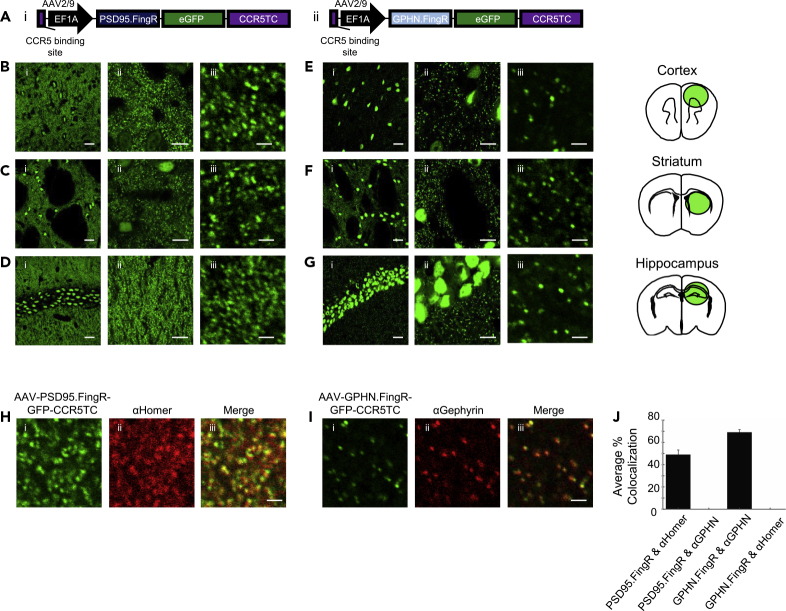
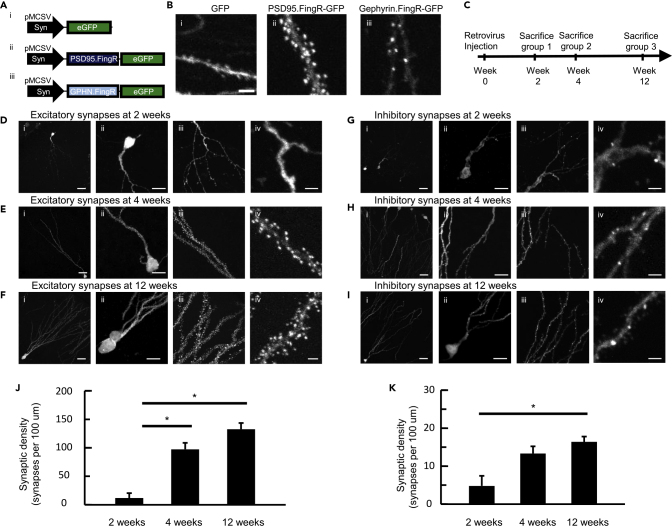
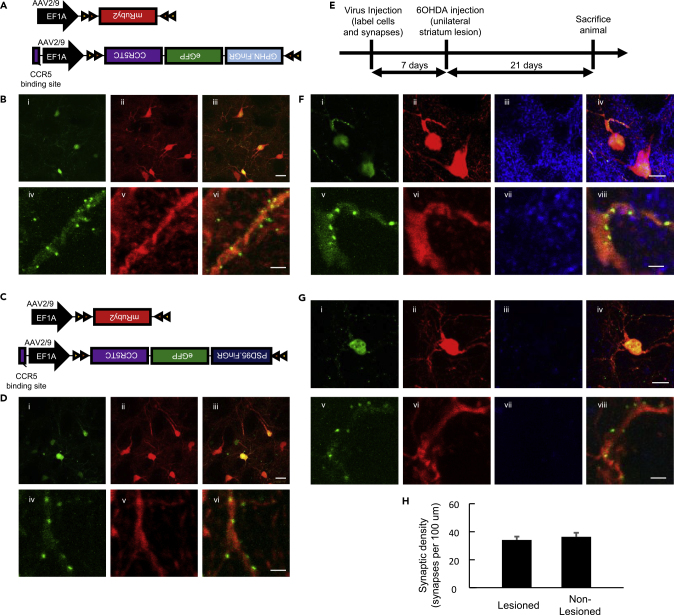
Fibronectin intrabodies generated with mRNA display (FingRs) are a recently developed tool for labeling excitatory or inhibitory synapses, with the benefit of not altering endogenous synaptic protein expression levels or synaptic transmission. Here, we generated a viral vector FingR toolbox that allows for multi-color, neuron-type-specific labeling of excitatory or inhibitory synapses in multiple brain regions. We screened various fluorophores, FingR fusion configurations, and transcriptional control regulations in adeno-associated virus (AAV) and retrovirus vector designs. We report the development of a red FingR variant and demonstrated dual labeling of excitatory and inhibitory synapses in the same cells. Furthermore, we developed cre-inducible FingR AAV variants and demonstrated their utility, finding that the density of inhibitory synapses in aspiny striatal cholinergic interneurons remained unchanged in response to dopamine depletion. Finally, we generated FingR retroviral vectors, which enabled us to track the development of excitatory and inhibitory synapses in hippocampal adult-born granule cells.

Keywords: Biological Sciences; Neuroscience; Techniques in Neuroscience.


Conflict of interest statement

Declaration of Interests The authors declare no competing financial interests.

Figures

None
Graphical abstract
Figure 1
Figure 1
PSD95.FingR and Gephyrin.FingR AAVs Globally Label Excitatory and Inhibitory Synapses with Sub-micron Resolution (A) DNA construct diagrams for (i) PSD95.FingR and (ii) Gephyrin.FingR (GPHN.FingR). Both constructs use the AAV2 transfer backbone and were packaged with the serotype 9 coat proteins. CCR5TC is the transcriptional repressor domain responsible for transcriptional control, which recognizes the CCR5 binding site upstream of the EF1α promoter to regulate the potential for overexpression of the FingR proteins. (B–D) Representative images of PSD95.FingR expression in the motor cortex (B), striatum (C), and hippocampus (D) of mouse brain slices. Images shown at 60× (i), 60× with 4× zoom (ii), and 60× with 20× zoom (iii). Scale bars: 25μm in (i), 10 μm in (ii), and 2 μm in (iii). (E–G) Representative images of Gephyrin.FingR expression in the motor cortex (E), striatum (F), and hippocampus (G) of mouse brain slices. Images shown at 60× (i), 60× with 4× zoom (ii), and 60× with 20× zoom (iii). Scale bars: 25 μm in (i), 10 μm in (ii), and 2 μm in (iii). (H) Brain slices expressing PSD95.FingR (i), stained with a homer antibody (ii), and co-localization (iii). Scale bar, 2 μm. (I) Brain slices expressing Gephyrin.FingR (i), stained with a gephyrin antibody (ii), and co-localization (iii). Scale bar, 2 μm. (J) Quantification of co-localization between synapses labeled with PSD95.FingR, Homer antibody, GPHN.FingR, and gephyrin (GPHN) antibody. PSD95.FingR-labeled synapses co-localized with Homer antibody significantly more than with GPHN antibody, and GPHN.FingR-labeled synapses co-localized with gephyrin antibody significantly more than with Homer antibody (∗∗∗p < 0.001, two-tailed t test). Data represented as mean ± standard deviation. For additional data, see also Figures S1, S2, and S8.
Figure 2
Figure 2
Optimization of a Red Gephyrin.FingR AAV Enables Dual Synaptic Labeling of Excitatory and Inhibitory Synapses (A) DNA construct diagrams for the red Gephyrin AAV variants tested. The IL2RGTC domain acts orthogonally to the CCR5TC domain. The IL2RGTC domain is a transcriptional repressor that recognizes the IL2RG binding site upstream of the EF1A promoter to prevent overexpression of the FingR proteins. (B–E) Representative images of Gephyrin.FingR-mScarlet (B), mScarlet-Gephyrin.FingR (C), mRuby2-Gephyrin.FingR (D), and mCherry-Gephyrin.FingR (E) infected neurons and stained with the gephyrin antibody (i). Zoomed-in images showing synapses stained with the gephyrin antibody (ii), RFP-Gephyrin.FingR expression (iii), and co-localization between RFP and the antibody (iv). Scale bars: 25 μm in (i) and 10 μm in (ii, iii, and iv). (F) DNA construct diagrams for the co-injected viruses PSD95.FingR-GFP (label excitatory synapses in green) and mRuby2-Gephyrin.FingR (label inhibitory synapses in red). (G–J) Representative images of the expression patterns of the co-injected PSD95.FingR-GFP AAV (i) and mRuby2-Gephyrin.FingR AAV (ii) and their merge (iii) in mouse hippocampal brain slices shown at 10× (G), 60× (H), 60× with 4× zoom (I), and 60× with 20× zoom (J). Note the co-localization of cell bodies labeled and non-co-localized punctate synaptic expression, as expected. Scale bars, 200 μm in (G), 25 μm in (H), 10 μm in (I), and 2 μm in (J). For additional data, see also Figures S4 and S5.
Figure 3
Figure 3
Retroviral FingRs Enable Tracking of Synaptic Development of Adult-Born Dentate Granule Cells throughout Maturation (A) DNA construct diagrams for the retroviruses used in this study. (i) GFP control, (ii) PSD95.FingR-GFP (no transcriptional control), and (iii) Gephyrin.FingR-GFP (no transcriptional control). (B) Representative images of (i) GFP, (ii) PSD95.FingR-GFP, and (iii) Gephyrin.FingR-GFP expression in 4-week-old adult-born cells. Scale bar, 2 μm. (C) Timeline of retroviral injections and subsequent perfusion of mice for tracking synaptic development in adult-born neurons. (D–F) Representative images of the expression patterns of PSD95.FingR-GFP in adult-born cells at 2 weeks (D), 4 weeks (E), and 12 weeks (F) following birth. Cells were imaged at 60× (i), 60× with a 4× zoom (ii and iii), and 60× with a 20× zoom (iv). Scale bars: 25 μm in (i), 10 μm in (ii and iii), and 2μm in (iv). (G–I) Representative images of the expression patterns of Gephyrin.FingR-GFP in adult-born neurons at 2 weeks (G), 4 weeks (H), and 12 weeks (I) following birth. Cells were imaged at 60× (i), 60× with a 4× zoom (ii and iii), and 60× with a 20× zoom (iv). Scale bars: 25 μm in (i), 10 μm in (ii and iii), and 2 μm in (iv). (J and K) Quantification of synaptic density (synapses per 100 μm) of excitatory (J) and inhibitory (K) synapses at 2, 4, and 12 weeks following cell birth (one-way ANOVA with post-hoc Bonferroni correction, ∗p < 0.05). Data represented as mean ± standard error.
Figure 4
Figure 4
Cre-Inducible FingR Variants Label Synapses in Aspiny Striatal Cholinergic Interneurons (A) DNA construct diagrams for labeling of cre-expressing neurons and their inhibitory synapses. (B) 60× (i–iii) and 60× with 20× zoom (iv–vi) representative images of cholinergic interneurons with inhibitory synapses labeled in green (i and iv), cell bodies and dendrites labeled in red (ii and v), and a merge of both channels (iii and vi). Scale bars: 25 μm in (i–iii) and 2 μm in (iv–vi). (C) DNA construct diagrams for labeling of neurons and excitatory synapses. (D) 60× (i–iii) and 60× with 20× zoom (iv–vi) representative images of cholinergic interneurons with excitatory synapses labeled in green (i and iv), cell bodies and dendrites labeled in red (ii and v), and a merge of both channels (iii and vi). Scale bars: 25 μm in (i–iii) and 2 μm (iv–vi). (E) Experimental timeline of virus injection, 6-OHDA injection, and perfusion of animals. (F) Representative 60× with 4× zoom (top, i–iv) and 20× zoom (bottom, v–viii) images of a cholinergic interneuron with inhibitory synapses labeled with Gephyrin.FingR-GFP (i, v) and the whole cell labeled with mRuby2 (ii, vi) along with tyrosine hydroxylase (TH) staining for dopaminergic terminals (iii, vii); the overlay of the three images (iv, viii) in the non-lesioned hemisphere of striatum. Scale bar: 10 μm for images on the top and 2 μm for images on the bottom. (G) Representative 60× with 4× zoom (top, i–iv) and 20× zoom (bottom, v–viii) images of a cholinergic interneuron with inhibitory synapses labeled with Gephyrin.FingR-GFP (i, v) and the whole cell labeled with mRuby2 (ii, vi) along with TH staining for dopaminergic terminals (iii, vii), the overlay of the three images (iv, viii) in the lesioned hemisphere of striatum. Scale bar, 10 μm for images on the top (i–iv) and 2μm for images on the bottom (v–viii). (H) Quantification of inhibitory synaptic density in cholinergic interneurons with and without 6-OHDA lesioning. p > 0.05, no significant difference, Wilcoxon rank-sum test. Data represented as mean ± standard error. For additional data, see also Figure S7.

References

    1. Bindels D.S., Haarbosch L., van Weeren L., Postma M., Wiese K.E., Mastop M., Aumonier S., Gotthard G., Royant A., Hink M.A., Gadella T.W.J., Jr. mScarlet: a bright monomeric red fluorescent protein for cellular imaging. Nat. Methods. 2017;14:1–12. - PubMed
    1. Bosch M., Castro J., Saneyoshi T., Matsuno H., Sur M., Hayashi Y. Structural and molecular remodeling of dendritic spine substructures during long-term potentiation. Neuron. 2014;82:444–459. - PMC - PubMed
    1. Broadhead M.J., Horrocks M.H., Zhu F., Muresan L., Benavides-Piccione R., DeFelipe J., Fricker D., Kopanitsa M.V., Duncan R.R., Klenerman D. PSD95 nanoclusters are postsynaptic building blocks in hippocampus circuits. Sci. Rep. 2016;6:24626. - PMC - PubMed
    1. Cane M., Maco B., Knott G., Holtmaat A. The relationship between PSD-95 clustering and spine stability in vivo. J. Neurosci. 2014;34:2075–2086. - PMC - PubMed
    1. Cearley C.N., Wolfe J.H. Transduction characteristics of adeno-associated virus vectors expressing cap serotypes 7, 8, 9, and Rh10 in the mouse brain. Mol. Ther. 2006;13:528–537. - PubMed

LinkOut - more resources