. 2020 Jul 14;20(14):3922.
doi: 10.3390/s20143922.

Mapping of Agricultural Subsurface Drainage Systems Using a Frequency-Domain Ground Penetrating Radar and Evaluating Its Performance Using a Single-Frequency Multi-Receiver Electromagnetic Induction Instrument

Affiliations

Mapping of Agricultural Subsurface Drainage Systems Using a Frequency-Domain Ground Penetrating Radar and Evaluating Its Performance Using a Single-Frequency Multi-Receiver Electromagnetic Induction Instrument

Triven Koganti et al. Sensors (Basel). .

Abstract

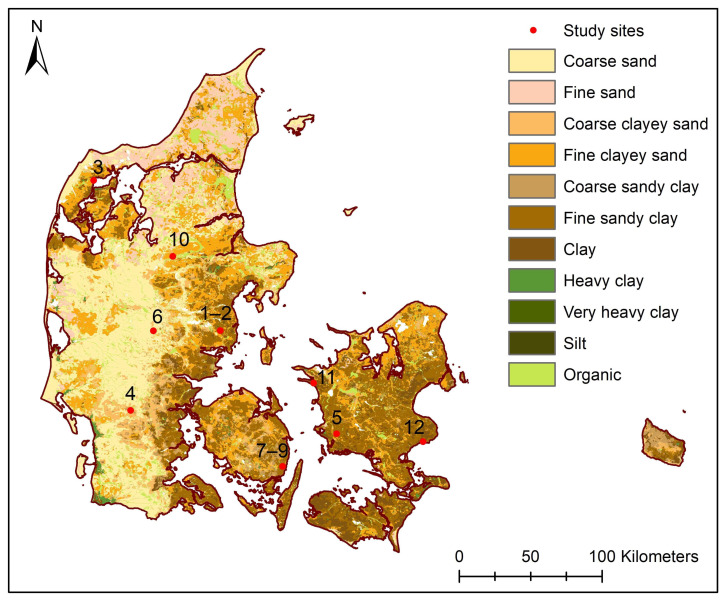
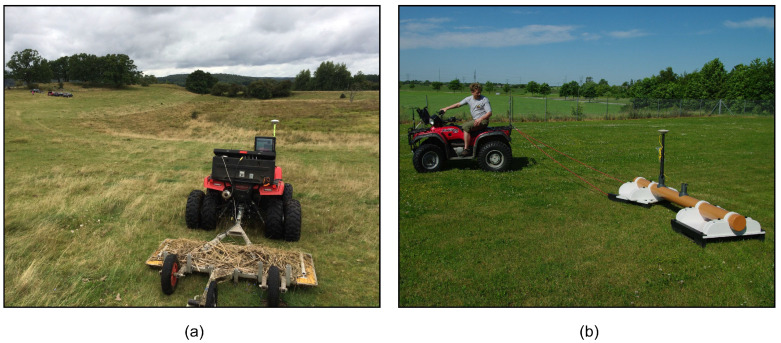
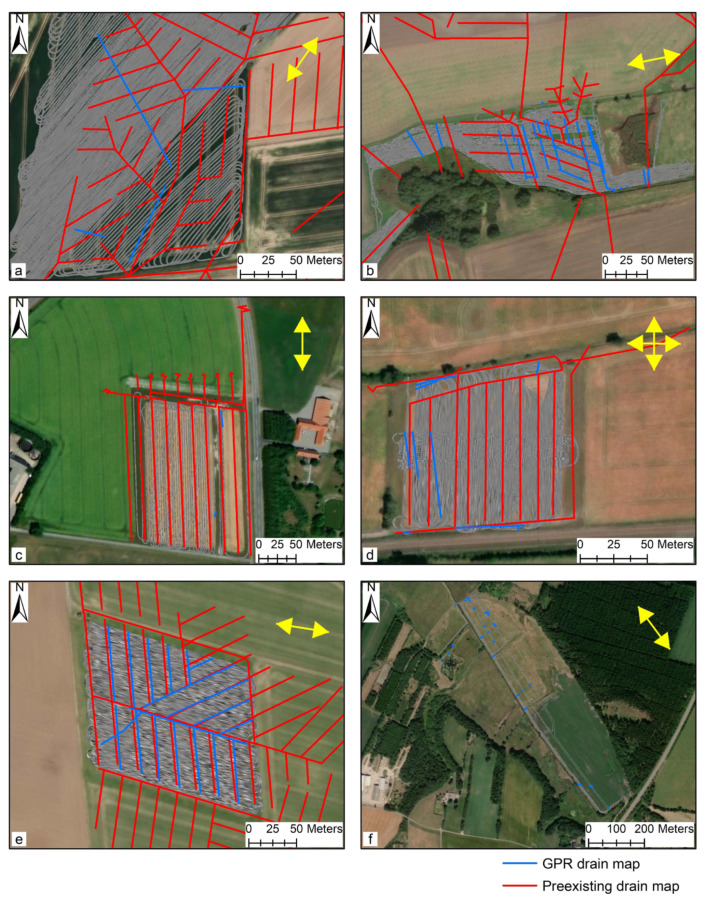
Subsurface drainage systems are commonly used to remove surplus water from the soil profile of a poorly drained farmland. Traditional methods for drainage mapping involve the use of tile probes and trenching equipment that are time-consuming, labor-intensive, and invasive, thereby entailing an inherent risk of damaging the drainpipes. Effective and efficient methods are needed in order to map the buried drain lines: (1) to comprehend the processes of leaching and offsite release of nutrients and pesticides and (2) for the installation of a new set of drain lines between the old ones to enhance the soil water removal. Non-invasive geophysical soil sensors provide a potential alternative solution. Previous research has mainly showcased the use of time-domain ground penetrating radar, with variable success, depending on local soil and hydrological conditions and the central frequency of the specific equipment used. The objectives of this study were: (1) to test the use of a stepped-frequency continuous wave three-dimensional ground penetrating radar (3D-GPR) with a wide antenna array for subsurface drainage mapping and (2) to evaluate its performance with the use of a single-frequency multi-receiver electromagnetic induction (EMI) sensor in-combination. This sensor combination was evaluated on twelve different study sites with various soil types with textures ranging from sand to clay till. While the 3D-GPR showed a high success rate in finding the drainpipes at five sites (sandy, sandy loam, loamy sand, and organic topsoils), the results at the other seven sites were less successful due to the limited penetration depth of the 3D-GPR signal. The results suggest that the electrical conductivity estimates produced by the inversion of apparent electrical conductivity data measured by the EMI sensor could be a useful proxy for explaining the success achieved by the 3D-GPR in finding the drain lines.

Keywords: agricultural drainage systems; electromagnetic induction; frequency-domain; ground penetrating radar; inversion; non-destructive techniques; penetration depth.


Conflict of interest statement

The authors declare no conflict of interest.

Figures

Figure 1
Figure 1
Commonly used subsurface drainage system patterns (modified from [18,19]).
Figure 2
Figure 2
Map of Denmark showing the study sites’ location and soil types according to the Danish Soil Classification [58].
Figure 3
Figure 3
Survey configuration of: (a) the three-dimensional ground penetrating radar (3D-GPR) instrument and (b) the DUALEM-21S sensor.
Figure 4
Figure 4
Illustration showing the procedure for calculating average global and localized 3D-GPR penetration depths: (a) equal reflectivity layered earth model, (b) 2 x 2 m2 regular grid points (black) and circles with 1 m radius (blue) overlain on densely sampled 3D-GPR data (red), and (c) average GPR trace magnitude plot as a function of time with background radio frequency noise floor and GPR penetration depth. The solid black line corresponds to the mean and the dashed red lines correspond to the mean ± standard deviation of the GPR signal magnitude. Note the logarithmic scale used to express the magnitude mean and standard deviation envelope.
Figure 5
Figure 5
An example from Fensholt lowland showing the typical signature of a drain line marked in yellow when the 3D-GPR traverse is perpendicular to drain line orientation: (a) hyperbolic pattern in the vertical profile of reflections (amplitude) and (b) linear pattern in the horizontal slice (~1 m depth) of reflection strength (magnitude). The data were collected in January 2016.
Figure 6
Figure 6
An example from Fensholt upland showing the typical signature of a drain line marked in yellow when the 3D-GPR traverse is at an angle to drain line orientation: (a) hard to recognize hyperbolic pattern in the vertical profile of reflections (amplitude) and (b) linear pattern in the horizontal slice (~0.6 m depth) of reflection strength (magnitude).
Figure 7
Figure 7
The drains mapped using the 3D-GPR instrument (blue) overlain on pre-existing drain maps (red) and the 3D-GPR survey transects at the different sites: (a) Fensholt upland, (b) Fensholt lowland, (c) Silstrup, (d) Estrup, (e) Faardrup, (f) Holtum, (g) Lillebæk-1, (h) Lillebæk-2, (i) Lillebæk-3, (j) Juelsgaard, (k) Kalundborg, and (l) Lund. The pre-existing drain map at the Holtum and Kalundborg sites were missing. Yellow arrows indicate the 3D-GPR survey directional trend and a base map provided by ArcMap 10.6 ([88]) was used as the background at all the sites.
Figure 7
Figure 7
The drains mapped using the 3D-GPR instrument (blue) overlain on pre-existing drain maps (red) and the 3D-GPR survey transects at the different sites: (a) Fensholt upland, (b) Fensholt lowland, (c) Silstrup, (d) Estrup, (e) Faardrup, (f) Holtum, (g) Lillebæk-1, (h) Lillebæk-2, (i) Lillebæk-3, (j) Juelsgaard, (k) Kalundborg, and (l) Lund. The pre-existing drain map at the Holtum and Kalundborg sites were missing. Yellow arrows indicate the 3D-GPR survey directional trend and a base map provided by ArcMap 10.6 ([88]) was used as the background at all the sites.
Figure 8
Figure 8
Average trace magnitude (ATM) plots for all the study sites.
Figure 9
Figure 9
An example of the GPR profiles from the Holtum and Lillebæk-2 sites, respectively showing: (a) strong reflections from the soil layer boundary and deep penetration depth (~2.0 m) and (b) limited penetration depth (~0.6 m) of the 3D-GPR signal. The yellow lines were marked to indicate the depth of 0.7–1.0 m where a large SD was observed in the 3D-GPR signal magnitude at the Holtum site.
Figure 10
Figure 10
Example from Kalundborg site showing: (a) drain card received from the farmer with the 3D-GPR survey region marked in blue (courtesy: Rasmus Erik Eriksen) and (b) drains mapped using the 3D-GPR overlain on the aerial imagery captured by the Royal Air Force in 1954.
Figure 11
Figure 11
Bivariate histogram plots showing the comparison between the 3D-GPR localized penetration depth (ns) and EC (0–1.5 m, mS m−1).
Figure 12
Figure 12
Maps showing the comparison between the 3D-GPR localized penetration depth (ns) and EC (0–1.5 m, mS m−1) at Holtum (a,b), Faardrup (c,d), and Estrup (e,f). The color bar definitions rely on a classification of the data according to Jenks natural breaks optimization in ArcMap 10.6 ([88]).

References

    1. Koganti T., Van De Vijver E., Allred B.J., Greve M.H., Ringgaard J., Iversen B.V. Evaluating the Performance of a Frequency-Domain Ground Penetrating Radar and Multi-Receiver Electromagnetic Induction Sensor to Map Subsurface Drainage in Agricultural Areas; Proceedings of the 5th Global Workshop on Proximal Soil Sensing; Columbia, MO, USA. 28–31 May 2019; pp. 29–34.
    1. Skaggs R.W., Breve M.A., Gilliam J.W. Hydrologic and Water-Quality Impacts of Agricultural Drainage. Crit. Rev. Environ. Sci. Technol. 1994;24:1–32. doi: 10.1080/10643389409388459. - DOI
    1. Khand K., Kjaersgaard J., Hay C., Jia X.H. Estimating Impacts of Agricultural Subsurface Drainage on Evapotranspiration Using the Landsat Imagery-Based METRIC Model. Hydrology-Basel. 2017;4:49. doi: 10.3390/hydrology4040049. - DOI
    1. Fraser H., Fleming R., Eng P. Environmental benefits of tile drainage. LICO–Land Improvement Contractors of Ontario, Ridgetown College, University of Guelph; Ridgetown, ON, Cananda: 2001.
    1. Rogers M.B., Cassidy J.R., Dragila M.I. Ground-based magnetic surveys as a new technique to locate subsurface drainage pipes: A case study. Appl. Eng. Agric. 2005;21:421–426. doi: 10.13031/2013.18461. - DOI

LinkOut - more resources