. 2020 Aug 14;369(6505):787-793.
doi: 10.1126/science.aax3338. Epub 2020 Jul 16.

Huntington's disease alters human neurodevelopment

Affiliations

Huntington's disease alters human neurodevelopment

Monia Barnat et al. Science. .

Abstract

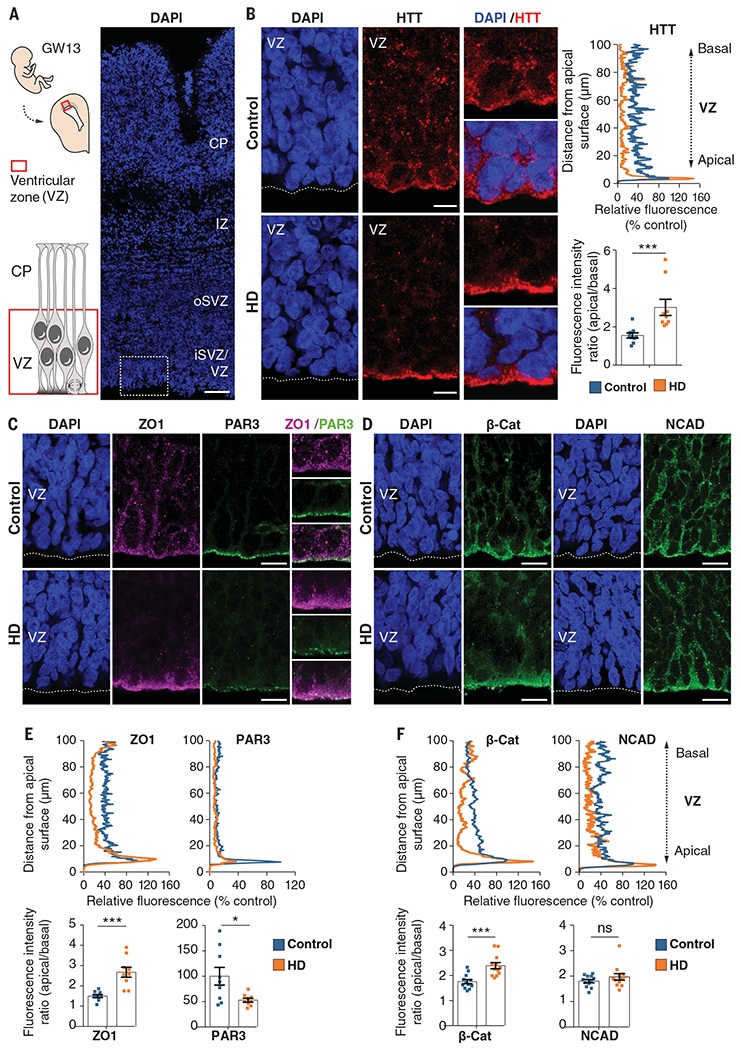
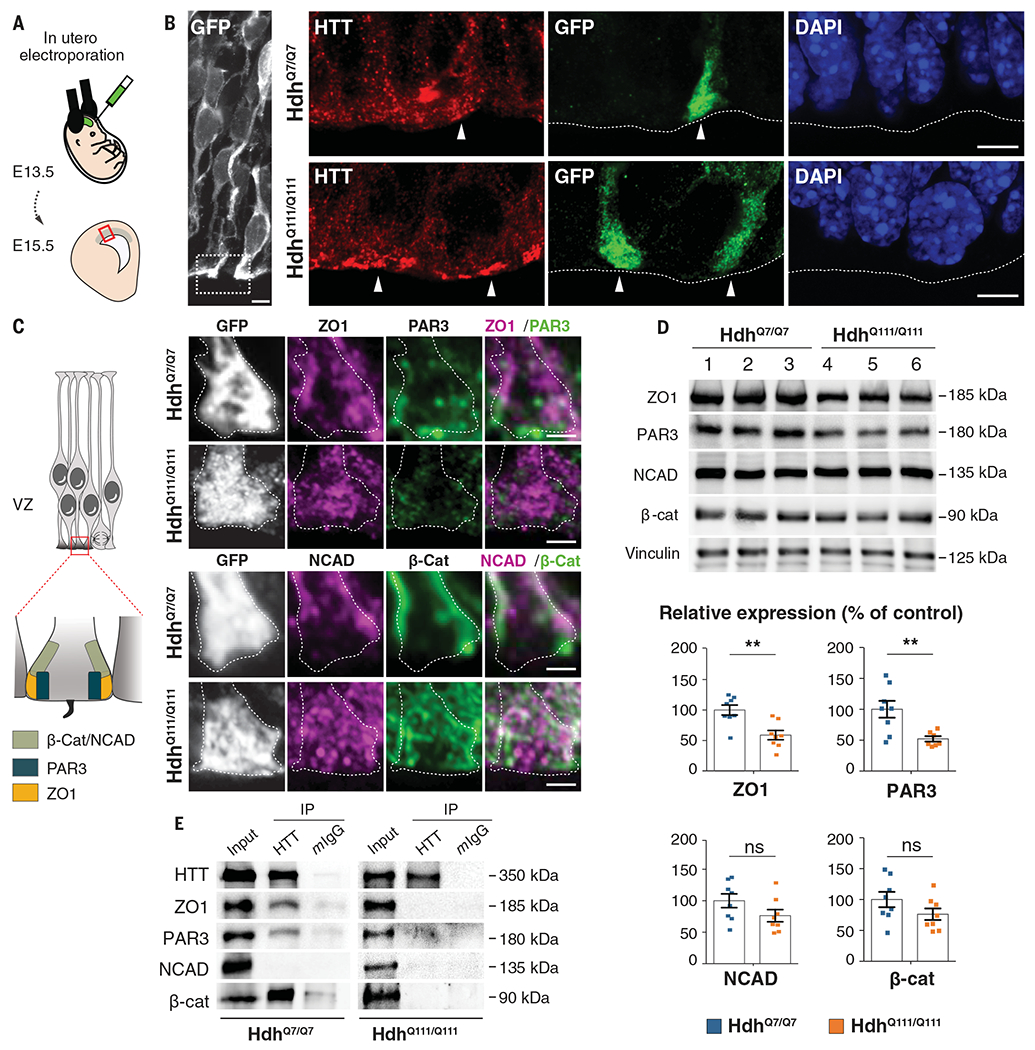
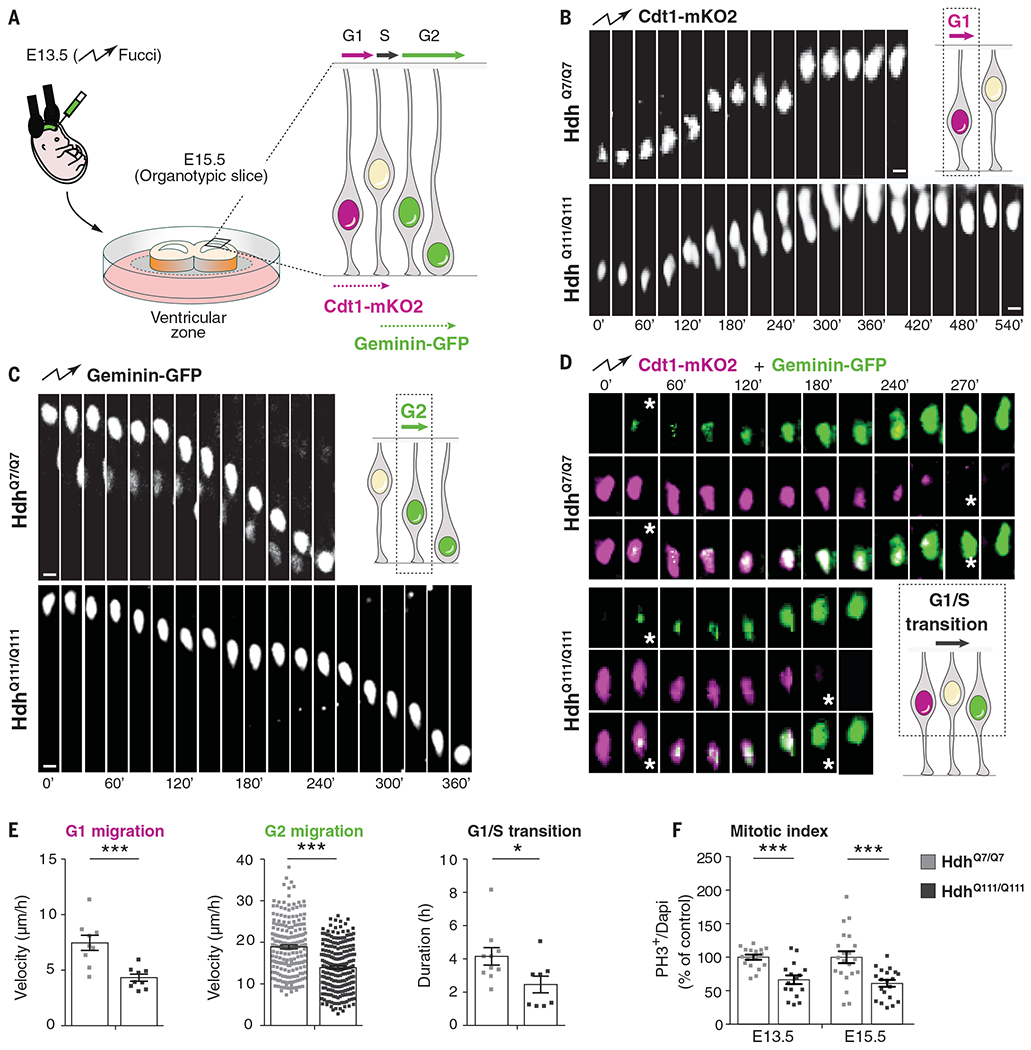
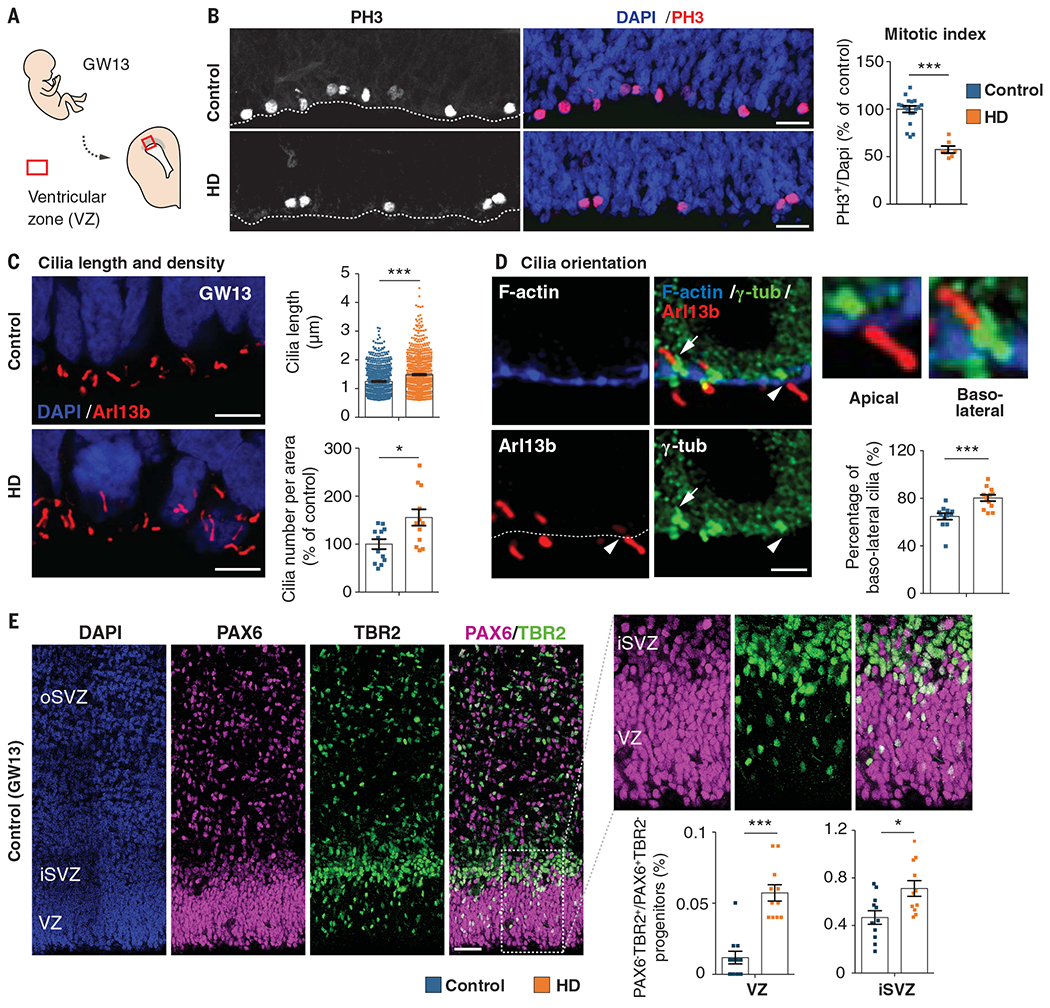
Although Huntington's disease is a late-manifesting neurodegenerative disorder, both mouse studies and neuroimaging studies of presymptomatic mutation carriers suggest that Huntington's disease might affect neurodevelopment. To determine whether this is actually the case, we examined tissue from human fetuses (13 weeks gestation) that carried the Huntington's disease mutation. These tissues showed clear abnormalities in the developing cortex, including mislocalization of mutant huntingtin and junctional complex proteins, defects in neuroprogenitor cell polarity and differentiation, abnormal ciliogenesis, and changes in mitosis and cell cycle progression. We observed the same phenomena in Huntington's disease mouse embryos, where we linked these abnormalities to defects in interkinetic nuclear migration of progenitor cells. Huntington's disease thus has a neurodevelopmental component and is not solely a degenerative disease.


Conflict of interest statement

Competing interests: None declared.

Figures

Fig. 1.
Fig. 1.. Huntingtin and junctional complex proteins mislocalize in the ventricular zone of human fetuses carrying HD-causing mutations.
(A) Left: Diagram showing the position of the fetal ventricular zone relative to the cortical plate (CP). Right: Coronal brain sections of GW13 control human cortex were counterstained with 4′,6-diamidino-2-phenylindole (DAPI). The dotted square shows the region imaged in (B). Scale bar, 100 μm. (B) Left: Coronal GW13 brain sections from control fetus and fetus carrying HD-causing mutation were immunostained for HTT. Scale bars, 10 μm. Right: Representative line-scan analysis (relative fluorescence intensity) of HTT immunostaining and quantification of apical/basal human HTT fluorescence intensity in the ventricular zone. For each condition, n = 3 fetuses from different mothers; ***P = 0.0044 (unpaired t test). (C and D) Coronal GW13 fetal brain sections were immunostained for ZO1 and PAR3 (C) and β-catenin and NCAD (D). Scale bars, 15 μm. (E and F) Representative line-scan analysis (relative fluorescence intensity) of indicated immunostainings (top) and quantification of indicated fluorescence intensities in the ventricular zone (bottom graphs). For each condition, n = 3 fetuses from different mothers. ZO1: ***P = 0.0003 (unpaired t test); PAR3: *P = 0.0177 (unpaired t test); β-cat: ***P = 0.0003 (unpaired t test); NCAD: P = 0.4682 (Mann-Whitney U test), ns (not significant). Results are means ± SEM. VZ, ventricular zone; iSVZ, inner subventricular zone; oSVZ, outer subventricular zone; IZ, intermediate zone; CP, cortical plate. Nuclei were counterstained with DAPI.
Fig. 2.
Fig. 2.. Junctional protein complexes are disrupted in the apical endfeet of HD mouse embryos.
(A) Schematic of the in utero electroporation experiment. (B and C) Mouse embryos were electroporated at E13.5 with a pCAG-GFP construct to delineate the apical endfoot in E15.5 cortices. (B) HdhQ7/Q7 and HdhQ111/Q111 cortical sections were immunostained for GFP (left) and for HTT and GFP (right). White arrowheads point to apical endfeet. Nuclei were counterstained with DAPI. (C) Left: Diagram indicating the position of junctional complexes at the apical endfeet. Right: Cortical sections were immunostained for GFP, ZO1, and PAR3 (upper panel) and GFP, NCAD, and β-Cat (lower panel). Scale bars, 5 μm (B), 2 μm (C). (D) ZO1, PAR3, NCAD, β-catenin, and vinculin immunoblotting analyses of lysates from E15.5 HdhQ7/Q7 and HdhQ111/Q111 cortices. Bar graphs correspond to the quantitative evaluation of the indicated proteins. For each condition, n = at least 7 embryos from different mothers. ZO1: **P = 0.0026; PAR3: **P = 0.0075; NCAD: P = 0.1255; β-cat: P = 0.1476 (unpaired t tests). Results are means ± SEM. (E) HTT-associated complexes were immunoprecipitated with the 4C8 antibody from E15.5 HdhQ7/Q7 and HdhQ111/Q111 cortical extracts. Mouse IgG (mIgG) was used as a negative control.
Fig. 3.
Fig. 3.. Interkinetic nuclear migration and mitosis of cortical apical progenitors are impaired in HD mouse embryos.
(A) Schematic of the experiment for analysis of interkinetic nuclear migration. E13.5 HdhQ7/Q7 and HdhQ111/Q111 embryos were electroporated with Cdt1-mKO2 and geminin-GFP constructs. After 48 hours, the movement of the GFP- and mKO2-labeled nuclei was followed by spinning disc microscopy, taking one image every 10 or 15 min for 10 hours. (B to D) Representative images showing the movement of nuclei in G1, G2, and G1/S transition phases as indicated. (D) Stars indicate the beginning and ending of the G1/S transition. Scale bars, 5 μm. (E) Quantitative differences in the velocity of G1-phase nuclei [for each condition, n = 9 cells from three embryos from different mothers; ***P = 0.0008 (unpaired t test)], velocity of G2-phase nuclei [for each condition, n = at least 202 cells from four embryos from different mothers; ***P < 0.0001 (Mann-Whitney U test)], and length of G1/S transition [for each condition, n = at least 8 cells from three embryos from different mothers; *P = 0.0356 (unpaired t test)]. (F) Bar graphs show the percentage of phospho-histone 3 (PH3) cells (mitotic index) of dividing progenitors [E13.5: for each condition, n = at least 2151 cells from four embryos from different mothers, ***P < 0.0001 (unpaired t test); E15.5: for each condition, n = at least 1801 cells from three embryos from different mothers, ***P = 0.0005 (unpaired t test)]. Results are means ± SEM.
Fig. 4.
Fig. 4.. Mutant huntingtin shifts neurogenesis toward neuronal lineage.
(A) Diagram showing the position of the fetal ventricular zone. (B) Cortical sections of GW13 fetuses were immunostained with antibody against phospho-histone 3 (PH3) and the mitotic index was quantified. For each condition, n = at least 1146 cells from three fetuses from different mothers; ***P < 0.0001 (Mann-Whitney U test). Scale bars, 25 μm. (C) Coronal GW13 brain sections from control fetus and fetus carrying HD-causing mutation (HD) were immunostained for the cilia marker Arl13b. Scale bars, 5 μm. Bar graphs show cilia length [for each condition, n = at least 770 cilia from four fetuses from different mothers; ***P < 0.0001 (Mann-Whitney U test)] and cilia density [for each condition, n = 4 fetuses from different mothers; *P = 0.0104 (unpaired t test)] at the apical surface. (D) Coronal brain sections of GW13 human cortex were immunostained for F-actin, γ-tubulin (γ-tub), and Arl13b. Scale bars, 2 μm. White arrowheads and white arrows show apical and basolateral cilia, respectively. Bar graph shows the percentage of basolateral cilia at the apical surface. For each condition, n = at least 260 cilia from four fetuses from different mothers; ***P = 0.0003 (Mann-Whitney U test). (E) Typical PAX6 and TBR2 staining of a GW13 human fetal sample analyzed. Scale bars, 50 μm. Bar graphs show the percentage of PAX6/TBR2-positive cells (PAX6+/TBR2+) over PAX6-positive, TBR2-negative (PAX6+/TBR2) progenitors [for each condition, three fetuses from different mothers were analyzed; VZ, n = at least 2447 cells, ***P < 0.0001 (Mann-Whitney U test); iSVZ, n = at least 1580 cells, *P = 0.011 (unpaired t test). Results are means ± SEM. Nuclei were counterstained with DAPI.

Comment in

References

    1. Duyao MP et al., Science 269, 407–410 (1995). - PubMed
    1. Zeitlin S, Liu JP, Chapman DL, Papaioannou VE, Efstratiadis A, Nat. Genet 11, 155–163 (1995). - PubMed
    1. Reiner A, Dragatsis I, Zeitlin S, Goldowitz D, Mol. Neurobiol 28, 259–276 (2003). - PubMed
    1. Godin JD et al., Neuron 67, 392–406 (2010). - PubMed
    1. McKinstry SU et al., J. Neurosci 34, 9455–9472 (2014). - PMC - PubMed

Publication types

Substances