. 2020 Jul 17;369(6501):276-282.
doi: 10.1126/science.aaz2193.

Cancer cells deploy lipocalin-2 to collect limiting iron in leptomeningeal metastasis

Affiliations

Cancer cells deploy lipocalin-2 to collect limiting iron in leptomeningeal metastasis

Yudan Chi et al. Science. .

Abstract

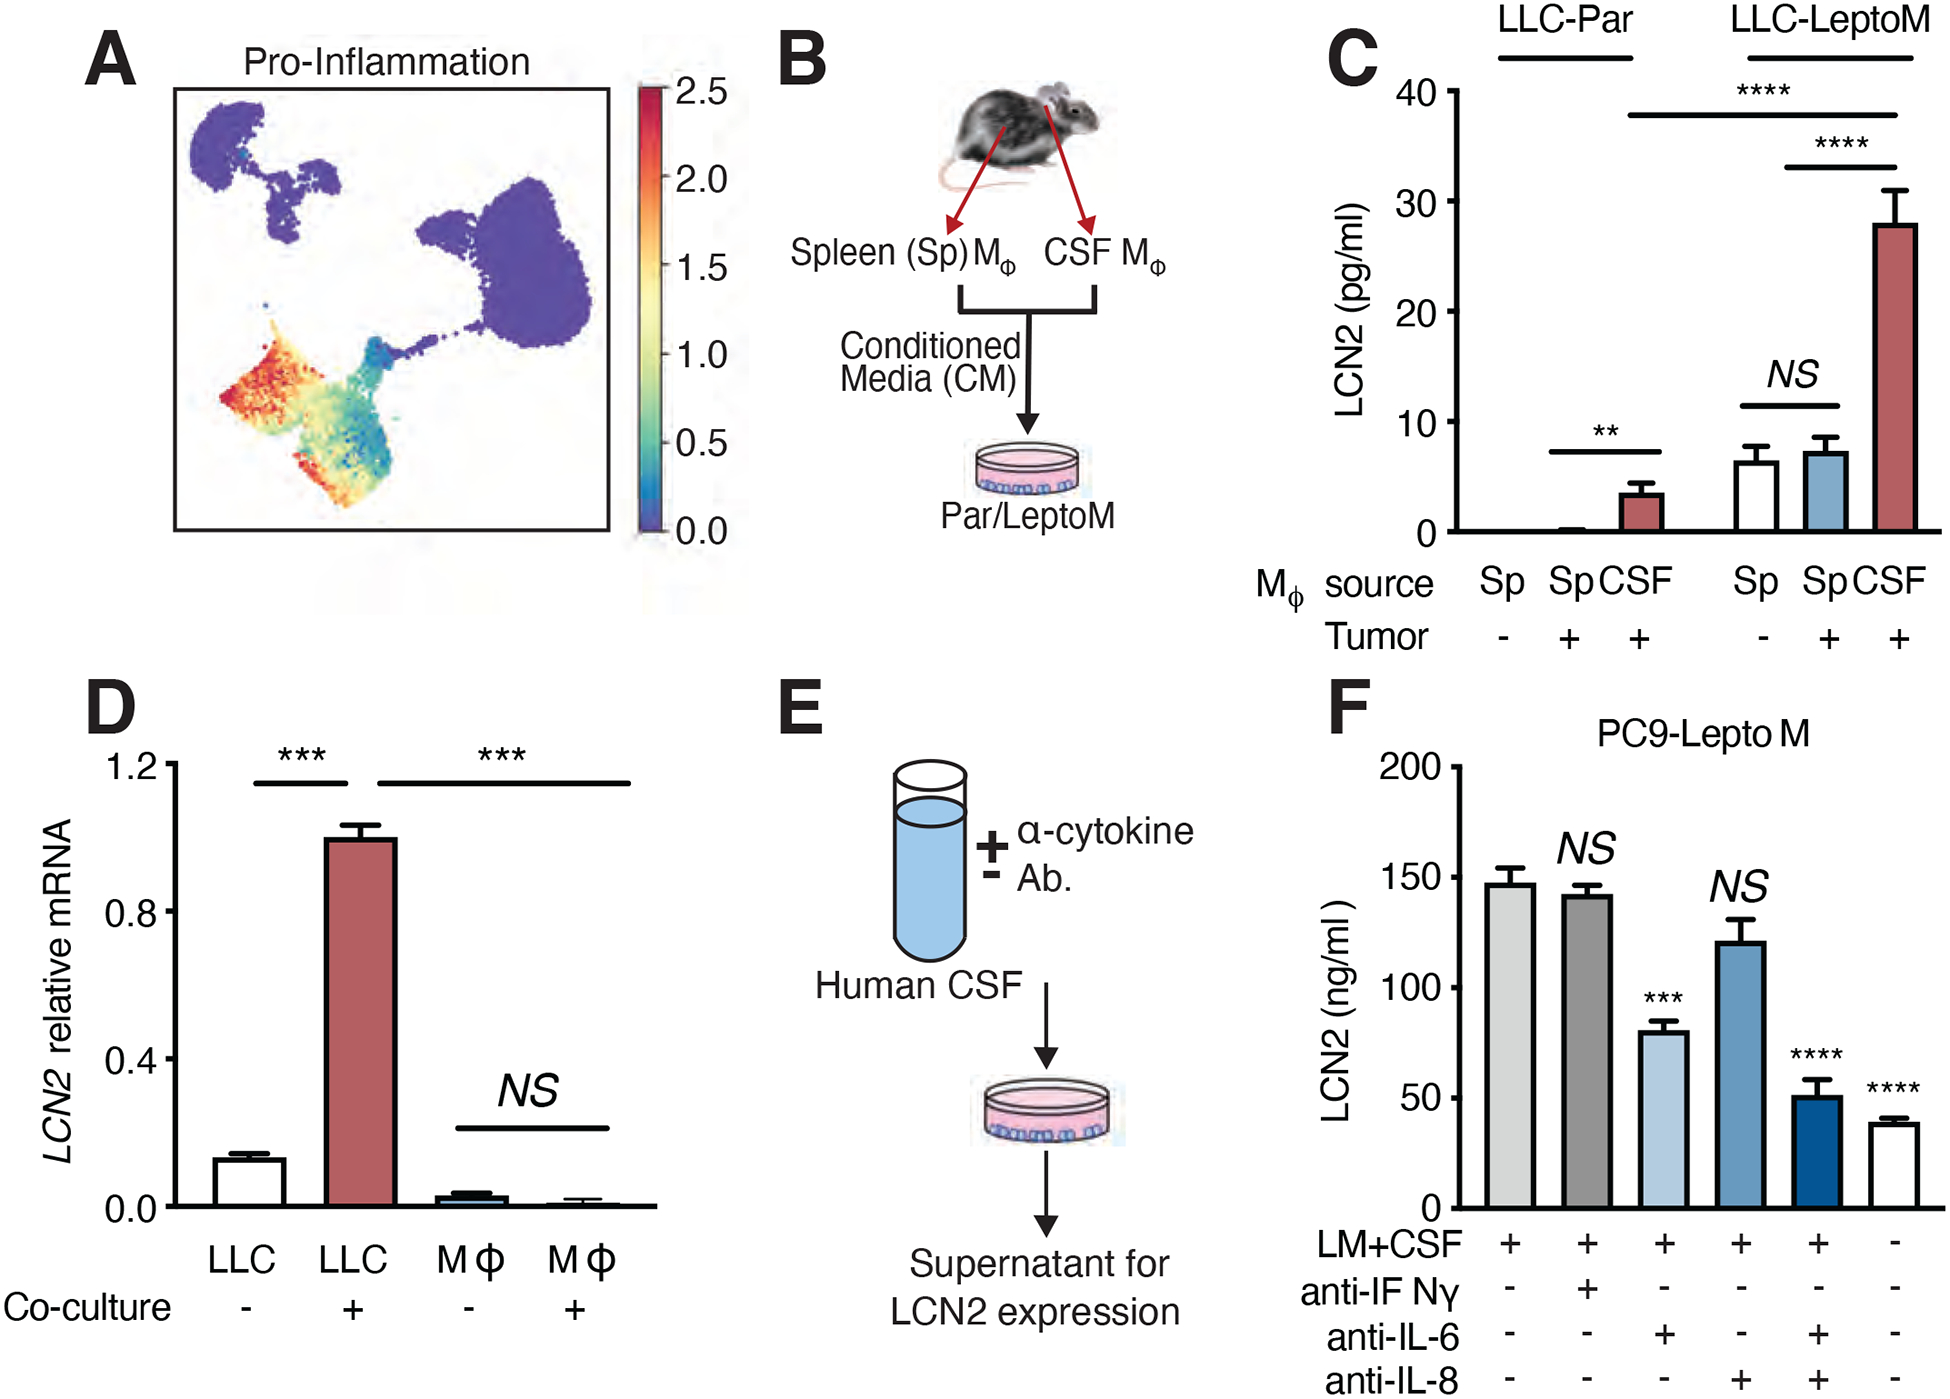
The tumor microenvironment plays a critical regulatory role in cancer progression, especially in central nervous system metastases. Cancer cells within the cerebrospinal fluid (CSF)-filled leptomeninges face substantial microenvironmental challenges, including inflammation and sparse micronutrients. To investigate the mechanism by which cancer cells in these leptomeningeal metastases (LM) overcome these constraints, we subjected CSF from five patients with LM to single-cell RNA sequencing. We found that cancer cells, but not macrophages, within the CSF express the iron-binding protein lipocalin-2 (LCN2) and its receptor SCL22A17. These macrophages generate inflammatory cytokines that induce cancer cell LCN2 expression but do not generate LCN2 themselves. In mouse models of LM, cancer cell growth is supported by the LCN2/SLC22A17 system and is inhibited by iron chelation therapy. Thus, cancer cells appear to survive in the CSF by outcompeting macrophages for iron.


Conflict of interest statement

Competing interests: A.B. is an inventor on United States Provisional Patent Application No.: 62/258,044 “Modulating Permeability of The Blood Cerebrospinal Fluid Barrier” filed by Memorial Sloan Kettering Cancer Center. A.B. is an unpaid member of the Scientific Advisory Board of EVREN Technologies.

Figures

Fig. 1.
Fig. 1.. Sparse CSF iron promotes LCN2 expression in cancer cells.
(A) Human LM from breast cancer (Patient B). White plaques of LM visualized by magnetic resonance imaging (right-top panel), Giemsa-stained cytospin of CSF (right-bottom panel). Major cell populations are indicated. (B) Single-cell transcriptional map of cancer and immune cells present in CSF of five patients, projected with uniform manifold approximation and projection (UMAP). Each dot represents a cell, colored by PhenoGraph cluster; major cell types are manually annotated according to fig. S1. Each individual patient is projected in fig. S2. (C and D) LCN2 and SLC22A17 gene expression in LM patients. Violin plots of LCN2 (C) and SLC22A17 (D) imputed gene expression in cells from individual patients. All cells grouped into 3 compartments – cancer cells (cancer patients A-E), lymphoid cells (CD4+ T cells, CD8+ T cells, B cells, NK cells) and myeloid cells (Monocyte 1, Monocyte 2, Macrophage, conventional dendritic cells (cDCs), plasmacytoid dendritic cells (pDCs)). (E and F) LCN2 (E) and SLC22A17 (F) Detection by immunofluorescent (IF) staining of leptomeninges collected at autopsy from patients harboring LM. Cytokeratin (white) indicates cancer cells. Macrophages are indicated by the macrophage-specific proteins CD68 or ionized calcium binding adaptor molecule 1 (IBA1) in green. LCN2 and SLC22A17 are shown in red. n = 3 cancer patients. Scale bars, 50 μm. (G and H) LCN2 (G) and SLC22A17 (H) expression, assessed by cytospin staining of cancer cells and macrophages in CSF collected post-mortem from patients in E and F. Scale bars, 20 μm.
Fig. 2.
Fig. 2.. LCN2 supports cancer cell growth in the leptomeninges.
(A) Mouse model of LM. Left: In vivo bioluminescence imaging (BLI) of the LLC model at day 14 post intracardiac dissemination. Middle: Immunohistochemistry (IHC) for pan-cytokeratin. Scale Bar, 1000 μm in larger picture; 50 μm in inset. Right: t-distributed stochastic neighbor embedding (tSNE) of multicolor flow cytometry of CSF collected from syngeneic LLC mouse model (day 14), major cell types indicated as follows: cancer cell (CD45); orange, neutrophil (CD45+CD11b+Ly6G+); purple, lymphocyte (CD45+CD3+); green, myeloid cell (CD45+CD11b+ excluding neutrophils); blue, and other leukocytes (CD45+CD11bLy6GCD3); red. n = 5 mice. Representative sample is shown. (B) Tumor growth in mice injected with PC9-LeptoM cells expressing either shCtl or shLCN2. Two independent shRNAs (sh1 and sh2) were employed to target human LCN2. Left: Histogram represents in vivo BLI imaging post-inoculation at day 28. n = 8–10 per group in each of two independent experiments. Right: Representative BLI images. *** indicates p < 0.001 (unpaired t test). Data represent mean ± SEM. (C) Kaplan-Meier survival curve of mice shown in (B). p < 0.0001. (D) Tumor growth in mice injected with PC9-LeptoM cells expressing either shCtl or shSLC22A17. Two independent shRNAs (sh1 and sh2) were employed to target human SLC22A17. Left: Histogram represents in vivo BLI imaging at day 28 post-inoculation. n = 8–10 per group in each of two independent experiments. Right: Representative BLI images. * indicates p < 0.05, **** indicates p < 0.0001 (Unpaired t test). Data represent mean ± SEM. (E) Kaplan-Meier survival curve of mice shown in (D). p < 0.0001. (F) Tumor growth in mice injected with PC9-Par cells expressing either green fluorescent protein (GFP) or LCN2. Left: Histogram represents in vivo BLI imaging post-inoculation at day 21. n = 8–10 per group in each of two independent experiments. Right: Representative BLI images. * indicates p < 0.05 (unpaired t test). Data represent mean ± SEM. (G) Kaplan-Meier survival curve of mice shown in (F). p < 0.0001.
Fig. 3.
Fig. 3.. Cancer cells generate LCN2 in response to inflammatory cytokines.
(A) Mean expression of canonical pro-inflammatory cytokines from single-cell transcriptomics. Markov affinity-based graph imputation of cells (MAGIC)-imputed cytokine expression was standardized to zero mean and unit of standard deviation. Please also refer to pro-inflammatory cytokine dataset provided in Table S5. (B) Schematic for cancer cell co-culture with supernatant from macrophages in LLC-LeptoM model. Conditioned media was collected from macrophages, freshly sorted from CSF or spleen of C57Bl/6 mice harboring LLC-LeptoM cells or no cancer by fluorescence-activated cell sorting (FACS) and added to cultures of Par cells or LeptoM cells for 14 days, exchanging fresh conditioned media every 3 days. (C) Evaluation of LCN2 levels by enzyme-linked immunosorbent assay (ELISA) in conditioned media generated as per (B). n = 3 in each of two independent experiments. NS = not significant, ** indicates p < 0.01, **** indicates p < 0.0001 (unpaired t test). Data represent mean ± SEM. (D) LCN2 mRNA detection by qPCR in CSF-derived macrophages and LLC-LeptoM cells after co-culture at day 14. n = 3 in each of two independent experiments. NS = not significant, *** indicates p < 0.001 (unpaired t test). Data represent mean ± SEM. (E and F) CSF from patients harboring LM was treated with neutralizing antibodies against IL-6, IL-8, or IFNγ and added to PC9-LeptoM cells for 12 hours. LCN2 was quantified by ELISA in conditioned media 24 hours after removing CSF. n = 3 in each of two independent experiments. NS = not significant, *** indicates p < 0.001, **** indicates p < 0.0001 (unpaired t test). Data represent mean ± SEM.
Fig. 4
Fig. 4. LCN2 supports cancer cell growth in the hypoxic CSF microenvironment.
(A and B) Correlation between hypoxia and iron ion transport gene signatures. Axis value represents mean gene signature expression per cell, standardized to have zero mean and unit of standard deviation. Each dot represents a cell, colored by cell type; please also refer to Fig 1B. (B) Cancer cell populations from (A) alone. (C) Gene set enrichment (GSA) analysis of PC9 and LLC models by bulk RNA sequencing of LeptoM shCtl and shLCN2. Number of significantly upregulated (red) and downregulated (blue) genes in GSA analysis are indicated on the x axis. n = 2 per group. p < 0.05. Please also refer to Fig. S7B. (D) Leptomeningeal tumor growth in a dual reporter in vivo system. PC9-LeptoM cells express Firefly luciferase (Fluc) constitutively; NanoLuc (Nluc) is induced downstream of hypoxia response element (HRE). Left: Fluc and Nluc are assayed by BLI at indicated time points. Right: representative BLI images at day 0 and day 7. n = 8–10 per group in each of two independent experiments. Data represent mean ± SEM. (E) Leptomeningeal tissue sections stained with hematoxylin and eosin (H&E) and IHC for LCN2, hypoxia-inducible factors (HIF) HIF-1α and HIF-2α in PC9-LeptoM model. Scale bar, 50 μM.
Fig. 5
Fig. 5. LCN2 transports iron to support cancer cell growth.
(A) Tumor growth in mice injected with MDA231-LeptoM cells expressing shCtl or shLCN2. Treatment with either vehicle or 5 mg/mL holo-transferrin (diferric [Tf]) began on day 1 and continued every third day for a total of 7 doses. Left: Histogram represents in vivo BLI imaging post-inoculation at day 21. n = 8–10 per group in each of two independent experiments. Right: Representative BLI images. ** indicates p < 0.01 (unpaired t test). Data represent mean ± SEM. (B) Kaplan-Meier survival curve of LeptoM groups from (A). sh1 + Veh vs sh1 + Tf , p < 0.0001. sh2 + Veh vs sh2 + Tf, p < 0.0001. (C) Soluble iron concentration from macrophages collected from CSF in lipopolysaccharide (LPS)-stimulated, LeptoM or LeptoM-shLCN2 (sh1 and sh2) mouse model at day 14. Soluble iron was measured by mass spectroscopy. n = 4 per group. ** indicates p < 0.01, *** indicates p < 0.001, **** indicates p < 0.0001 (unpaired t test). Data represent mean ± SEM. (D and E) Phagocytosis (D) and reactive oxygen species (ROS) generation (E) in CSF-derived macrophages by flow cytometric analysis after LeptoM (LLC model), shLCN2 LPS, or vehicle (Ctl) treatment. Phagocytosis detected by FITC-labeled E. coli. CellROX Green+ cells represent percent of live cells with ROS. n = 12–15 (Ctl), n = 4–5 (LPS), n = 11–18 (LeptoM), n = 8 (shLCN2). NS = not significant, * indicates p < 0.05, ** indicates p < 0.01, **** indicates p < 0.0001 (unpaired t test). Data represent mean ± SEM in two independent experiments. (F) Tumor growth in MDA231-LeptoM model after chelator treatment: deferoxamine (DFO), D-penicillamine (D-Pen) on day 0 (early) or day 7 (late); see also Fig. S11. Left: in vivo BLI imaging in day 28 post-inoculation. n = 8–10 per group in each of two independent experiments. Right: Representative BLI images. **** indicates p < 0.0001. Data represent mean ± SEM. (G) Kaplan-Meier survival curve of mice treated in (F). p < 0.0001.

Comment in

  • Nailing a Fe-rocious form of cancer.
    Garzia L, Taylor MD. Garzia L, et al. Science. 2020 Jul 17;369(6501):250-251. doi: 10.1126/science.abb7041. Science. 2020. PMID: 32675360 No abstract available.
  • Getting your daily iron intake.
    Dart A. Dart A. Nat Rev Cancer. 2020 Oct;20(10):553. doi: 10.1038/s41568-020-0298-2. Nat Rev Cancer. 2020. PMID: 32782368 No abstract available.

References

    1. Kesari S, Batchelor TT, Leptomeningeal metastases. Neurol Clin 21, 25–66 (2003). - PubMed
    1. Oechsle K, Lange-Brock V, Kruell A, Bokemeyer C, de Wit M, Prognostic factors and treatment options in patients with leptomeningeal metastases of different primary tumors: a retrospective analysis. J Cancer Res Clin Oncol 136, 1729–1735 (2010). - PMC - PubMed
    1. Spector R, Robert Snodgrass S, Johanson CE, A balanced view of the cerebrospinal fluid composition and functions: Focus on adult humans. Exp Neurol 273, 57–68 (2015). - PubMed
    1. Subira D et al. , Role of flow cytometry immunophenotyping in the diagnosis of leptomeningeal carcinomatosis. Neuro Oncol 14, 43–52 (2012). - PMC - PubMed
    1. Nemeth E et al. , IL-6 mediates hypoferremia of inflammation by inducing the synthesis of the iron regulatory hormone hepcidin. J Clin Invest 113, 1271–1276 (2004). - PMC - PubMed

Publication types