. 2020 Aug;272(2):288-303.
doi: 10.1097/SLA.0000000000003232.

Hospital Volume and Operative Mortality for General Surgery Operations Performed Emergently in Adults

Affiliations

Hospital Volume and Operative Mortality for General Surgery Operations Performed Emergently in Adults

Robert D Becher et al. Ann Surg. 2020 Aug.

Abstract

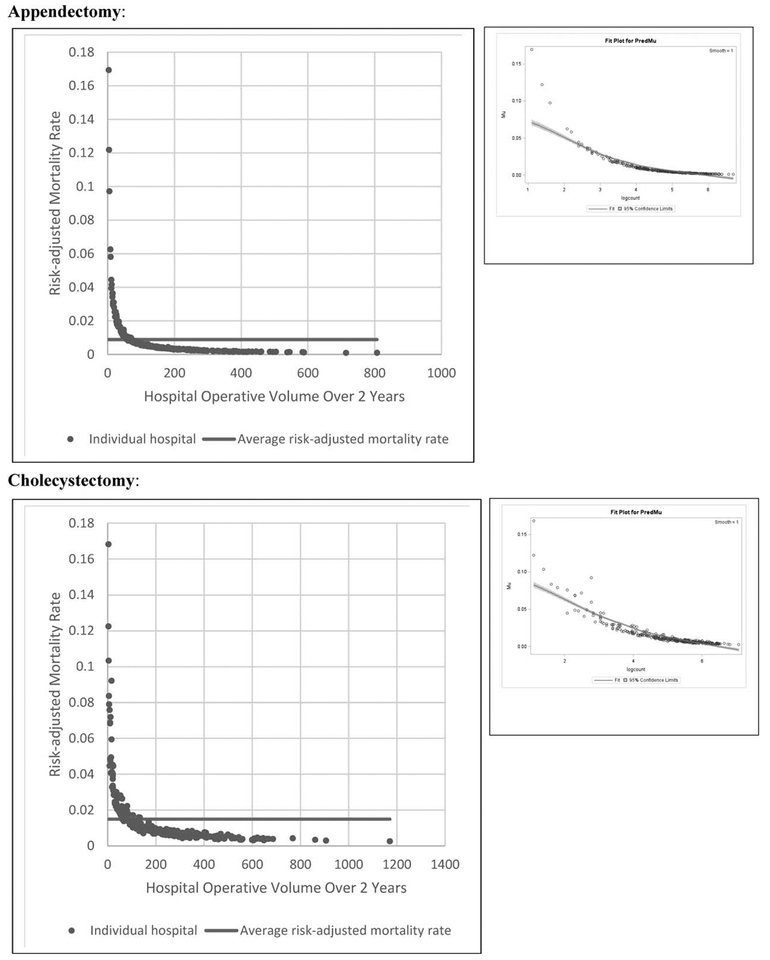
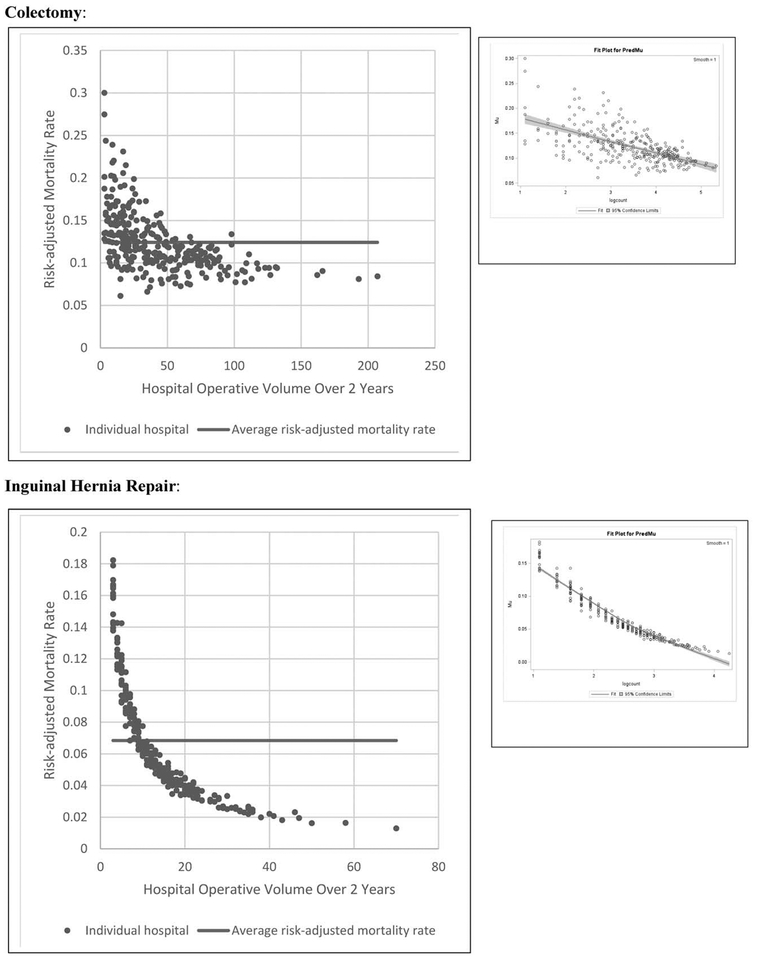
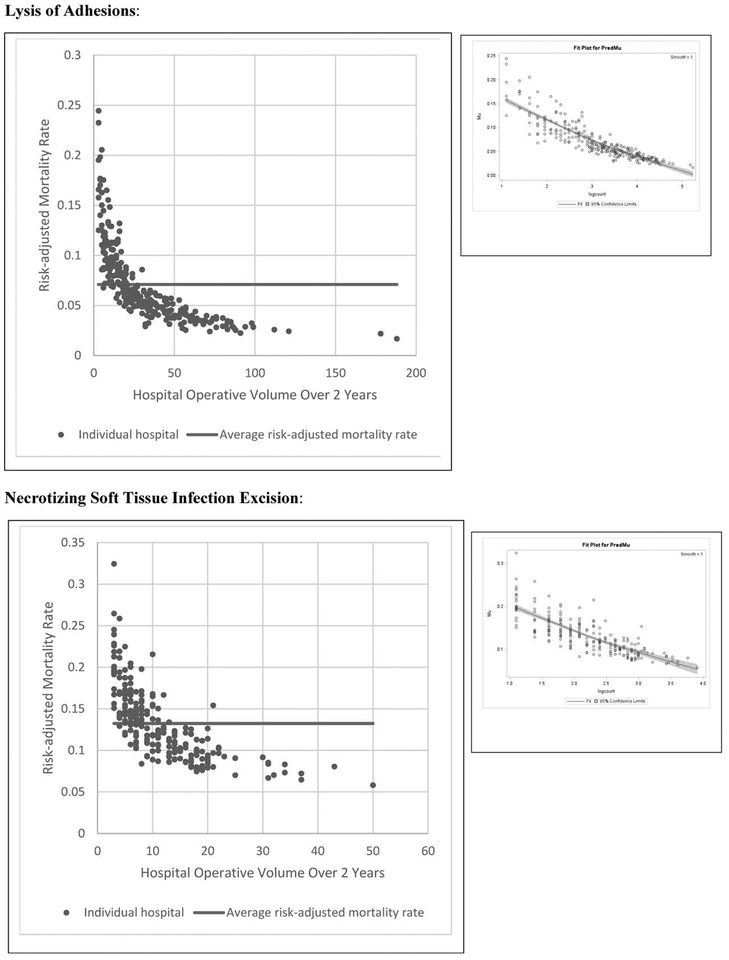
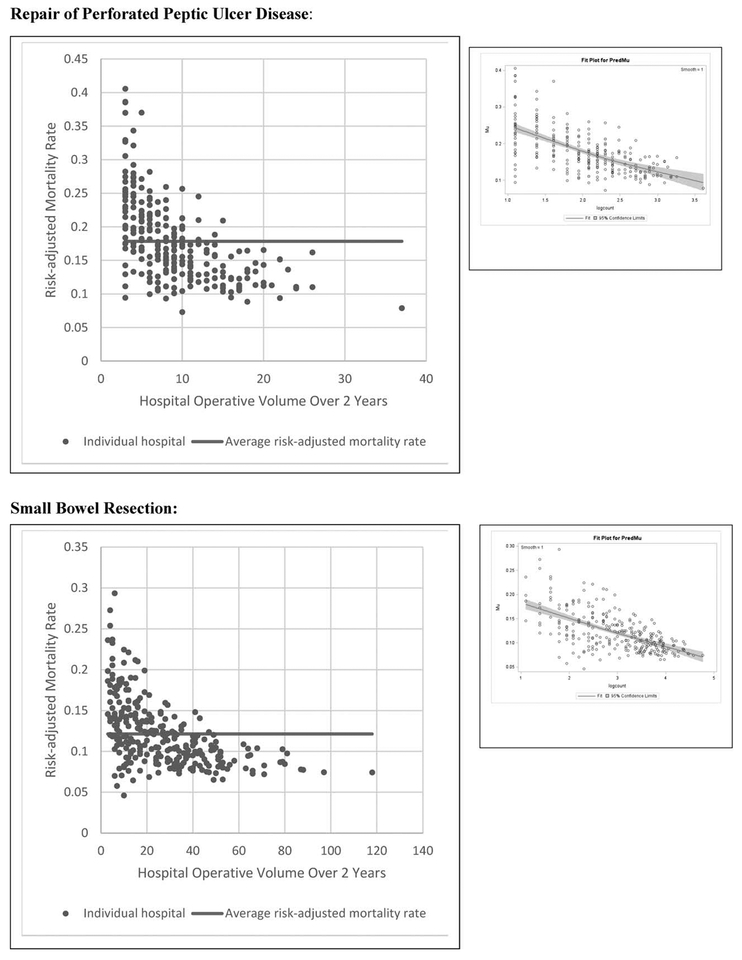
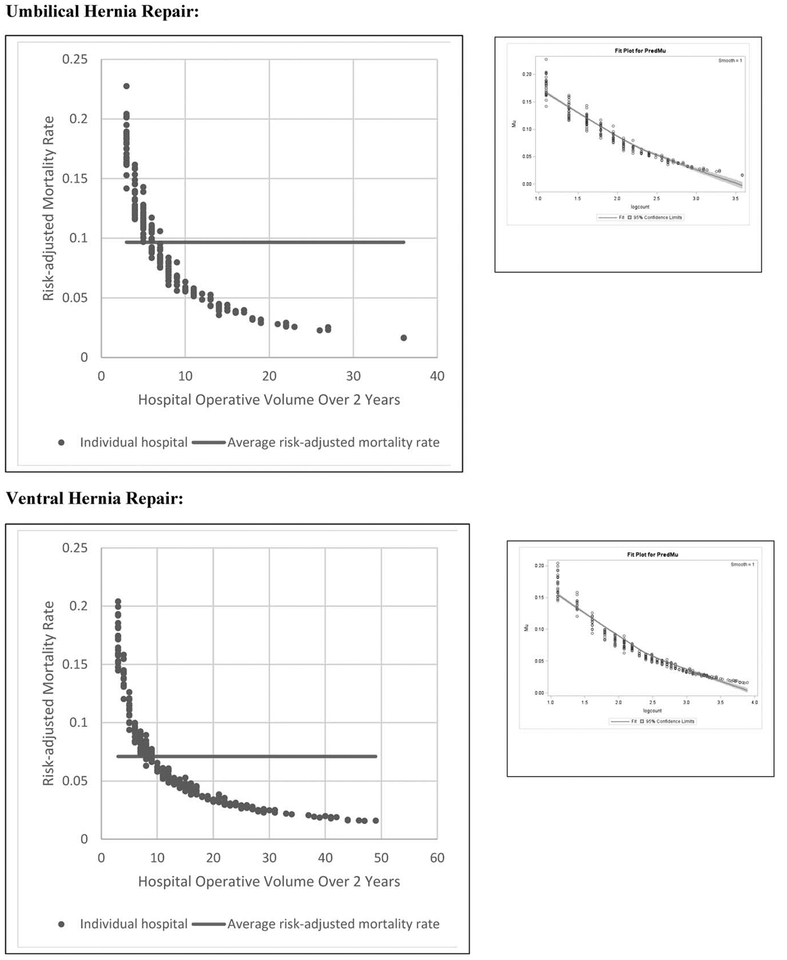
Objective: This study aimed to answer 2 questions: first, to what degree does hospital operative volume affect mortality for adult patients undergoing 1 of 10 common emergency general surgery (EGS) operations? Second, at what hospital operative volume threshold will nearly all patients undergoing an emergency operation realize the average mortality risk?

Background: Nontrauma surgical emergencies are an underappreciated public health crisis in the United States; redefining where such emergencies are managed may improve outcomes. The field of trauma surgery established regionalized systems of care in part because studies demonstrated a clear relationship between hospital volume and survival for traumatic emergencies. Such a relationship has not been well-studied for nontrauma surgical emergencies.

Methods: Retrospective cohort study of all acute care hospitals in California performing nontrauma surgical emergencies. We employed a novel use of an ecological analysis with beta regression to investigate the relationship between hospital operative volume and mortality.

Results: A total of 425 acute care hospitals in California performed 165,123 EGS operations. Risk-adjusted mortality significantly decreased as volume increased for all 10 EGS operations (P < 0.001 for each); the relative magnitude of this inverse relationship differed substantially by procedure. Hospital operative volume thresholds were defined and varied by operation: from 75 cases over 2 years for cholecystectomy to 7 cases for umbilical hernia repair.

Conclusions: Survival rates for nontrauma surgical emergencies were improved when operations were performed at higher-volume hospitals. The use of ecological analysis is widely applicable to the field of surgical outcomes research.


Conflict of interest statement

The authors report no conflicts of interest.

Figures

FIGURE 1.
FIGURE 1.
Two beta fit plots for each of the 10 emergency general surgery operations. The left plot shows the inverse volume to mortality relationship: the x-axis is hospital operative volume over 2 years, the y-axis is risk-adjusted hospital mortality rate, the average risk-adjusted mortality is represented by the flat line, and every dot represents an individual hospital. The right plot is the relationship modeled in our beta regression analyses: the x-axis is natural log-transformed hospital operative volume, the y-axis is risk-adjusted hospital mortality rate, and every dot represents an individual hospital.
FIGURE 1.
FIGURE 1.
Two beta fit plots for each of the 10 emergency general surgery operations. The left plot shows the inverse volume to mortality relationship: the x-axis is hospital operative volume over 2 years, the y-axis is risk-adjusted hospital mortality rate, the average risk-adjusted mortality is represented by the flat line, and every dot represents an individual hospital. The right plot is the relationship modeled in our beta regression analyses: the x-axis is natural log-transformed hospital operative volume, the y-axis is risk-adjusted hospital mortality rate, and every dot represents an individual hospital.

References

    1. American College of Surgeons. A growing crisis in patient access to emergency surgical care. Bull Am Coll Surg. 2006;91:8–19. - PubMed
    1. Trunkey DD. A growing crisis in patient access to emergency care: a different interpretation and alternative solutions. Bull Am Coll Surg. 2006;91:12–22. - PubMed
    1. Maa J Solving the emergency care crisis in America: the power of the law and storytelling. Perm J. 2012;16:71–74. - PMC - PubMed
    1. Gale SC, Shafi S, Dombrovskiy VY, et al. The public health burden of emergency general surgery in the United States: a 10-year analysis of the Nationwide Inpatient Sample—2001 to 2010. J Trauma Acute Care Surg. 2014;77:202–208. - PubMed
    1. Acute Care Congress. Acute care congress on the future of emergency surgical care in the United States. J Trauma. 2009;67:1–7. - PubMed

Publication types