. 2020 Jun 26:11:1268.
doi: 10.3389/fimmu.2020.01268. eCollection 2020.

Contactin-1 Is Required for Peripheral Innervation and Immune Homeostasis Within the Intestinal Mucosa

Affiliations

Contactin-1 Is Required for Peripheral Innervation and Immune Homeostasis Within the Intestinal Mucosa

Marisol Veny et al. Front Immunol. .

Abstract

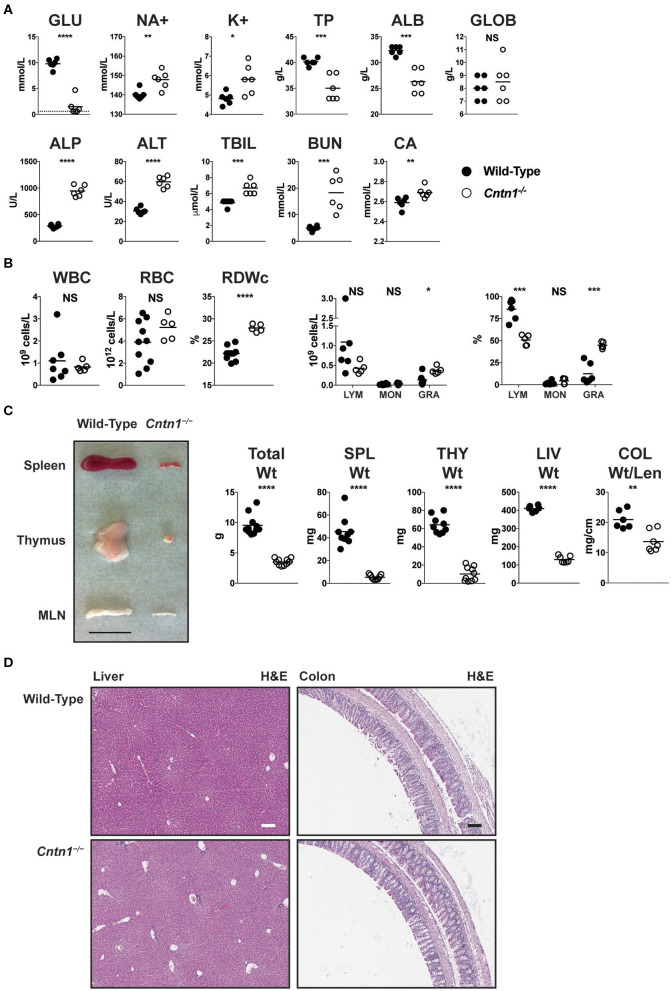
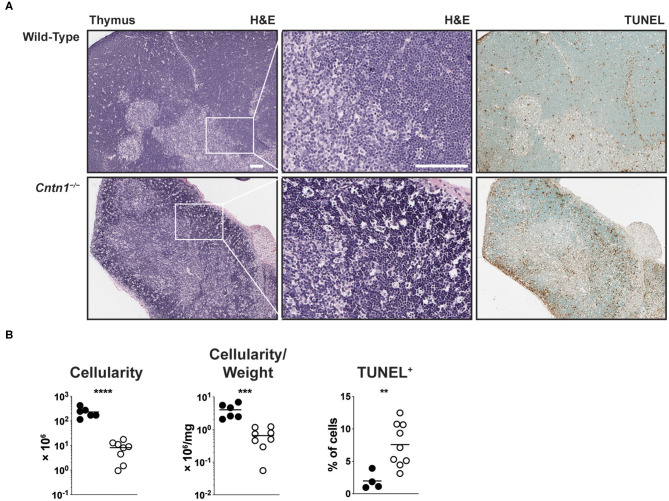
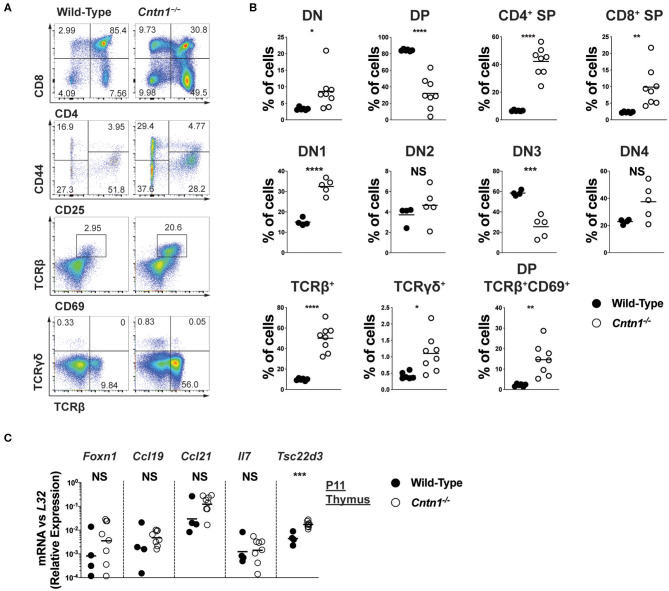
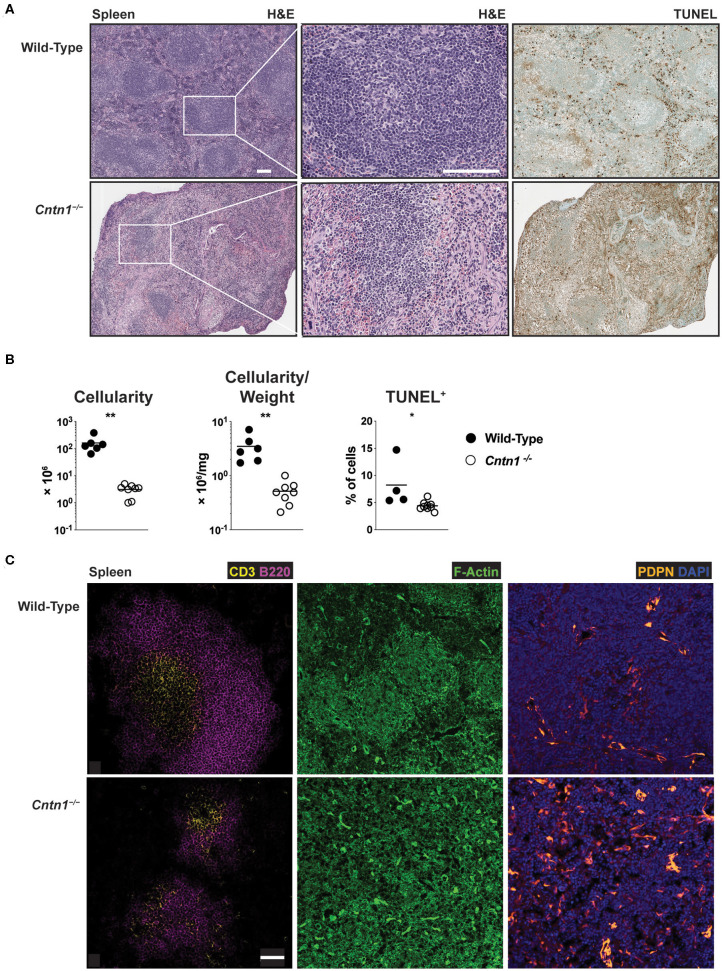
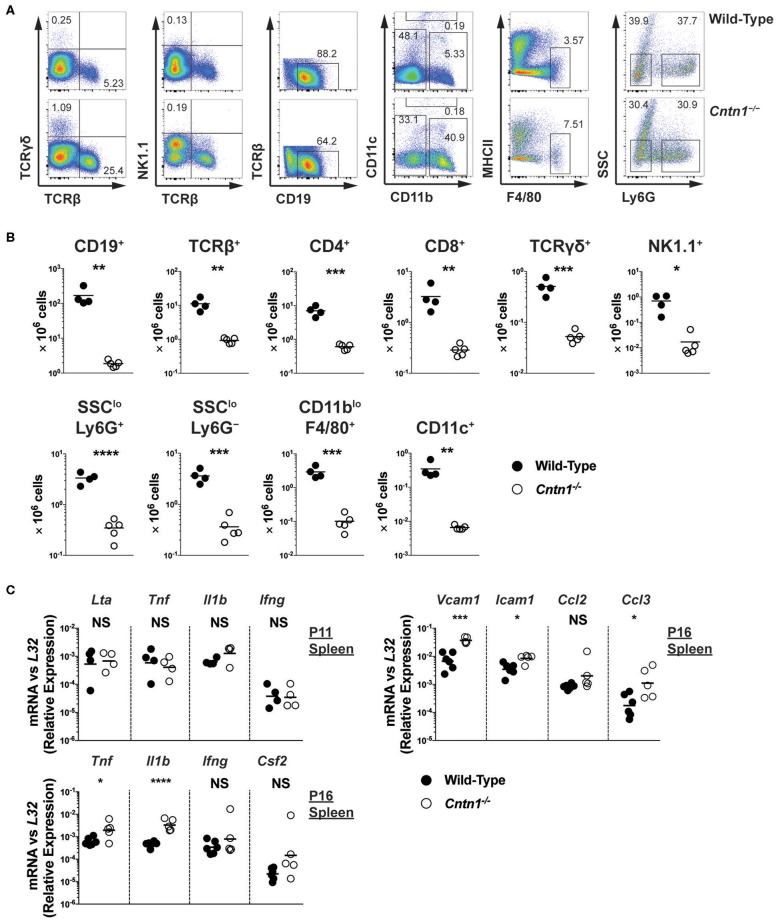
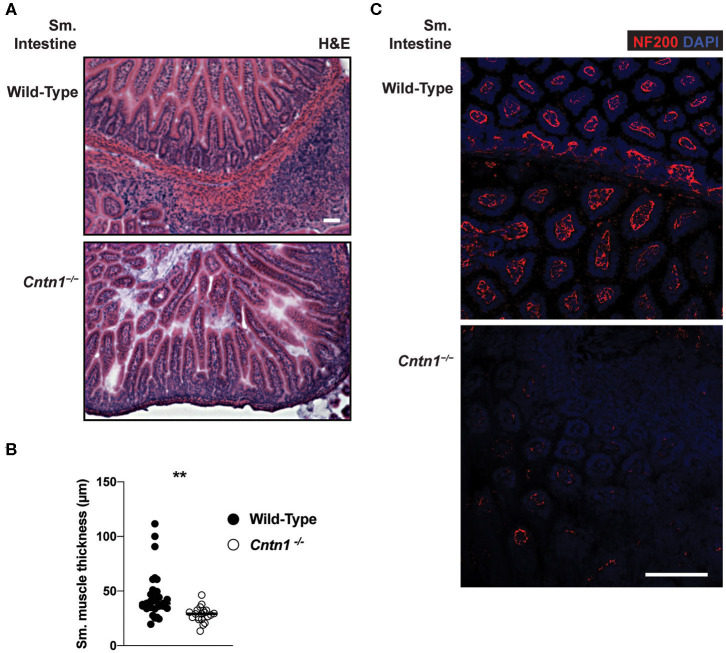
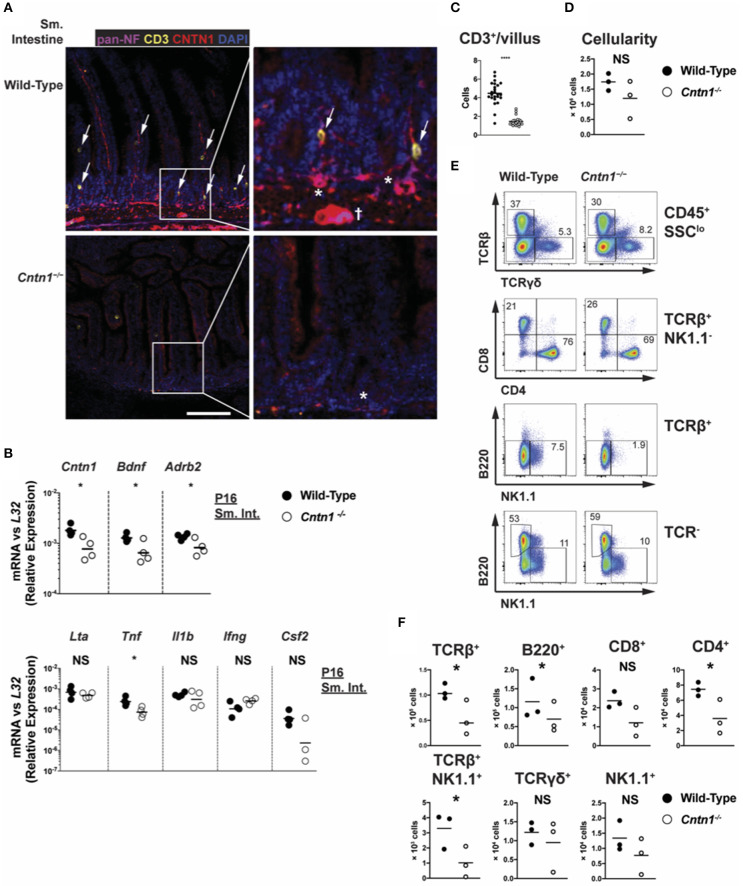
Neuronal regulation of diverse physiological functions requires complex molecular interactions in innervated tissues to maintain proper organ function. Here we show that loss of the neuronal cell surface adhesion/recognition molecule Contactin-1 (Cntn1) directly impairs intestinal function causing wasting that subsequently results in global immune defects. Loss of Cntn1 results in hematologic alterations and changes in blood metabolites associated with malnourishment. We found thymus and spleen of Cntn1-deficient animals atrophied with severe reductions in lymphocyte populations. Elevated thymic Gilz expression indicated ongoing glucocorticoid signaling in Cntn1-deficient animals, consistent with the malnourishment phenotype. Intestinal Contactin-1 was localized to neurons in the villi and the submucosal/myenteric plexus that innervates smooth muscle. Loss of Cntn1 was associated with reduced intestinal Bdnf and Adrb2, indicating reduced neuromuscular crosstalk. Additionally, loss of Cntn1 resulted in reduced recruitment of CD3+ T cells to villi within the small intestine. Together, these data illustrate the critical role of Contactin-1 function within the gut, and how this is required for normal systemic immune functions.

Keywords: T cell; contactin-1; hypothalamus pituitary adrenal (HPA) axis; immune homeostasis; mucosal immunity; neuro-immune crosstalk; small intestine; villi.


Figures

Figure 1
Figure 1
Cntn1−/− animals show hematologic and lymphoid abnormalities prior to expiration. (A) Blood from P16 wild-type and Cntn1−/− animals was analyzed for the indicated chemical paramaters (GLU, glucose; NA+, sodium; K+, potassium; TP, total protein; ALB, albumin; GLOB, globulin; ALP, alkaline phosphatase; ALT, alanine aminotransferase; TBIL, bilirubin; BUN, urea; CA, Calcium). (B) Blood from P16 wild-type and Cntn1−/− animals was analyzed for the indicated cellular paramaters (WBC, white blood cells; RBC, red blood cells; RDWc, RBC distribution width; LYM, lymphocytes; MON, monocytes; GRA, granulocytes). (C) Representative images of spleen, thymus and mesenteric lymph nodes (MLN) harvested from P17 wild-type and Cntn1−/− animals are shown. Graphs show weight of animals, spleens, thymuses, livers, and colon weight/length. (D) Representative images of livers (left) and colons (right) from wild-type (top) and Cntn1−/− (bottom) at 10 × (H&E). White and black scale bars represent 100 μm. Analysis of data by Student's t-test. NS, not significant; *p < 0.05; **p < 0.01, ***p < 0.001; ****p < 0.0001.
Figure 2
Figure 2
Cntn1−/− animals show thymic atrophy prior to expiration. (A) Representative images of P16 thymuses from wild-type (top) and Cntn1−/− (bottom) at 4 × (H&E, upper panels; TUNEL, lower panels) or 10 × (H&E, middle panels). White scale bars represent 100 μm. (B) Graphs show thymus cellularity (left), cellularity normalized to organ weight (middle), or TUNEL+ cells (right) from individual wild-type and Cntn1−/− animals. Analysis of aggregated data by Student's t-test. **p < 0.01, ***p < 0.001; ****p < 0.0001.
Figure 3
Figure 3
Altered thymocyte development in Cntn1−/− mice is associated with elevated glucocorticoid signaling (A,B). Representative FACS analysis of wild-type (left panels) and Cntn1−/− (right panels) thymuses. Total live thymocytes analyzed for the frequency of DN, DP, and CD4+ and CD8+ SP cells (first row), CD4CD8 thymocytes analyzed for the frequency of DN subsets using CD25 vs CD44 (second row), CD69 vs. TCRβ in total thymocytes (third row), and TCRβ vs. TCRγδ in total thymocytes (fourth row) (A). The frequency of thymocyte populations from individual wild-type and Cntn1−/− animals are graphed in (B). Analysis of aggregated data by Student's t-test (C). P11 enriched thymic stromal cells from wild-type and Cntn1−/− animals were harvested for RNA and analyzed for the indicated genes by QRT-PCR. Graphs show transcript abundance relative to L32. Individual transcripts were compared by Student's t-test. NS, not significant; *p < 0.05; **p < 0.01, ***p < 0.001; ****p < 0.0001.
Figure 4
Figure 4
Disorganized architecture of Cntn1-deficient spleens (A). Representative images of spleens from wild-type (left) and Cntn1−/− (right) at 4 × (H&E, upper panels; TUNEL, lower panels) or 10 × (H&E, middle panels). White scale bars represent 100 μm (B). Graphs show spleen cellularity (left), cellularity normalized to organ weight (middle), or TUNEL+ cells (right) from individual wild-type and Cntn1−/− animals. Analysis of aggregated data by Student's t-test (C). Representative immunofluorescence images of spleens from wild-type (top) and Cntn1−/− (bottom) costaining for CD3 (yellow) and B220 (magenta) (left panels, 4 ×), F-actin (phalloidin-green) (middle panels, 4 ×), and PDPN (orange) and DAPI (blue) (right panels, 4 ×). White scale bar represents 50 μm. *p < 0.05; **p < 0.01.
Figure 5
Figure 5
Hypocellularity and increased inflammatory signaling in Cntn1−/− spleens (A,B). Representative FACS analysis of wild-type (top) and Cntn1−/− (bottom) P16 spleens. Total live splenocytes analyzed for the frequency of αβ T cells (TCRβ+) and γδ T cells (TCRγδ+), natural killer cells (TCRβNK1.1+), TCRβTCRγδ cells for the frequency of B cells (CD19+), TCRβNK1.1 cells for the frequency of dendritic cells (CD11chi), TCRβNK1.1CD11cCD11blo cells for the frequency of macrophages (F4/80+MHCIIlo), and TCRβNK1.1CD11cCD11bhi cells for the frequency of neutrophils (Ly6G+SSClo) and monocyte containing populations (Ly6GSSClo) (A). Lineage gating was structured according to previously reported analysis (24). The frequency of individual splenocyte populations are graphed in (B). Analysis of data by Student's t-test (C). P11 and P16 splenic tissue from wild-type and Cntn1−/− animals was harvested for RNA and analyzed for the indicated genes by QRT-PCR. Graphs show transcript abundance relative to L32. Individual transcripts were compared by Student's t-test. NS, not significant; *p < 0.05; **p < 0.01; ***p < 0.001; ****p < 0.0001.
Figure 6
Figure 6
Altered neuromuscular homeostasis in Cntn1-/- small intestine (A) Representative images of P11 small intestine from wild-type (top) and Cntn1−/− (bottom) at 10 × (H&E). White scale bars represent 50 μm (B). Graph shows measurements of smooth muscle thickness in histology sections. From wild-type and Cntn1−/− animals. Analysis of aggregated data by Student's t-test (C) Representative immunofluorescence images of small intestine from wild-type (top) and Cntn1−/− (bottom) costained for NF200 (red) and DAPI (blue) White scale bar represents 50 μm. **p < 0.01.
Figure 7
Figure 7
Cntn1 expression within intestinal villi and submucosal/myenteric plexus (A). Representative immunofluorescence images of P11 small intestine from wild-type (top panels) and Cntn1−/− (bottom panels) at 4 ×. Tissues were costained for pan-Neurofilament (magenta), CD3 (yellow), Cntn1 (red), and DAPI (blue). Composite images are shown at left with enlarged areas indicated at right. White scale bars represent 50 μm. arrows indicate CD3+ cells that are in contact with Cntn1+ neurons. * indicates submucosal plexus, dagger indicates myenteric plexus (B) Wild-type and Cntn1−/− P16 small intestine tissues were harvested for RNA and analyzed for the indicated genes by QRT-PCR. Graphs show transcript abundance relative to L32. Individual transcripts were compared by Student's t-test (C). The average number of CD3+ T cells divided by the average number of villi per visual field was quantified and graphed (D). Graph shows intestine cellularity from wild-type and Cntn1−/− animals (E,F). Representative FACS analysis of wild-type (left) and Cntn1−/− (right) P12/P13 intestinal lymphocytes. Total live intestinal lymphocytes analyzed for the frequency of αβ T cells (TCRβ+) and γδ T cells (TCRγδ+), CD4+ and CD8+ αβ T cells, NK1.1+TCRβ+ cells, natural killer cells (TCRβNK1.1+), and B cells (B220+) (E). The cellularity of each lymphocyte population is graphed in (F). Analysis of data by Student's t-test. NS, not significant; *p < 0.05; ****p < 0.0001.

References

    1. Gennarini G, Bizzoca A, Picocci S, Puzzo D, Corsi P, Furley AJW. The role of Gpi-anchored axonal glycoproteins in neural development and neurological disorders. Mol Cell Neurosci. (2017) 81:49–63. 10.1016/j.mcn.2016.11.006 - DOI - PubMed
    1. Chatterjee M, Schild D, Teunissen CE. Contactins in the central nervous system: role in health and disease. Neural Regen Res. (2019) 14:206–16. 10.4103/1673-5374.244776 - DOI - PMC - PubMed
    1. Ranscht B. Sequence of contactin, a 130-kD glycoprotein concentrated in areas of interneuronal contact, defines a new member of the immunoglobulin supergene family in the nervous system. J Cell Biol. (1988) 107:1561–73. 10.1083/jcb.107.4.1561 - DOI - PMC - PubMed
    1. Brummendorf T, Wolff JM, Frank R, Rathjen FG. Neural cell recognition molecule F11: homology with fibronectin type III and immunoglobulin type C domains. Neuron. (1989) 2:1351–61. 10.1016/0896-6273(89)90073-1 - DOI - PubMed
    1. Gennarini G, Cibelli G, Rougon G, Mattei MG, Goridis C. The mouse neuronal cell surface protein F3: a phosphatidylinositol-anchored member of the immunoglobulin superfamily related to chicken contactin. J Cell Biol. (1989) 109:775–88. 10.1083/jcb.109.2.775 - DOI - PMC - PubMed

Publication types

MeSH terms