[Preprint]. 2020 Jul 10:2020.07.09.194027.
doi: 10.1101/2020.07.09.194027.

Severely ill COVID-19 patients display augmented functional properties in SARS-CoV-2-reactive CD8 + T cells

Affiliations

Severely ill COVID-19 patients display augmented functional properties in SARS-CoV-2-reactive CD8 + T cells

Anthony Kusnadi et al. bioRxiv. .

Update in

Abstract

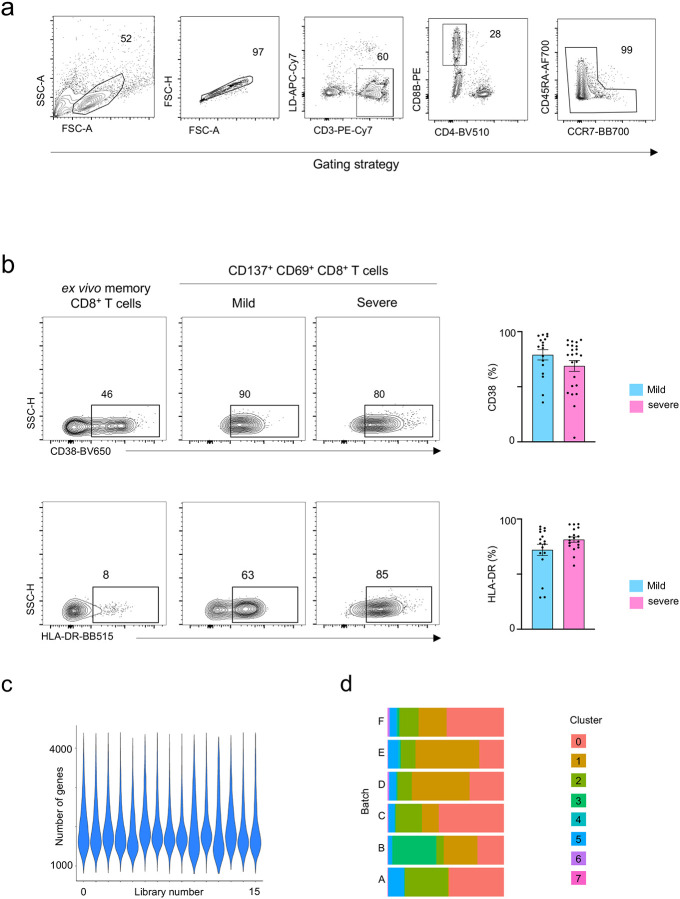
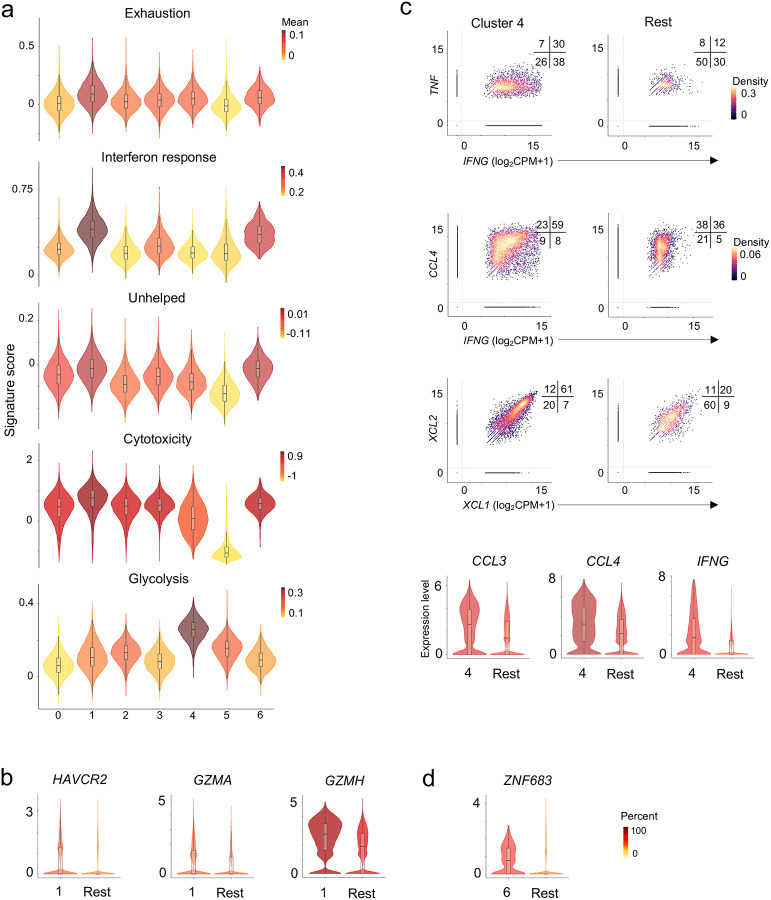
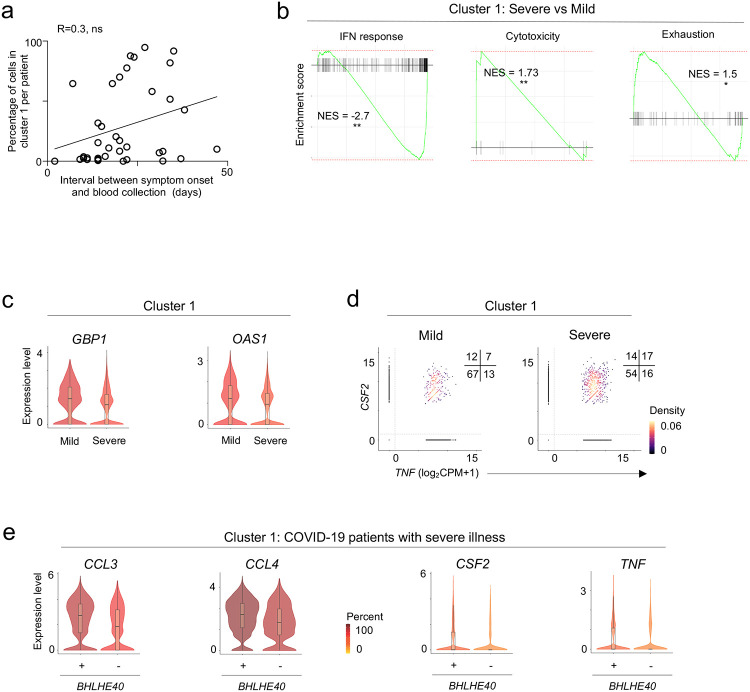
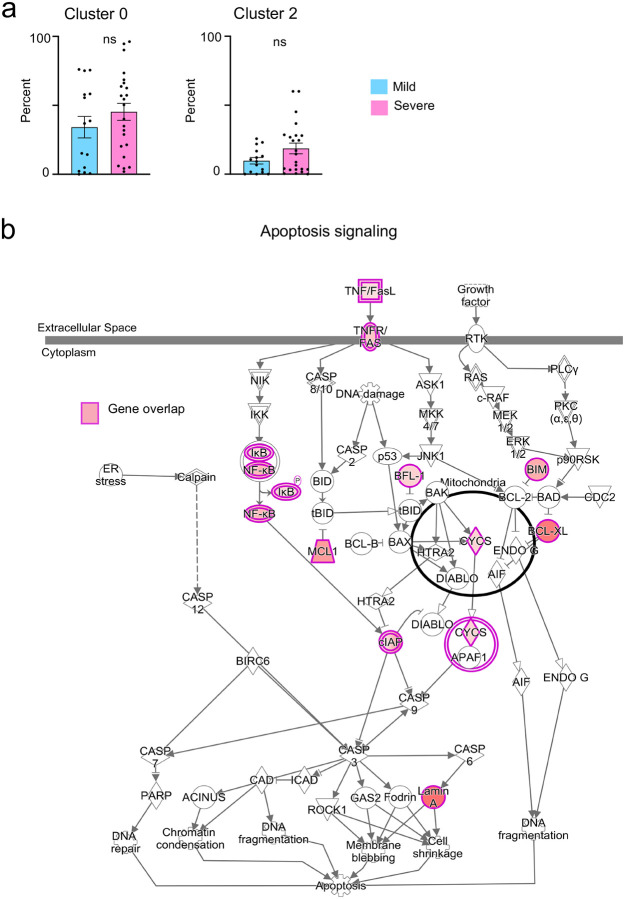
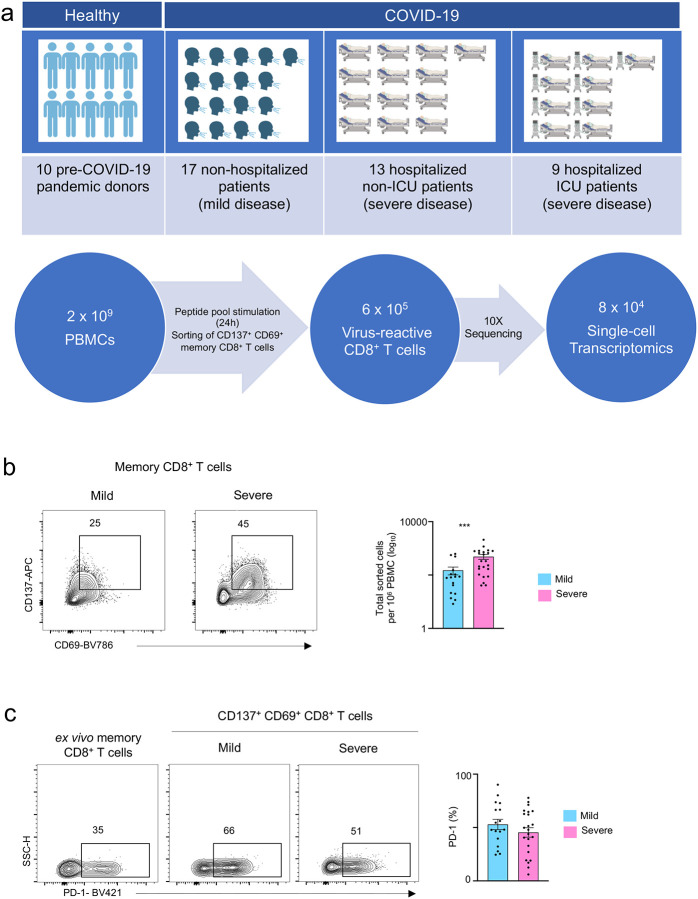
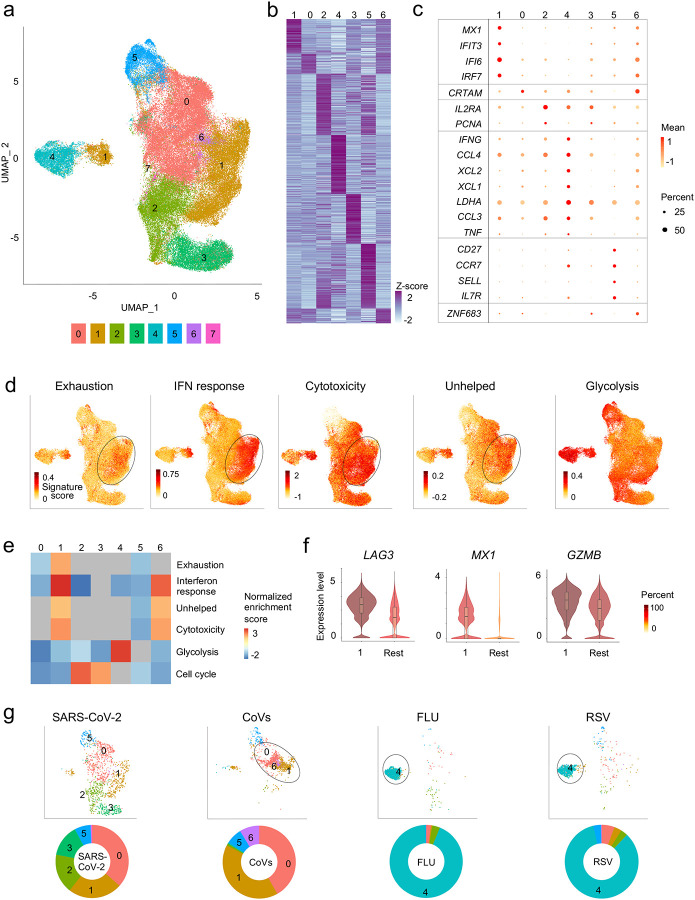
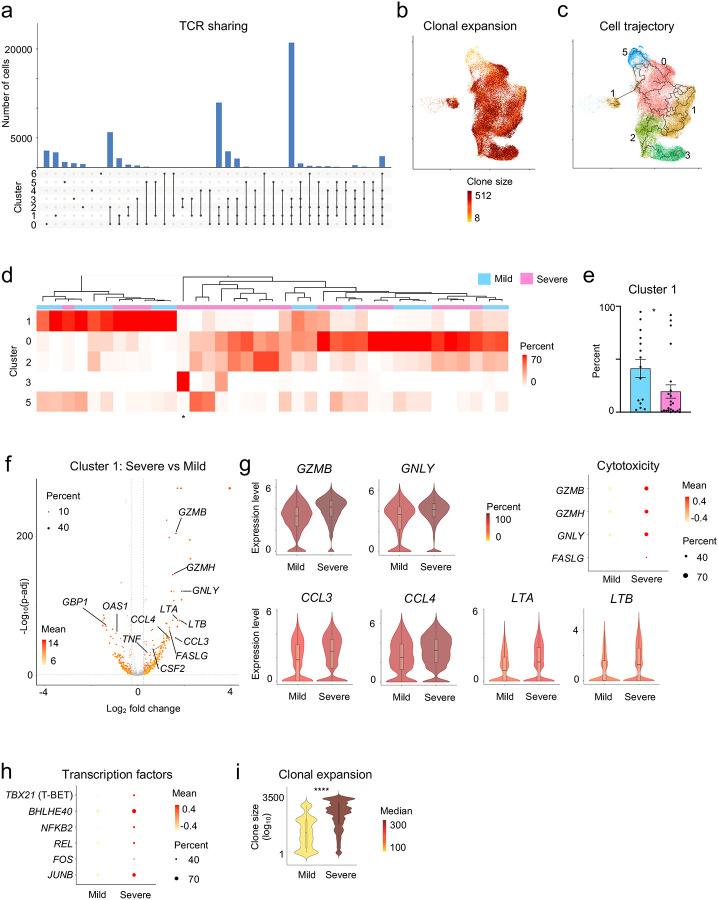
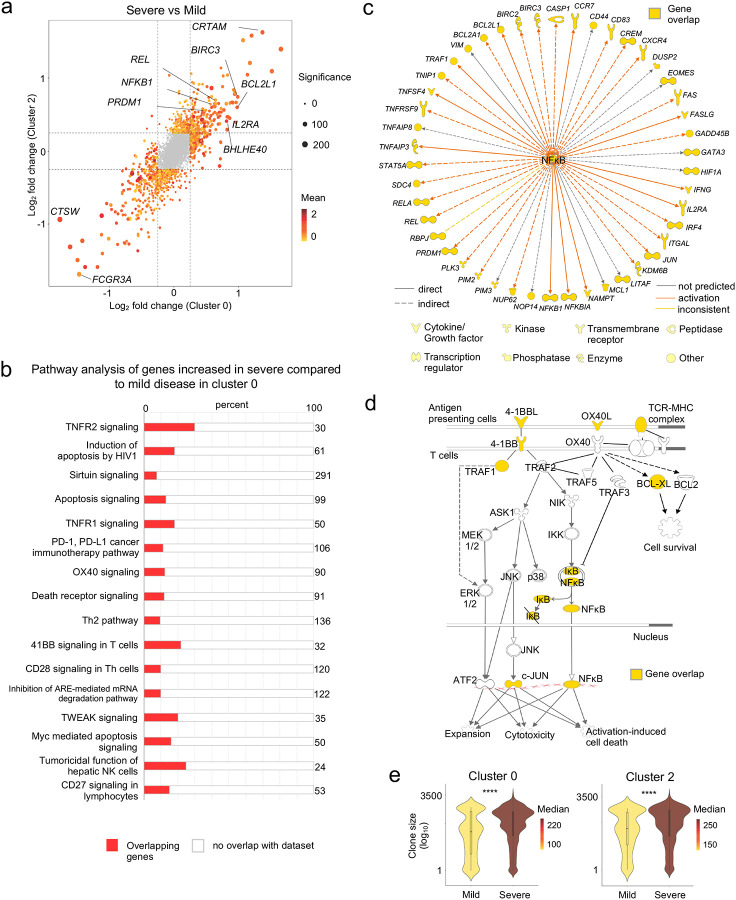
The molecular properties of CD8 + T cells that respond to SARS-CoV-2 infection are not fully known. Here, we report on the single-cell transcriptomes of >80,000 virus-reactive CD8 + T cells from 39 COVID-19 patients and 10 healthy subjects. COVID-19 patients segregated into two groups based on whether the dominant CD8 + T cell response to SARS-CoV-2 was 'exhausted' or not. SARS-CoV-2-reactive cells in the exhausted subset were increased in frequency and displayed lesser cytotoxicity and inflammatory features in COVID-19 patients with mild compared to severe illness. In contrast, SARS-CoV-2-reactive cells in the non-exhausted subsets from patients with severe disease showed enrichment of transcripts linked to co-stimulation, pro-survival NF-κB signaling, and anti-apoptotic pathways, suggesting the generation of robust CD8 + T cell memory responses in patients with severe COVID-19 illness. CD8 + T cells reactive to influenza and respiratory syncytial virus from healthy subjects displayed polyfunctional features. Cells with such features were mostly absent in SARS-CoV-2 responsive cells from both COVID-19 patients and healthy controls non-exposed to SARS-CoV-2. Overall, our single-cell analysis revealed substantial diversity in the nature of CD8 + T cells responding to SARS-CoV-2.


Conflict of interest statement

COMPETING FINANCIAL INTERESTS

The authors declare no competing financial interests.

Figures

Extended Data Figure 1.
Extended Data Figure 1.. CD8+ T cell responses in COVID-19 illness
a, Gating strategy to sort: lymphocytes size-scatter gate, single cells (Height vs Area forward scatter (FSC)), live, CD3+CD8+ memory (CD45RA+CCR7+ naive cells excluded) activated CD137+ CD69+ cells. Surface expression of activation markers was analyzed on CD8+ memory T cells. b, Representative FACS plots (left) showing surface expression of CD38 and HLA-DR in CD8+ memory T cells ex vivo and in CD137+CD69+ CD8+ memory T cells following 24 hours of stimulation, post-enrichment (CD137-based), and summary of proportions of cells expressing CD38 (N=39, P=0.24 by Mann-Whitney test)) and HLA-DR (N=34, P=0.11 by Mann-Whitney test) in CD137+CD69+ CD8+ memory T cells following stimulation and post-enrichment (CD137-based) in COVID-19 patients with mild and severe disease (right); Data are mean +/− S.E.M. c, Number of genes recovered for each 10X library sequenced. d, Distribution of cells in each cluster for the 6 batches of SARS-CoV2-reactive CD8+ T cells from COVID-19 patients (right panel).
Extended Data Figure 2.
Extended Data Figure 2.. Virus-reactive CD8+ T cells show transcriptomic heterogeneity
a, Violin plots showing enrichment patterns of exhaustion, interferon (IFN) response, cytotoxicity, ‘unhelped’, and glycolysis gene signatures for each cluster. Color indicates signature scores. b, Violin plots showing expression of exhaustion and cytotoxicity gene markers in cluster 1 compared to an aggregation of remaining cells (Rest). c, Scatter plots (top panel) displaying co-expression of IFNG and TNF, IFNG and CCL4, XCL1 and XCL2 transcripts in virus-reactive CD8+ memory T cells in cluster 4 compared to the rest of the cells (Rest). Numbers indicate the percentage of cells in each quadrant. Violin plots (bottom panel) showing expression of indicated transcripts in cluster 4 compared to an aggregation of remaining cells (Rest). d, Violin plot showing expression of ZNF683 in cluster 6 compared to an aggregation of remaining cells (Rest). Color indicates percentage of cells expressing indicated transcript.
Extended Data Figure 3.
Extended Data Figure 3.. Exhausted SARS-CoV-2-reactive CD8+ cells are increased in mild COVID-19 illness
a, Plot depicting correlation of the proportion of cells in cluster 1 per COVID-19 patients (y-axis, percent) and the interval between symptom onset to blood collection (x-axis, days). R=0.3 (Pearson correlation), P<0.07 (ns). b, Gene Set Enrichment Analysis (GSEA) of Interferon response, Cytotoxicity, and Exhaustion signatures in cluster 1 cells between COVID-19 patients with severe versus mild illness. c, Violin plots depicting several IFN response genes in cluster 1 cells from COVID-19 patients with mild and severe illness. d, Scatter plot displaying co-expression of TNF and CSF2 transcripts in cluster 1 cells from COVID-19 patients with mild and severe illness. Numbers indicate the percentage of cells in each quadrant. e, Violin plots comparing the expression of indicated transcripts between BHLHE40-expressing and non-expressing cells in cluster 1 from COVID-19 patients with severe disease.
Extended Data Figure 4.
Extended Data Figure 4.. Pro-survival features in SARS-CoV-2-reactive CD8+ T cells from patients with severe COVID-19
a, Bar charts comparing the proportion of cells in cluster 0 (P = 0.29 by Mann-Whitney test) and 2 (P =0.13 by Mann-Whitney test) from COVID-19 patients with mild and severe disease. Data are displayed as mean +/− S.E.M (N=37). b, Ingenuity pathway analysis (IPA) of genes with increased expression (adjusted P <0.05, log2 fold change >0.25) in cluster 0 cells between COVID-19 patients with severe versus mild illness; transcripts encoding components of apoptosis signaling pathway are shown.
Figure 1.
Figure 1.. CD8+ T cell responses in COVID-19 illness
a, Study design overview. b, Representative FACS plots displaying surface staining of CD137 and CD69 in post-enriched CD8+ memory T cells, stimulated for 24 hours with SARS-CoV-2 peptide pools, from COVID-19 patients with mild and severe illness (left), and summary of the number of cells sorted per million PBMC (right). c, Representative FACS plots (left) showing surface expression of PD-1 in CD8+ memory T cells ex vivo (without in vitro stimulation) and in CD137+ CD69+ CD8+ memory T cells following stimulation, post-enrichment (CD137-based) and corresponding summary plots (right) showing proportion of PD-1 expressing cells in each study subject (P = 0.26, unpaired t-test); Data are displayed as mean +/− S.E.M (N=39). ***P<0.001 by Mann-Whitney test (b).
Figure 2.
Figure 2.. Virus-reactive CD8+ T cells show transcriptomic heterogeneity
a, Uniform manifold approximation and projection (UMAP) analysis that displays single-cell transcriptomic landscape of sorted CD137+CD69+ CD8+ memory T cells following 24 hours stimulation with virus-specific peptide pools. Seurat-based clustering of single cells colored based on cluster type. b, Heatmap showing expression of the most significantly enriched transcripts in clusters 0–6 (see Extended Data Table 4, Seurat marker gene analysis - comparison of a cluster of interest versus all other cells). Shown are a subset of the top 200 transcripts that have an adjusted P < 0.05, log2 fold change > 0.25, and >10% difference in the percentage of cells expressing the differentially expressed transcript between two groups compared. c, Graph showing average expression and percent expression of selected marker transcripts in each cluster; cells in cluster 7 that comprise <1% of all cells are not shown (b,c). d, UMAP is illustrating exhaustion, interferon (IFN) response, cytotoxicity, ‘unhelped’, and glycolysis signature scores for each cell. e, Gene Set Enrichment Analysis (GSEA) for the indicated signature genes comparing each cluster with the rest of the cells. Heatmap shows summary of the normalized enrichment scores for each cluster. Gray color indicates that the signature does not reach statistical significance (P >0.05) in a given cluster. f, Violin plots showing expression of representative exhaustion, IFN response, cytotoxicity marker transcripts (LAG3, MX1, GZMB, respectively) in cluster 1 compared to an aggregation of remaining cells (Rest). The color indicates percentage of cells expressing indicated transcript. g, UMAPs are depicting CD8+ memory T cells for individual virus-specific pool stimulation conditions (top panel). Each group of virus-reactive cells was randomly downsampled to ensure equal representation, corresponding pie charts, displaying proportions of virus-reactive cells in individual clusters (bottom panel).
Figure 3.
Figure 3.. Exhausted SARS-CoV-2-reactive CD8+ T cells are increased in mild COVID-19 illness
a, Single-cell TCR sequence analysis of SARS-CoV-2-reactive cells showing the sharing of TCRs between cells from individual clusters (rows, connected by lines). Bars (top) indicate the number of cells intersecting indicated clusters (columns). b, UMAP is showing the clone size of SARS-CoV-2-reactive cells from COVID-19 patients. c, Single-cell trajectory analysis showing the relationship between cells in different clusters (line). d, Unsupervised clustering of all COVID-19 patients (mild and severe illness) based on the proportion of SARS-CoV-2-reactive CD8+ T cells present in each cluster per patient. The symbol * below represents patient 8. Clusters 4, 6, and 7 that had a very low frequency of cells in COVID-19 patients (<1% cells per cluster in total) are not shown here, full details provided in Extended Data Table 3. e, Bar chart comparing the proportion of cells in cluster 1 from COVID-19 patients with mild and severe illness. Data are displayed as mean +/− S.E.M (N=37, 2 subjects without hashtag data were not included for donor-specific analysis). f, Volcano plot showing genes differentially expressed (adjusted P < 0.05, mean CPM >0, log2 fold change >0.25) in cluster 1 cells between COVID-19 patients with severe and mild disease. g, Violin, and dot plots comparing the expression of indicated transcripts in cluster 1 cells between COVID-19 patients with mild and severe disease. h, Plot displaying the expression of several key transcription factors in cluster 1 cells from COVID-19 patients with severe and mild illness. i, Violin plots showing the degree of CD8+ T cell-clonal expansion in cluster 1 cells between COVID-19 patients with mild and severe disease. *P<0.05, ****P<0.0001 by Mann-Whitney tests (e,i).
Figure 4.
Figure 4.. Pro-survival features in SARS-CoV-2-reactive CD8+ T cells from patients with severe COVID-19 illness
a, Plot shows fold change values of differentially expressed genes (adjusted P < 0.05, mean CPM >0, log2 fold change >0.25) in cluster 0 (x-axis) and 2 (y-axis) when comparing COVID-19 patients with severe and mild illness. A positive value indicates that the particular gene has increased expression in patients with severe disease relative to patients with mild disease in a given cluster, while a negative value indicates the opposite. b-d, Ingenuity pathway analysis (IPA) of genes with increased expression (adjusted P <0.05, log2 fold change >0.25) in cluster 0 cells between COVID-19 patients with severe versus mild illness; b, Top 16 canonical pathways with significant enrichment; c, Upstream regulatory network analysis of genes in NF-κB pathway; d, Transcripts encoding components in the 4–1BB and OX40 signaling pathway. e, Violin plots showing the degree of CD8+ T cell-clonal expansion in cluster 0 and 2 between COVID-19 patients with mild and severe disease. **** P <0.0001 by Mann-Whitney test.

References

    1. Hanke T., et al. Enhancement of MHC class I-restricted peptide-specific T cell induction by a DNA prime/MVA boost vaccination regime. Vaccine 16, 439–445 (1998). - PubMed
    1. McMichael A., Mwau M. & Hanke T. HIV T cell vaccines, the importance of clades. Vaccine 20, 1918–1921 (2002). - PubMed
    1. Arunachalam P.S., et al. T cell-inducing vaccine durably prevents mucosal SHIV infection even with lower neutralizing antibody titers. Nat Med (2020). - PMC - PubMed
    1. Petitdemange C., et al. Vaccine induction of antibodies and tissue-resident CD8+ T cells enhances protection against mucosal SHIV-infection in young macaques. JCI Insight 4(2019). - PMC - PubMed
    1. Grifoni A., et al. Targets of T Cell Responses to SARS-CoV-2 Coronavirus in Humans with COVID-19 Disease and Unexposed Individuals. Cell (2020). - PMC - PubMed

Publication types