[Preprint]. 2020 Aug 28:2020.07.06.20140285.
doi: 10.1101/2020.07.06.20140285.

Estimating the establishment of local transmission and the cryptic phase of the COVID-19 pandemic in the USA

Affiliations

Estimating the establishment of local transmission and the cryptic phase of the COVID-19 pandemic in the USA

Jessica T Davis et al. medRxiv. .

Update in

  • Cryptic transmission of SARS-CoV-2 and the first COVID-19 wave.
    Davis JT, Chinazzi M, Perra N, Mu K, Pastore Y Piontti A, Ajelli M, Dean NE, Gioannini C, Litvinova M, Merler S, Rossi L, Sun K, Xiong X, Longini IM Jr, Halloran ME, Viboud C, Vespignani A. Davis JT, et al. Nature. 2021 Dec;600(7887):127-132. doi: 10.1038/s41586-021-04130-w. Epub 2021 Oct 25. Nature. 2021. PMID: 34695837 Free PMC article.

Abstract

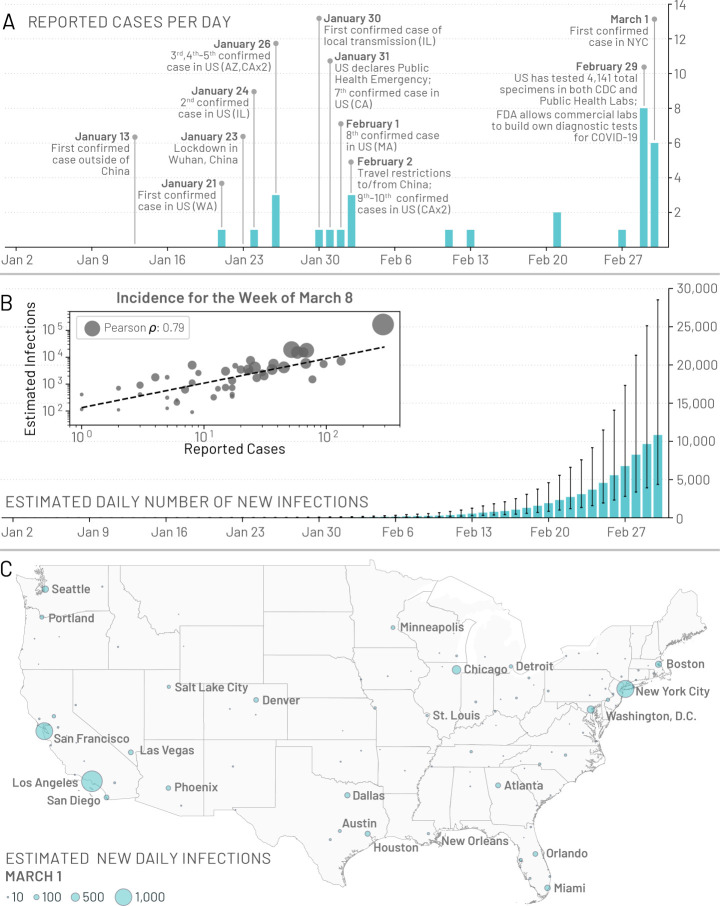
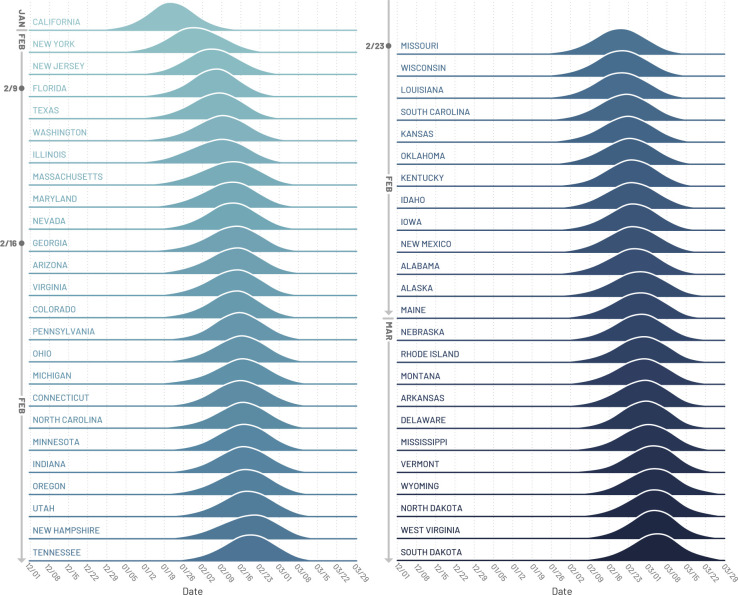
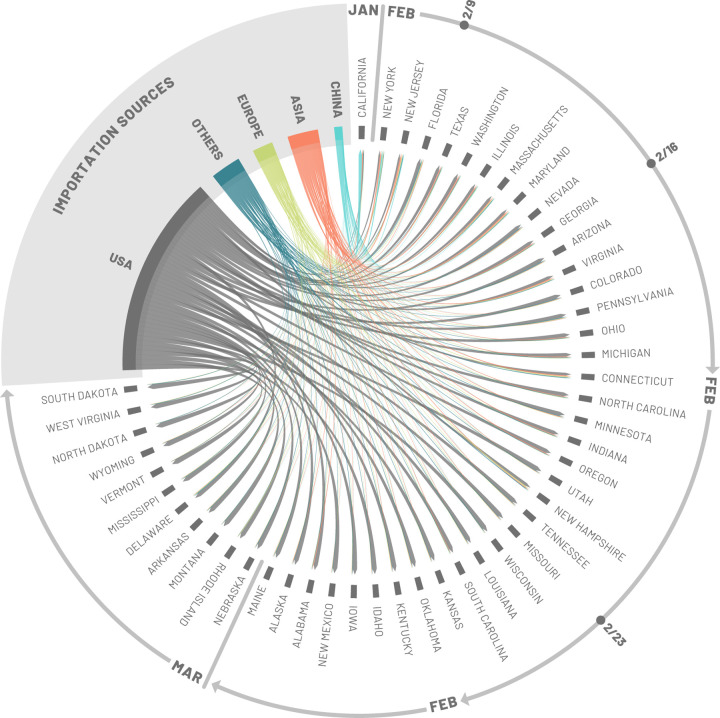
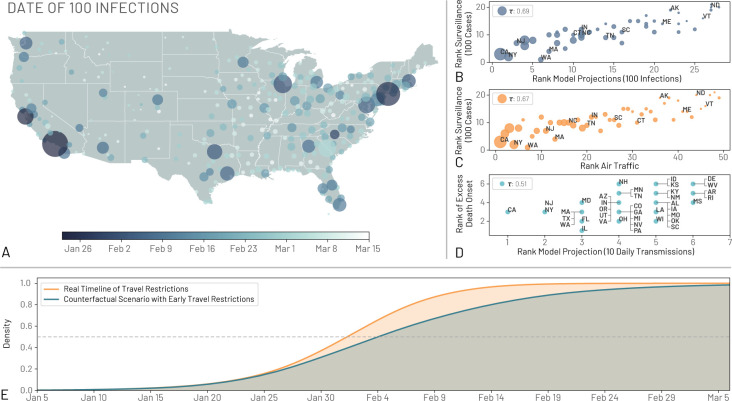
We use a global metapopulation transmission model to study the establishment of sustained and undetected community transmission of the COVID-19 pandemic in the United States. The model is calibrated on international case importations from mainland China and takes into account travel restrictions to and from international destinations. We estimate widespread community transmission of SARS-CoV-2 in February, 2020. Modeling results indicate international travel as the key driver of the introduction of SARS-CoV-2 in the West and East Coast metropolitan areas that could have been seeded as early as late-December, 2019. For most of the continental states the largest contribution of imported infections arrived through domestic travel flows.


Conflict of interest statement

Competing Interests M.E.H. reports grants from National Institute of General Medical Sciences, during the conduct of the study; A.V. reports grants and personal fees from Metabiota inc., outside the submitted work; M.C. and A.P.P. report grants from Metabiota inc., outside the submitted work. No other relationships or activities that could appear to have influenced the submitted work.

Figures

Figure 1:
Figure 1:. Early picture of the COVID-19 outbreak in the United States.
(A) A timeline of the daily reported and confirmed cases of COVID-19 in the US including information on the first 10 reported cases and other significant events related to the outbreak up to March 1, 2020. (B) Model-based estimates for the median daily number of new infections in the continental US. Error bars represent the interquartile range. The inset plot compares the weekly incidence of reported cases with the weekly incidence of infections estimated by the model for the week of March 8 – 14, 2020, for 48 of the continental states that reported at least 1 confirmed case. Circle size corresponds to the population size of each state. (C) Model based estimates for the median number of daily infections in the continental US as of March 1, 2020.
Figure 2:
Figure 2:. Timing of the onset of local transmission.
Posterior distributions of the week when each state first reached 10 locally generated SARS-CoV-2 transmission events per day.
Figure 3:
Figure 3:
Importation sources. Each state is displayed in a clockwise order with respect to the start of the local outbreak (as seen in Fig. 2). Importation flows are directed and weighted. We normalize links considering the total in-flow for each state so that the sum of importations flows, for each state, is one. In the SM we report the complete list of countries contributing, as importation sources, in each group (i.e., geographical region).
Figure 4:
Figure 4:. Comparing model projections to surveillance and air traffic data.
(A) Map of the US showing the date where regions observed at least an average of 100 infections. (B) The correlation between the ordering of each state to reach 100 infections in the model projections and to reach 100 reported cases in the surveillance data. The correlation is computed using the Kendall rank correlation coefficient, τ. (C) The correlation between the ordering of each state considering the time needed to reach 100 reported cases in the surveillance data and the ranking of the combined international and domestic air traffic. (D) The order correlation of the onset of excess deaths due to pneumonia and influenza and the order of the model projection for the date of 10 transmissions per day. Circle size in A, B, and C corresponds to the population size of each state. (E) The cumulative distribution of the probability that the US reached 100 locally generated transmissions per day by a given day for both a scenario using the real timelines of travel restrictions and a counterfactual scenario where the travel restrictions to/from mainland China are shifted one week before. The median dates for the real and counterfactual timelines are February 2, 2020, and February 4, 2020, respectively. We show a horizontal line at a density of 0.5

References

    1. Centers for Disease Control and Prevention (CDC), “First Travel-related Case of 2019 Novel Coronavirus Detected in United States” (2020); https://www.cdc.gov/media/releases/2020/p0121-novel-coronavirus-travel-c....
    1. Business Insider, “2nd case of the Wuhan coronavirus in the US was just confirmed in Chicago” (2020); https://www.businessinsider.fr/us/wuhan-coronavirus-second-confirmed-cas....
    1. Arizona Department of Health Services, “Public Health Agencies Confirm 2019 Novel Coronavirus Case in Arizona” (2020); https://www.azdhs.gov/director/public-information-office/index.php#news-....
    1. Los Angeles County Public Health, “Public Health Confirms First Case of 2019 Novel Coronavirus in Los Angeles County” (2020); http://publichealth.lacounty.gov/phcommon/public/media/mediapubhpdetail.....
    1. Illinois Department of Public Health, “Second Illinois 2019 Novel Coronavirus Case Identified” (2020); http://www.dph.illinois.gov/news/second-illinois-2019-novel-coronavirus-....

Publication types