. 2020 Nov;382(2):293-306.
doi: 10.1007/s00441-020-03240-7. Epub 2020 Jul 17.

Preservation of optic nerve structure by complement inhibition in experimental glaucoma

Affiliations

Preservation of optic nerve structure by complement inhibition in experimental glaucoma

Caroline J Gassel et al. Cell Tissue Res. 2020 Nov.

Erratum in

Abstract

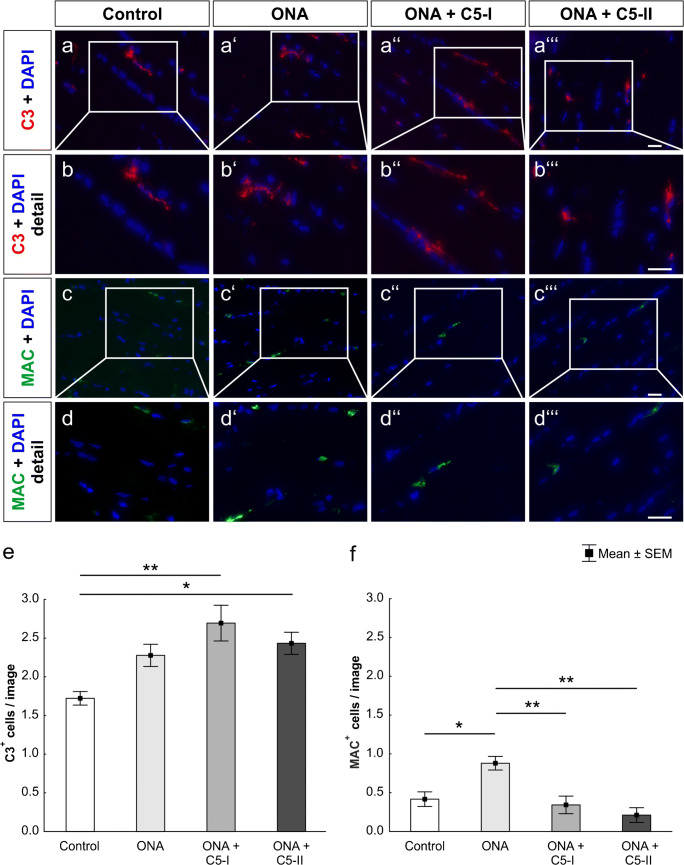
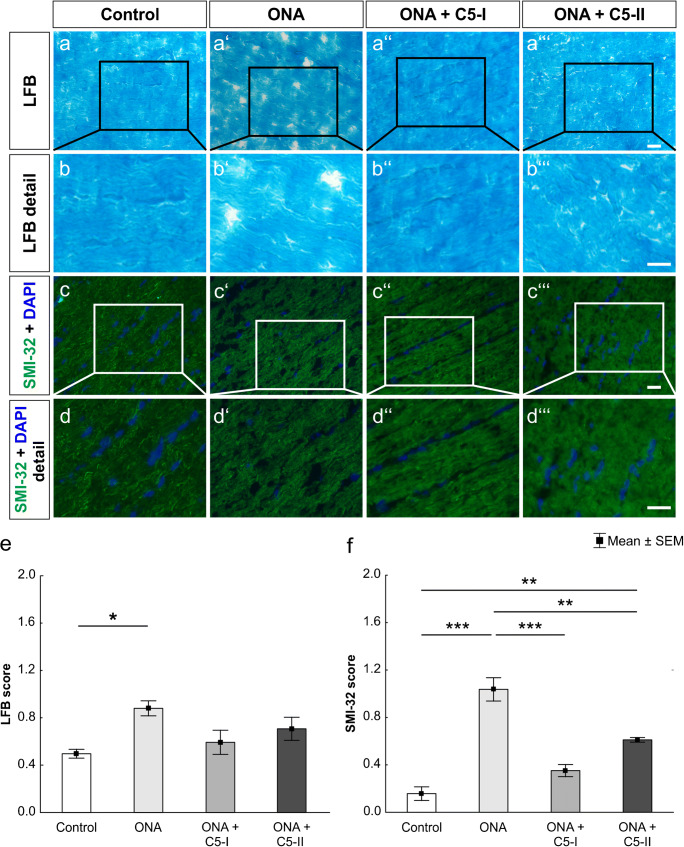
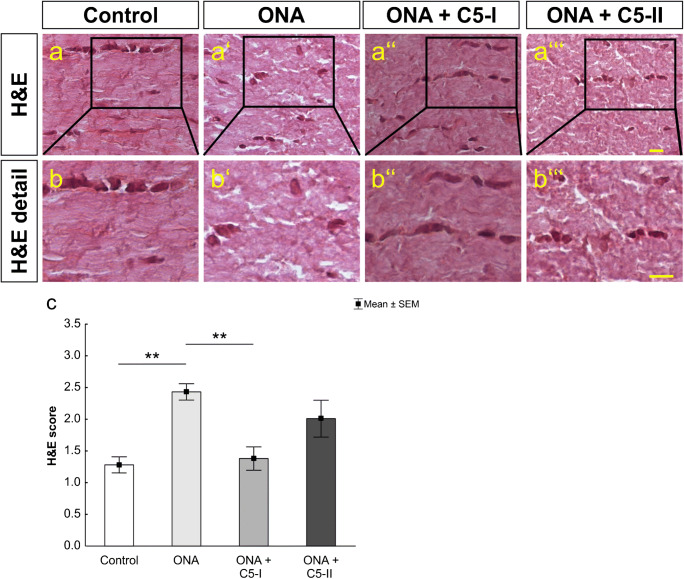
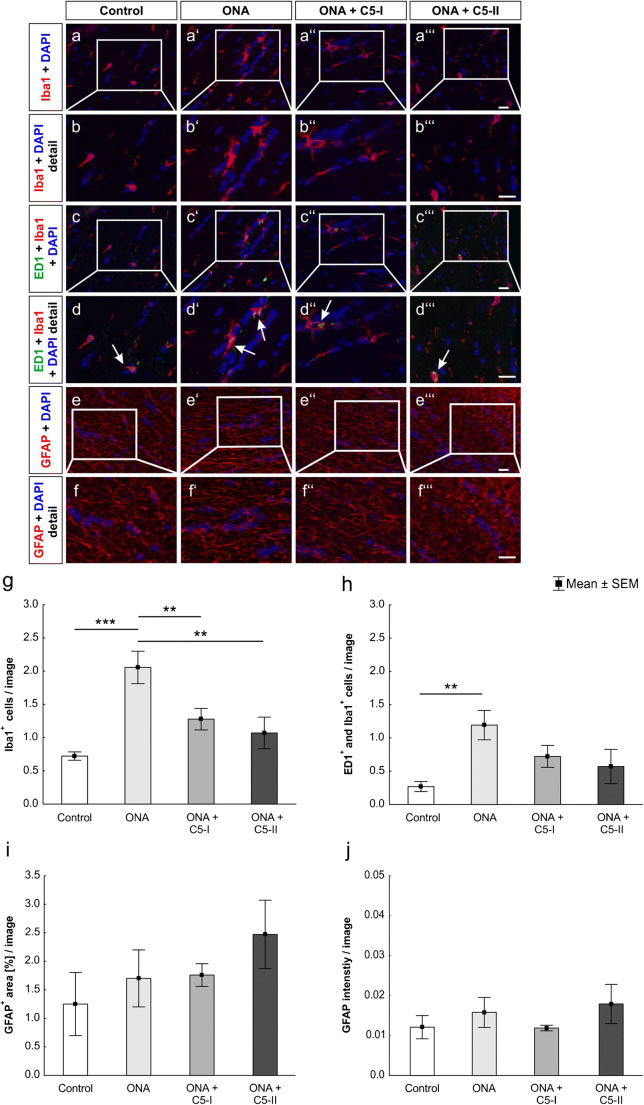
Glaucoma is characterized by a progressive damage of the retina and the optic nerve. Despite a huge research interest, the exact pathomechanisms are still unknown. In the experimental autoimmune glaucoma model, rats develop glaucoma-like damage of the retina and the optic nerve after immunization with an optic nerve antigen homogenate (ONA). An early activation of the complement system, even before optic nerve degeneration, was reported in this model. Here, we investigated the effects of a monoclonal antibody against complement factor C5 on optic nerves. Rats were immunized with ONA and compared to controls. In one eye of some ONA animals, the antibody against C5 was intravitreally injected (15 μmol: ONA + C5-I or 25 μmol: ONA + C5-II) before immunization and then every 2 weeks. After 6 weeks, optic nerves were processed for histology (n = 6/group). These analyses demonstrated that the intravitreal therapy reduced the depositions of the membrane attack complex compared to ONA animals (ONA + C5-I: p = 0.005; ONA + C5-II: p = 0.002). Cellular infiltration was significantly reduced in the ONA + C5-I group (p = 0.003), but not in ONA + C5-II tissues (p = 0.41). Furthermore, SMI-32 staining revealed that neurofilament was preserved in both treatment groups compared to ONA optic nerves (both p = 0.002). A decreased amount of microglia was found in treated animals in comparison to the ONA group (ONA + C5-I: p = 0.03; ONA + C5-II: p = 0.009). We observed, for the first time, that a complement system inhibition could prevent optic nerve damage in an autoimmune glaucoma model. Therefore, complement inhibition could serve as a new therapeutic tool for glaucoma.

Keywords: Complement inhibition; Complement system; Glaucoma; Microglia; Optic nerve.


Conflict of interest statement

The authors declare that they have no conflict of interest.

Figures

Fig. 1
Fig. 1
Study design. Animals were immunized with ONA at day zero. Immunization was boosted after 4 weeks. The intravitreal injections of the C5 antibody were performed 1 day before the first immunization (−1) and then repeated every 2 weeks (2 and 4 weeks). After 6 weeks, optic nerves were explanted, embedded, cut into longitudinal sections, and histologically examined
Fig. 2
Fig. 2
Successful complement inhibition. (a–a‴) Optic nerve sections were stained for complement factor C3 (red) DAPI (blue) was used to visualize cell nuclei. (b–b‴) Detailed pictures of C3 labeled optic nerves. (c–c‴) An antibody against the membrane attack complex (MAC, green) was used to label optic nerves, while DAPI (blue) counterstained cell nuclei. (d–d‴) Detailed images of optic nerves stained with MAC. (e) The amount of C3+ cells was significantly higher in the ONA + C5-I group (p < 0.01) and in the ONA + C5-II group (p < 0.05) compared to controls. (f) MAC+ cells were more frequent in the ONA group compared to controls (p < 0.05) and both treatment groups (both p < 0.01). Values are mean ± SEM. Scale bars: 20 μm
Fig. 3
Fig. 3
Preserved optic nerve structure and reduced demyelination. (a–a‴) Sections of the optic nerve were stained with Luxol Fast Blue (LFB). (b–b‴) Detailed pictures of LFB stained optic nerves. (c–c‴) An anti-SMI-32 antibody was used to label neurofilaments (green). Cell nuclei were visualized with DAPI (blue). (d–d‴) SMI-32 stained optic nerves shown in detail. (e) The highest LFB score values were reached in the ONA optic nerve compared to controls (p < 0.05). Scores in the treatment groups were not significantly increased. (f) Also, the highest SMI-32 score values were detected in the ONA group compared to controls (p < 0.001). Also, ONA + C5-I (p < 0.001) and ONA + C5-II optic nerves (p < 0.01) had higher scores. However, the ONA + C5-II group showed significantly higher score ratings than controls (p < 0.01). Values are mean ± SEM. Scale bars: 20 μm
Fig. 4
Fig. 4
Less inflammatory cell invasion. (a–a‴) A histological staining of longitudinal optic nerve sections with H&E was performed. (b–b‴) Detailed pictures of H&E labeled optic nerves. (c) The ONA group displayed significantly higher H&E score values than controls (p < 0.01) and the ONA + C5-I group (p < 0.01). ONA + C5-II score values showed no significant differences to any other group. Values are mean ± SEM. Scale bars: 20 μm
Fig. 5
Fig. 5
Decreased microglial activation. (a–a‴) Cells were labeled with anti-Iba1 for microglial cells (red) and DAPI (blue) for cell nuclei. (b–b‴) Detailed images of Iba1 stained optic nerves. (c–c‴) Iba1 (red) ín combination with the surface marker ED1 (green) identified activated microglia. Cell nuclei were stained with DAPI (blue). (d–d‴) In the detailed pictures, white arrows point to co-localizations of ED1 and Iba1. (e–e‴) Furthermore, anti-GFAP (red) was used to mark the cytoskeleton of macroglial cells. DAPI (blue) counterstained cell nuclei. (f–f‴) A detailed overview of GFAP labeled optic nerves. (g) The number of Iba1+ cells was significantly higher in the ONA group in comparison to the control (p < 0.001) and both therapy groups (both p < 0.01). (h) Activated microglia were more frequent in the ONA group compared to controls (p < 0.01). The differences between ONA + C5-I, ONA + C5-II, and Co were not significant. (i) Regarding the GFAP+ area, no significant differences could be detected between all groups. (j) Additionally, the intensity of GFAP was not altered within all groups. Values are mean ± SEM. Scale bars: 20 μm

References

    1. Bayly-Jones C, Bubeck D, Dunstone MA (2017) The mystery behind membrane insertion: a review of the complement membrane attack complex. Philos Trans R Soc Lond Ser B Biol Sci 372 - PMC - PubMed
    1. Becker S, Reinehr S, Dick HB, Joachim SC (2015) Complement activation after induction of ocular hypertension in an animal model. Ophthalmologe 112:41–48 - PubMed
    1. Boehm N, Wolters D, Thiel U, Lossbrand U, Wiegel N, Pfeiffer N, Grus FH (2012) New insights into autoantibody profiles from immune privileged sites in the eye: a glaucoma study. Brain Behav Immun 26:96–102 - PubMed
    1. Bonomi L, Marchini G, Marraffa M, Bernardi P, De Franco I, Perfetti S, Varotto A, Tenna V (1998) Prevalence of glaucoma and intraocular pressure distribution in a defined population. The Egna-Neumarkt Study Ophthalmology 105:209–215 - PubMed
    1. Bosco A, Inman DM, Steele MR, Wu G, Soto I, Marsh-Armstrong N, Hubbard WC, Calkins DJ, Horner PJ, Vetter ML (2008) Reduced retina microglial activation and improved optic nerve integrity with minocycline treatment in the DBA/2J mouse model of glaucoma. Invest Ophthalmol Vis Sci 49:1437–1446 - PubMed

Substances