. 2021 Jan;19(1):177-191.
doi: 10.1111/pbi.13452. Epub 2020 Sep 3.

A large-scale genomic association analysis identifies the candidate causal genes conferring stripe rust resistance under multiple field environments

Affiliations

A large-scale genomic association analysis identifies the candidate causal genes conferring stripe rust resistance under multiple field environments

Jianhui Wu et al. Plant Biotechnol J. 2021 Jan.

Abstract

The incorporation of resistance genes into wheat commercial varieties is the ideal strategy to combat stripe or yellow rust (YR). In a search for novel resistance genes, we performed a large-scale genomic association analysis with high-density 660K single nucleotide polymorphism (SNP) arrays to determine the genetic components of YR resistance in 411 spring wheat lines. Following quality control, 371 972 SNPs were screened, covering over 50% of the high-confidence annotated gene space. Nineteen stable genomic regions harbouring 292 significant SNPs were associated with adult-plant YR resistance across nine environments. Of these, 14 SNPs were localized in the proximity of known loci widely used in breeding. Obvious candidate SNP variants were identified in certain confidence intervals, such as the cloned gene Yr18 and the major locus on chromosome 2BL, despite a large extent of linkage disequilibrium. The number of causal SNP variants was refined using an independent validation panel and consideration of the estimated functional importance of each nucleotide polymorphism. Interestingly, four natural polymorphisms causing amino acid changes in the gene TraesCS2B01G513100 that encodes a serine/threonine protein kinase (STPK) were significantly involved in YR responses. Gene expression and mutation analysis confirmed that STPK played an important role in YR resistance. PCR markers were developed to identify the favourable TraesCS2B01G513100 haplotype for marker-assisted breeding. These results demonstrate that high-resolution SNP-based GWAS enables the rapid identification of putative resistance genes and can be used to improve the efficiency of marker-assisted selection in wheat disease resistance breeding.

Keywords: 660K SNP array; GWAS; candidate region association analysis; common wheat (Triticum aestivum L.); marker-assisted breeding; serine/threonine protein kinase (STPK); stripe rust.


Conflict of interest statement

The authors declare no conflicts of interest and all experiments comply with the current laws of China.

Figures

Figure 1
Figure 1
Population structure of the 411 included wheat accessions. (a) Principal components analysis (PCA). (b) Neighbour‐joining tree analysis. (c, d, e) Subgroups inferred by hierarchical clustering, kinship and structure analysis. Vertical lines indicate genetic similarity thresholds used to classify accessions into two main groups (dashed lines) and five subgroups (dotted lines). (d) 411 × 411 kinship matrix based on a simple matching of genetic similarities (IBS, identity by state). Separations among hierarchical‐based groups are shown as horizontal dashed lines for main groups and as dotted‐dashed lines for subgroups. (e) Matrices of membership coefficients of accessions corresponding to 2–5 hypothetical subpopulations derived from the STRUCTURE analysis.
Figure 2
Figure 2
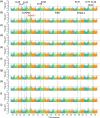
Genome‐wide association analysis results for the severity of stripe rust across ten tested environments. Assessed environments included (a) 2017‐Jiangyou, (b) 2017‐Tianshui, (c) 2017‐Yanlging, (d) 2018‐Jiangyou, (e) 2018‐Tianshui, (f) 2018‐Yanlging, (g) 2019‐Jiangyou, (h) 2019‐Tianshui, (i) 2019‐Yanlging and (j) BLUP (the best linear unbiased predictions). The horizontal line shows the genome‐wide significance threshold –log10 (P) value of 3.4. The A, B and D genomes are in blue‐green, pale green and orange, respectively. The QTL detected in this GWAS panel associated with the known Yr loci are listed in the corresponding chromosome.
Figure 3
Figure 3
Identification of the causal gene for stripe rust resistance associated with the peak on chromosome 7D. (a) Manhattan plot of single polymorphism‐based association analysis. Dashed line represents a significance threshold (−log10 P = 3.04). Significantly associated single nucleotide polymorphisms (SNPs) are shown as dark blue points, and other SNPs are shown as light blue points. (b, c) Local Manhattan plot of single‐polymorphism‐based association (top) and LD heatmap (bottom) surrounding the peak on chromosome 7D. Arrow indicates the position of nucleotide variations in TraesCS7D01G080300 (Yr18). Dashed lines indicate the candidate region for the peak. (d) The exon‐intron structure of Yr18 and its DNA polymorphisms. del, deletion. (e) Disease severities were based on the haplotypes for Yr18 in different panels of the population. Differences between the haplotypes were statistically analysed using Student's t‐test (*P < 0.05). (f) Stripe rust responses of near‐isogenic lines (±Yr18) in the common wheat cultivar Avocet S background. Scale bar, 1 cm.
Figure 4
Figure 4
Candidate region associated with stripe rust resistance on chromosome 2B detected in different GWAS panels. Manhattan plots showing the significant SNP associations for the QTL underlying stripe rust resistance detected within (a) an extensive genomic region (707.418–712.236 Mb) using a panel of 411 spring wheat lines and (b) a refined region (707.668 to 708.346) using an independent validation population of 1045 wheat accessions. Grey horizontal dashed line represents a significance threshold (−log10 P = 4.85). Significantly associated SNPs in the two data sets are shown as dark blue points, and other SNPs are shown as light blue points. The upper‐triangular halves of the linkage disequilibrium (LD, as r 2) matrices between SNPs within the candidate region are shown as heat maps below the Manhattan plots. SNP names with red text in LD plots indicate the physical positions of SNPs with significant associations.
Figure 5
Figure 5
Identification of the causal gene for stripe rust resistance associated with the peak on chromosome 2B. (a) Manhattan plots of polymorphic DNA variants‐based association analysis in the candidate region using resequencing data. (b) The HC genes in the candidate region. (c, d, e) Exon‐intron structures of TraesCS2B01G512900, TraesCS2B01G513000 and TraesCS2B01G513100 and their corresponding DNA polymorphisms with significant associations. (f, g, h) The relative expression levels of TraesCS2B01G512900, TraesCS2B01G513000 and TraesCS2B01G513100 in two cultivars (AvS and XZ9104) with extremely opposite YR phenotypes using qRT‐PCR. Each bar represents the mean ± SD of three biological replicates. (i) Disease severity data based on the functional variants in TraesCS2B01G512900 (M8), TraesCS2B01G513000 (M7) and TraesCS2B01G513100 (M1‐M6) in the EMS mutants. (j) Stripe rust responses for different HIFs and their parents, Snb "S" (resistant parent, RP) and ZM9023 (susceptible parent, SP), and for the durum wheat cultivar Kronos (wild type, WT) and its mutant lines. Scale bar, 1 cm. (k) Haplotype genotype and frequencies in the candidate region and the core of the favourable allele combination are in the red box. (l) Disease severities were based on the haplotypes for YrSnb.1 in different panels of the population. The asterisks indicate significant differences among groups or lines at the P < 0.05 level (Student's t‐test).

References

    1. Arora, S. , Steuernagel, B. , Gaurav, K. , Chandramohan, S. , Long, Y. , Matny, O. , Johnson, R. et al. (2019) Resistance gene cloning from a wild crop relative by sequence capture and association genetics. Nat. Biotechnol. 37, 139–143. - PubMed
    1. Bates, D. , Maechler, M. , Bolker, B. and Walker, S. (2014) lme4: linear mixed‐effects models using Eigen and S4. pp 1–23.
    1. Bazakos, C. , Hanemian, M. , Trontin, C. , Jimenez‐Gomez, J.M. and Loudet, O. (2017) New strategies and tools in quantitative genetics: how to go from the phenotype to the genotype. Annu. Rev. Plant Biol. 68, 435–455. - PubMed
    1. Botstein, D. , White, R.L. , Skolnick, M. and Davis, R.W. (1980) Construction of a genetic linkage map in man using restriction fragment length polymorphisms. Am. J. Hum. Genet. 32, 314–331. - PMC - PubMed
    1. Brown, J.K. (2015) Durable resistance of crops to disease: a Darwinian perspective. Annu. Rev. Phytopathol. 53, 513–539. - PubMed

Publication types

LinkOut - more resources