

MIWI prevents aneuploidy during meiosis by cleaving excess satellite RNA
- PMID: 32677148
- PMCID: PMC7429737
- DOI: 10.15252/embj.2019103614
MIWI prevents aneuploidy during meiosis by cleaving excess satellite RNA
Abstract
MIWI, a murine member of PIWI proteins mostly expressed during male meiosis, is crucial for piRNA biogenesis, post-transcriptional regulation, and spermiogenesis. However, its meiotic function remains unknown. Here, we report that MIWI deficiency alters meiotic kinetochore assembly, significantly increases chromosome misalignment at the meiosis metaphase I plate, and causes chromosome mis-segregation. Consequently, Miwi-deficient mice show elevated aneuploidy in metaphase II and spermatid death. Furthermore, in Miwi-null and Miwi slicer-deficient mutants, major and minor satellite RNAs from centromeric and pericentromeric satellite repeats accumulate in excess. Over-expression of satellite repeats in wild-type spermatocytes also causes elevated chromosome misalignment, whereas reduction of both strands of major or minor satellite RNAs results in lower frequencies of chromosome misalignment. We show that MIWI, guided by piRNA, cleaves major satellite RNAs, generating RNA fragments that may form substrates for subsequent Dicer cleavage. Furthermore, Dicer cleaves all satellite RNAs in conjunction with MIWI. These findings reveal a novel mechanism in which MIWI- and Dicer-mediated cleavage of the satellite RNAs prevents the over-expression of satellite RNAs, thus ensuring proper kinetochore assembly and faithful chromosome segregation during meiosis.
Keywords: PIWI; aneuploidy; dicer; meiosis; satellite transcript.
© 2020 The Authors.
Conflict of interest statement
The authors declare that they have no conflict of interest.
Figures

- A
TUNEL assay comparing apoptotic cells in Miwi +/− and Miwi −/− testis during diakinesis. Blue, DAPI; Green, TUNEL labeling. Asterisk indicates TUNEL‐positive stained cells in the meiotic metaphase stage. Scale bars, 10 μm.
- B, C
Meiotic metaphase I plate in FACS‐sorted Miwi heterozygous (B) and knockout (C) spermatocytes. Green: phospho‐histone H3; red: α/β‐tubulin. Asterisk indicates misaligned chromosome. Scale bars, 10 μm.
- D
Frequency of abnormal arrangement in the meiotic metaphase I plate. White, Miwi heterozygous; Light gray, Miwi knockout. Three mice were used for each genotype, and total numbers of counted metaphase I plate in Miwi heterozygous and knockout are 113 and 181, respectively.
- E, F
Meiotic metaphase II spread preparations of Miwi heterozygous (E) and knockout (F) spermatocytes. Scale bars, 5 μm.
- G
Frequency of meiotic metaphase II (MII) cells with chromosomal abnormalities. Chromosome counts were defined as the number of paired sister chromatids per MII metaphase cell. The frequency was calculated as the number of cells with given pairs of sister chromatids (20, < 20, or > 20) divided by the total number of cells. Three mice were used for each genotype, and total numbers of counted MII cells in Miwi heterozygous and knockout are 204 and 302, respectively.
- H, I
Meiotic metaphase I spread preparations of Miwi heterozygous (H) and knockout (I) spermatocytes. Scale bars, 5 μm.
- J
Frequency of meiotic metaphase I (MI) cells with chromosomal abnormalities. Chromosome counts were defined as the number of paired homologous chromosomes per MI metaphase cells. The frequency was calculated in the same way as in (G), except for that the number of paired chromosomes was counted instead. Three mice were used for each genotype, and total numbers of counted MI cells in Miwi heterozygous and knockout are 265 and 358, respectively.
- K, L
Mitotic metaphase spread preparations of Miwi heterozygous (K) and knockout (L) testes. Scale bars, 5 μm.
- M
Frequency of mitotic metaphase cells with chromosomal abnormalities. Chromosome counts were defined as the number of chromosomes per mitotic metaphase cell. Three mice were used for each genotype, and total numbers of counted mitotic metaphase cells in Miwi heterozygous and knockout are 52 and 71, respectively.

- A
Equal amounts of total RNA isolated from Miwi‐knockout (−/−), heterozygote (+/−), and slicer activity‐deficient mutant (−/ADH) spermatocytes were resolved on a 1% agarose gel. The gel was subjected to Northern blot analysis using probes specific for the sense (S) and antisense (As) strands of major (Maj) and minor (Min) satellite RNA transcripts. The blot was re‐hybridized with a 28S‐complementary probe to demonstrate equal loading (bottom on the left). The relative abundance was quantified using ImageJ software, normalized to the 28S signal from the blot.
- B
100 ng of total RNA was isolated from Miwi heterozygous (+/−), knockout (−/−), and slicer activity‐deficient mutant (−/ADH) spermatocytes and was subjected to qRT–PCR with primers specific to major satellite RNA, minor satellite RNA, 5S, 5.8S, and Gapdh. Data were normalized to 5S rRNA. 5.8S rRNA and Gapdh were used as negative controls.
- C–G
Sertoli‐spermatogenic cell co‐cultures were transfected with vectors ectopically expressing both strands of major satellite RNA (Maj, dark gray bar), both strands of minor satellite RNA (Min, black bar), full‐length 18S (18S, light gray bar), or empty vector (Ctrl, white bar). Total RNA isolated from equal numbers of FACS‐sorted MIWI‐expressing spermatocytes were subjected to qRT–PCR with primers specific to major satellite RNA (C), minor satellite RNA (D), 18S (E), 5.8S (F), and Gapdh (G). Data presented were normalized to 5S rRNA. 5.8S rRNA (F) and Gapdh (G) were used as negative controls.
- H
Immunofluorescence images of Meiotic metaphase I plate in Sertoli‐spermatogenic cell co‐cultures. Shown were spermatocytes over‐expressing both strands of major satellite RNA (Maj), both strands of minor satellite RNA (Min), full‐length 18S (18S), or empty vector (Ctrl). Green: phospho‐histone H3; red: α/β‐tubulin. Asterisk indicates misaligned chromosome. Scale bar, 5 μm.
- I
Frequency of mis‐arrangement of the meiotic metaphase I plate in Sertoli‐spermatogenic cell co‐cultures using Miwi +/− ;Stra8‐Cre testes. Spermatocytes transfected with vectors expressing both strands of major satellite RNA (Maj, dark gray), both strands of minor satellite RNA (Min, black), full‐length 18S (18S, light gray), or empty vector (Ctrl, white). n = 3 cultures for each group. The total numbers of counted meiotic metaphase plate in Ctrl, 18S, Maj, and Min were 153, 144, 130, and 141, respectively.
- J
Combined RNA‐DNA FISH analysis of major satellite transcripts and DNA regions in Miwi heterozygote (Miwi +/−) and knockout (Miwi −/−) diakinesis spermatocytes. Sense major satellite RNA transcripts were first detected using an antisense probe (red signal), and then, the major satellite DNA region was further detected using a sense probe (green signal). For RNase A treatment, the slides were incubated with (+RNase A) or without (‐RNase A) 100 μg/ml RNase A for 1 h before adding antisense probe. Nuclear DNA was stained by DAPI (blue). Arrows indicate the same pericentric heterochromatin in each channel per cell. Scale bars represent 2 μm.
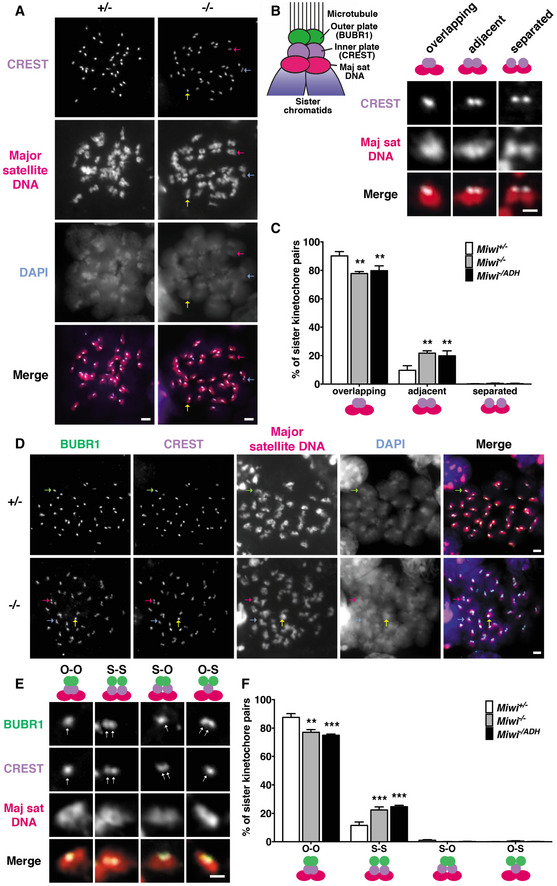
Combined immunofluorescence and DNA FISH analysis of the kinetochore inner plate/centromere formation in Miwi heterozygous (Miwi +/−) and knockout (Miwi −/−) spermatocytes at diakinesis/metaphase I. For slicer activity‐deficient mutant spermatocytes (Miwi −/ADH), the images are presented in Fig EV1A. Chromosomes were stained with anti‐centromere protein antibody (CREST, purple signal), indicating the kinetochore inner plate/centromere. Major satellite DNA regions were detected using an antisense probe (red signal) which revealed the specific localization of pericentromeres in chromosomes. Nuclear DNA was stained by DAPI (blue). Scale bars represent 2 μm.
Left panel: illustration of kinetochore configurations in meiotic metaphase I. The kinetochores of sister chromatids cohere to form a single microtubule‐binding interface. The inner–outer kinetochore axis connects the pericentric chromatin to the spindle microtubule. CREST (centromere protein) and BUBR1 (budding uninhibited by benzimidazole‐related 1) served as markers for the inner and outer regions of the kinetochore, respectively. A major satellite DNA (Maj sat DNA) probe was used to detect the pericentric chromatin. Right panel: categories of inner kinetochore configurations from A. Right panels: Inner kinetochore configurations in MI were classified as overlapping (two sister kinetochores which overlap by more than their individual radii, also see yellow arrow in A), adjacent (two sister kinetochores which overlap by less than 100% of their individual radii, also see magenta arrow in A), or separated (two sister kinetochores without overlapping, also see light blue arrow in A) kinetochores. The scale bar represents 1 μm.
Population of overlapping, adjacent, and separated inner kinetochores shown in B. The results represent the mean ± SD of three independent experiments. n = 3 mice for each genotype. The total numbers of counted cells in Miwi +/−, Miwi −/−, and Miwi −/ADH spermatocytes were 88, 118, and 125, respectively. The total numbers of counted sister kinetochore pairs in Miwi +/−, Miwi −/−, and Miwi −/ADH spermatocytes were 3,520, 4,720, and 5,000, respectively.
Combined immunofluorescence and DNA FISH analysis of kinetochore inner and outer plate formation in Miwi heterozygous (Miwi +/−) and knockout (Miwi −/−) at diakinesis/metaphase I. For slicer activity‐deficient mutant spermatocytes (Miwi −/ADH), the images are presented in Fig EV1B. Chromosomes were stained with anti‐BUBR1 (green) and anti‐centromere‐protein (CREST, purple) antibodies to mark the kinetochore outer and inner plate, respectively. In addition, major satellite DNA regions were further detected using an antisense probe (red signal). Nuclear DNA was stained by DAPI (blue). O‐O kinetochore pairs: yellow arrow; S‐S, magenta arrow; O‐S, light blue arrow; and S‐O, light green arrow. Scale bars represent 2 μm.
Magnified images of categories of sister kinetochore configurations from D. One arrow indicates overlapping pair. Double arrows indicate split pair. The scale bar represents 1 μm.
Population of the sister kinetochores shown in E. n = 3 mice for each genotype. The total numbers of counted cells in Miwi +/−, Miwi −/−, and Miwi −/ADH spermatocytes were 93, 89, and 81, respectively. The total numbers of counted sister kinetochore pairs in Miwi +/−, Miwi −/−, and Miwi −/ADH spermatocytes were 3,720, 3,560, and 3,240, respectively.
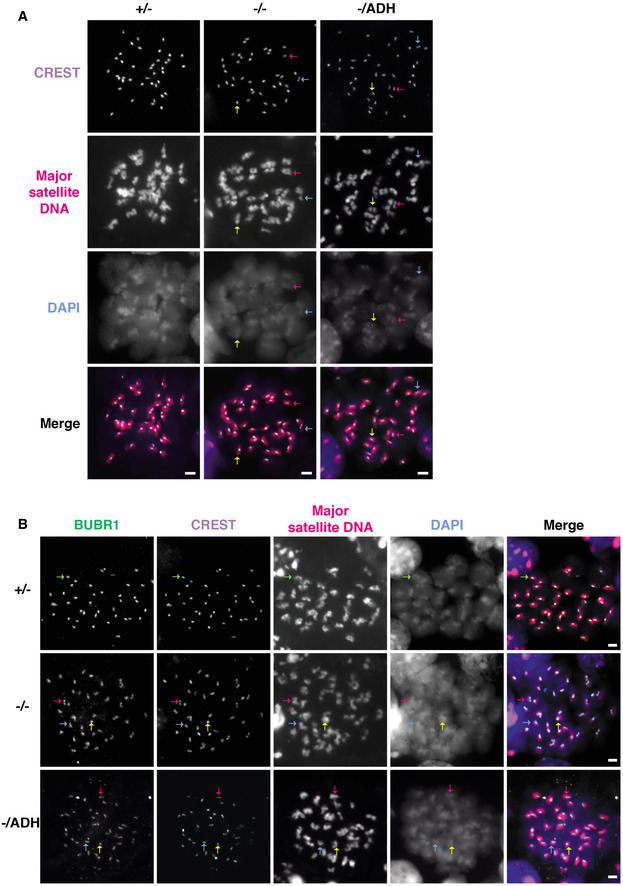
Combined immunofluorescence and DNA FISH analysis of the kinetochore inner plate/centromere formation in Miwi +/− (+/−), Miwi −/− (−/−) and slicer activity‐deficient mutant Miwi −/ADH (−/ADH) spermatocytes at diakinesis/metaphase I. The images for Miwi +/− and Miwi −/− are the same as in Fig 3A. Chromosomes in spermatocytes were stained with anti‐centromere protein antibody (CREST, purple signal), indicating the kinetochore inner plate/centromere. Major satellite DNA regions were detected using an antisense probe (red signal), which revealed the specific localization of pericentromeres in chromosomes. Nuclear DNA was stained by DAPI (blue). Scale bars represent 2 μm. Inner kinetochore configurations in MI were classified as overlapping (two sister kinetochores which overlap by more than their individual radii, yellow arrow), adjacent (two sister kinetochores which overlap by < 100% of their individual radii, magenta arrow), or separated (two sister kinetochores without overlapping, light blue arrow) kinetochores.
Combined immunofluorescence and DNA FISH analysis of kinetochore inner and outer plate formation in Miwi +/− (+/−), Miwi −/− (−/−), and Miwi −/ADH (−/ADH) spermatocytes at diakinesis/metaphase I. The images for Miwi +/− and Miwi −/− are the same as in Fig 3D. Chromosomes were stained with anti‐BUBR1 (green) and anti‐centromere protein (CREST, purple) antibodies to mark the kinetochore outer and inner plate, respectively. In addition, major satellite DNA regions were further detected using an antisense probe (red signal). Nuclear DNA was stained by DAPI (blue). Scale bars represent 2 μm. Separated and distinct pairs were grouped into split pairs (S), which indicates two sister kinetochores which overlap by less than 100% of their individual radii, which include non‐overlapping sister kinetochores). Overlapping pairs (O) indicate sister kinetochores which overlap by more than their individual radii. Sister kinetochore configurations in MI were classified as overlapping inner plate with overlapping outer plate (O‐O, yellow arrow), split inner plate with split outer plate (S‐S, magenta arrow), overlapping inner plate with split outer plate (O‐S, light blue arrow), or split inner plate with overlapping outer plate (S‐O, light green arrow).

DNA methylation analysis of genomic DNA derived from Miwi knockout (−/−), heterozygous (+/−), and Miwi slicer activity‐deficient mutant (−/ADH) spermatocytes. Equivalent amounts of DNA were digested with MspI and HpaII, and subsequently purified and gel separated (EtBr staining on the left). Southern blot analysis was then performed with hybridizing probes correspond to major and minor satellite sequences. Blot was re‐hybridized with the probes correspond to long interspersed nuclear element 1 (LINE1) and glyceraldehyde‐3‐phosphate dehydrogenase (Gapdh), to demonstrate equal loading.
Effect of MIWI knockout and its slicer activity on the transcription rates of minor and major satellite repeat regions. Nuclear run‐on (NRO) assays were performed to monitor newly transcribed centromere RNA from nuclei of Miwi +/−, Miwi −/−, and Miwi −/ADH spermatocytes. Quantitative determination of the steady‐state (total) and nascent (NRO) levels of major and minor transcripts is assessed by quantitative real‐time PCR. Results were normalized to U5 snRNA, which remained unchanged in all spermatocytes, and represent the mean ± SD of five independent experiments. 5.8S served as internal control was used to demonstrate uniformity of input RNA. The statistical test was assessed using two‐tailed unpaired t test. (*P < 0.05; **P < 0.01; n.s., P > 0.05)

Schematic diagram showing organization of mouse major and minor satellite repeats. Major and minor satellite sequences comprise six megabases of a 234‐bp repeats and six hundred kilobases of a 120‐bp repeats, respectively. The terms “sense (S)” and “antisense (As)” refer to T‐ and A‐rich transcripts, respectively. The length of major and minor satellite sequences used to perform in vitro transcription is indicated.
RNA pull‐down assay using biotinylated major and minor satellite RNA transcripts and whole‐cell extracts from Miwi heterozygous (Miwi +/−), knockout (Miwi −/−), slicer activity‐deficient mutant (Miwi −/ADH), and Mov10l1 germline knockout (Mov10l1 f/− ;Stra8‐Cre) testes. Mov10l1 f/− ;Stra8‐Cre mice represent a pachytene piRNA‐deficient condition. Approximately one repeat of in vitro transcribed major and minor satellite RNAs corresponding to the sequences in A was used as baits. Precipitated proteins were visualized by Western blotting using antibodies against the indicated proteins (MIWI and MILI). The input equals 1/10 to 1/80 of the protein lysate used in the pull‐down. Transcripts corresponding to 300 nt and 162 nt of the 18S rRNA sequence served as controls for the antisense (As) and sense (S) sequence of major and minor satellite transcripts, respectively. The blot was re‐probed with anti‐GAPDH antibody serving as a negative control.
In vitro RNA processing assay with nuage–nuclear fraction from testicular lysates of Miwi‐knockout (−/−), heterozygous (+/−), and slicer activity‐deficient (−/ADH) mutants, and 5′‐end radioactively labeled RNA targets corresponding to approximately one and two repeats of major and minor satellite sequences (see panel A for details). Transcripts corresponding to 162, 300, and 542 nt of the 18S rRNA sequence served as controls. Arrow indicates the cleavage products of in vitro transcribed sense major satellite RNAs after reactions.
In vitro RNA processing assay with nuage–nuclear fraction from Mov10l1 heterozygous (Mov10l1 f/+ ;Stra8‐Cre) and Mov10l1 germline knockout (Mov10l1 f/− ;Stra8‐Cre) testis lysates, and 5′‐end radioactively labeled RNA targets corresponding to approximately one and two repeats of sense and antisense major satellite sequences. Mov10l1 f/− ;Stra8‐Cre mice represent a pachytene piRNA‐deficient condition. The arrow indicates the cleavage product of the in vitro transcribed sense major satellite RNA.
Major satellite RNA with respective piRNA target sequences. piR major‐a and major‐b target the sense strand of major satellite transcripts at their cleavage sites. The MIWI slicer activity results in 125‐ and 119‐nt cleavage products.
RNA immunoprecipitation was performed using anti‐MIWI antibody. RNA was extracted from anti‐MIWI immunoprecipitates and subjected to Northern blot analysis using probes specific for potential piRNAs (piR major‐a and major‐b), as indicated in panel E. 20% of input RNA from each group was used as the control. The blot was re‐hybridized with piR‐A and piR‐E complementary probes to demonstrate the efficiency of the RNA‐IP. A miR‐16 complementary probe served as a negative control.

- A
Schematic diagram showing organization of mouse major satellite repeats. Major satellite is formed by 234 bp heterotetramer that consists of four different monomers. The length of monomer 1–4 is 58, 60, 58, and 58 bp, respectively. The monomers 2 and 3 of major satellite sequence used to perform in vitro transcription is indicated. The red solid line indicates the piRNA targeting sites.
- B
piR major‐a and major‐b target the in vitro transcribed sense major satellite transcripts at their predicted cleavage sites.
- C
Diagram showing removal of putative piRNA targeting sites in in vitro transcribed sense major satellite transcripts. Wt, the wild‐type sequence (118 nt); ∆25, the mutated sense major satellite transcript with a deletion of 25‐nt sequences for disrupting the base pairing with both of piR major‐a and major‐b (93 nt); ∆a, the mutated sense major satellite transcript with a deletion of 10‐nt sequences for disrupting the base pairing with 5′‐end piR major‐a (108 nt); ∆b, the mutated form the mutated sense major satellite transcript with a deletion of 10‐nt sequences for disrupting the base pairing with 5′‐end piR major‐b (108 nt); ∆c, the mutated sense major satellite transcript with a deletion of 10‐nt sequences for disrupting the base pairing with 3′‐end piR major‐a (108 nt).
- D, E
In vitro RNA processing assay with the nuage–nuclear fraction from Miwi heterozygous (+/−), knockout (−/−) (D), and slicer activity‐deficient mutant (−/ADH) (E) testes, and 5′‐end labeled RNA targets corresponding to the indicated major satellite sequences. The antisense strand of major satellite transcript served as controls. Arrows indicate the cleavage product of the in vitro transcribed sense major satellite RNA.
- F
In vitro RNA processing assay with the nuage–nuclear fraction from Mov10l1 heterozygous (Mov10l1 f/+ ;Stra8‐Cre) and Mov10l1 germline knockout (Mov10l1 f/− ;Stra8‐Cre) testes, and 5′‐end labeled RNA targets corresponding to the indicated major satellite sequences. Mov10l1 f/− ;Stra8‐Cre mice reveal a pachytene piRNA‐deficient condition. The arrow indicates the cleavage products of In vitro transcribed sense major satellite RNA.

Schematic diagram showing organization of mouse major satellite repeats. The blue arrows indicate the two sets of gene‐specific primer (GSP) are used for 5′ RACE. The red solid line indicates the piRNA targeting site.
5′ RACE analysis of sense major satellite RNA in Miwi heterozygote (+/−) and knockout (−/−). The 5′ RACE PCR products were identified by gel electrophoresis. The arrows indicate 5′ RACE PCR products amplified from 5′ end of sense major satellite RNA.
5′ RACE PCR sequences amplified from Miwi heterozygote (+/−) are verified by cloning amplified products and further confirmed by sequencing to determine the MIWI slicing sites. The numbers of clones from 5′ RACE products by using GSP1 and GSP2 primers were 20 and 18, respectively. The percentage of the resulting 5′ RACE fragments are indicated. The red and green frames correspond to the piR major‐a and major‐b targeting sequence, respectively. The red and green arrows indicate the MIWI slicing sites guided by piR major‐a and major‐b, respectively.

RNA pull‐down was performed using in vitro transcribed biotinylated transcripts and whole‐cell extracts from Miwi +/−, Miwi −/−, Miwi −/ADH, and Mov10l1 f/− ;Stra8‐Cre testes. Mov10l1 f/− ;Stra8‐Cre mice represent a pachytene piRNA‐deficient condition. In vitro transcribed RNAs corresponding to approximately one repeat of major and minor satellite sequences were used as baits. Precipitated protein was visualized by Western blotting using anti‐Dicer antibody.
Equal amounts of total RNA isolated from spermatocytes of Miwi +/− ;Dicer f/+ ;Stra8‐Cre, Miwi −/− ;Dicer f/+ ;Stra8‐Cre, Miwi +/− ;Dicer f/− ;Stra8‐Cre, and Miwi −/− ;Dicer f/− ;Stra8‐Cre mice were resolved on a 1% agarose gel. The gel was subjected to Northern blot analysis using probes specific for the sense and antisense sequences of major and minor satellites. The blot was re‐hybridized with a 28S rRNA‐complementary probe to demonstrate equal loading (bottom on the left).
In vitro RNA processing assay with nuage‐enriched nuclear fraction from Miwi +/− ;Dicer f/+ ;Stra8‐Cre, Miwi −/− ;Dicer f/+ ;Stra8‐Cre, and Miwi +/− ;Dicer f/− ;Stra8‐Cre mice, and 5′‐end radioactively labeled RNA targets corresponding to approximately one and two repeats of sense and antisense major satellite sequences. Arrow indicates the cleavage products of In vitro transcribed sense major satellite RNAs by MIWI‐piRNA complex.
Equal amounts of total RNA isolated from spermatocytes of Miwi +/− ;Dicer f/+ ;Stra8‐Cre, Miwi −/− ;Dicer f/+ ;Stra8‐Cre, Miwi +/− ;Dicer f/− ;Stra8‐Cre, and Miwi −/− ;Dicer f/− ;Stra8‐Cre mice were digested with RNase III (RNase III) or nuclease S1 (S1), and further resolved on a 1% agarose gel. The gel was subjected to Northern blot analysis using probes specific for the sense (S) and antisense (As) strands of major (Maj) and minor (Min) satellite transcripts. The blot was re‐hybridized with 18S and 28S complementary probes to demonstrate equal loading and the same efficiency of RNase III or nuclease S1 digestion.
Sequential in vitro RNA processing assay using 5′‐end radioactively labeled RNA targets corresponding to approximately one repeat of sense and antisense major satellite sequences. The nuage–nuclear fraction from Miwi +/− testes is indicated as N. Total cellular extracts (T) from Miwi +/− testes were subjected to immunodepletion using anti‐Dicer antibodies (α‐Dicer), with IgG (IgG) as a negative control. The incubation time (Incub. t) was 0.5 and 1 h. The arrow indicates the product of MIWI‐mediated cleavage of the in vitro transcribed sense major satellite RNA.

- A
MIWI binds to major and possibly minor satellite RNAs in vivo. RNA immunoprecipitation assay was used for validating transcript binding by MIWI and Dicer in Miwi +/− and Miwi −/− testis. qRT–PCR analysis was performed to compare antibodies against the indicated proteins and control (by adding nonspecific IgG) immunoprecipitations of major satellite and minor satellite repeats. 5.8S rRNA and Gapdh were used as negative controls.
- B
The expression levels of satellite transcripts in Miwi, Dicer, and both knockout spermatocytes. Equal amounts of total RNA isolated from spermatocytes of Miwi +/− ;Dicer f/+ ;Stra8‐Cre, Miwi −/− ;Dicer f/+ ;Stra8‐Cre, Miwi +/− ;Dicer f/− ;Stra8‐Cre, and Miwi −/− ;Dicer f/− ;Stra8‐Cre mice were subjected to qRT–PCR with primers specific to major satellite RNA, minor satellite RNA, and negative controls 5S rRNA, 5.8S rRNA, and Gapdh mRNA. Data presented were normalized to 5S rRNA.
- C, D
The association between MIWI with Dicer is RNA‐mediated but piRNA‐independent. Immunoprecipitates (IP) of the testicular extracts (input) were prepared from Miwi +/− and Miwi −/− mice and subsequently analyzed by immunoblotting with antibodies against Dicer and MIWI (C). Input (lanes 1 and 2) represents direct loading that equals to 1/40 of the lysate protein used in the immunoprecipitates. RNase A and RNase inhibitor (RNase In.) treatments were performed during testicular extract preparation. TDRKH, a known MIWI interactor, served as a positive control. Histone H3 served as a negative control. Immunoprecipitation (IP) of the testicular lysates (input) prepared from Mov10l1 conditional knockout (Mov10l1 f/− ;Stra8‐Cre) mice was performed using antibodies specific for MIWI (IP) or control mouse antibodies (IgG), and subsequently analyzed by immunoblotting with antibodies against MIWI and Dicer (D). Input represents direct loading that equals to 1/20 and 1/40 of the lysate used in the immunoprecipitates. TDRKH served as a positive control. Histone H3 served as negative controls. Mov10l1 f/− ;Stra8‐Cre mice represent a pachytene piRNA‐deficient condition.

Frequency of overlapping, adjacent, and separated inner kinetochores. Spermatocytes from Miwi +/− ;Dicer f/+ ;Stra8‐Cre, Miwi −/− ;Dicer f/+ ;Stra8‐Cre, Miwi +/− ;Dicer f/− ;Stra8‐Cre, and Miwi −/− ;Dicer f/− ;Stra8‐Cre mice were used to examine sister kinetochore configuration at meiosis I as shown in Fig 3A and B. n = 3 mice for each genotype. The total numbers of counted cells in the four types of spermatocytes were 101, 117, 129, and 115, respectively. The total numbers of counted sister kinetochore pairs in the four types of spermatocytes were 4,040, 4,680, 5,160, and 4,600, respectively.
Frequency of the different sister kinetochore configurations. The four types of spermatocytes in A were used to examine sister kinetochore configurations in meiosis I metaphase with O‐O, S‐S, O‐S, or S‐O as defined in the text. n = 3 mice for each genotype. The total numbers of counted cells in the four types of spermatocytes were 134, 140, 140, and 130, respectively. The total numbers of counted sister kinetochore pairs in the four types of spermatocytes were 5,360, 5,600, 5,600, and 5,200, respectively.
Frequency of abnormal arrangement in the meiotic metaphase I plate. The four types of spermatocytes in A and B were used to perform immunofluorescence as shown in Fig 1B and C. n = 3 mice for each genotype. The total numbers of counted metaphase I plates in the four types of spermatocytes were 221, 181, 421, and 240, respectively.
Frequency of meiosis I metaphase cells with chromosomal abnormalities. The four types of spermatocytes in A‐C were used to perform a metaphase spread as shown in Fig 1H and I. n = 3 mice for each genotype. The total numbers of counted MI cells in the four types of spermatocytes were 89, 73, 132, and 104, respectively.
Frequency of meiosis II metaphase cells with chromosomal abnormalities. The four types of spermatocytes in A‐D were used to perform a metaphase spread as shown in Fig 1K and L. n = 3 mice for each genotype. The total numbers of counted MII cells in the four types of spermatocytes were 74, 87, 85, and 94, respectively.

Similar articles
-
CENP-A regulates chromosome segregation during the first meiosis of mouse oocytes.J Huazhong Univ Sci Technolog Med Sci. 2017 Jun;37(3):313-318. doi: 10.1007/s11596-017-1733-9. Epub 2017 Jun 6. J Huazhong Univ Sci Technolog Med Sci. 2017. PMID: 28585134
-
piRNA-associated proteins and retrotransposons are differentially expressed in murine testis and ovary of aryl hydrocarbon receptor deficient mice.Open Biol. 2016 Dec;6(12):160186. doi: 10.1098/rsob.160186. Open Biol. 2016. PMID: 28003471 Free PMC article.
-
MIWI associates with translational machinery and PIWI-interacting RNAs (piRNAs) in regulating spermatogenesis.Proc Natl Acad Sci U S A. 2006 Sep 5;103(36):13415-20. doi: 10.1073/pnas.0605506103. Epub 2006 Aug 24. Proc Natl Acad Sci U S A. 2006. PMID: 16938833 Free PMC article.
-
Conserved chromosomal functions of RNA interference.Nat Rev Genet. 2020 May;21(5):311-331. doi: 10.1038/s41576-019-0203-6. Epub 2020 Feb 12. Nat Rev Genet. 2020. PMID: 32051563 Free PMC article. Review.
-
Chromatin structure and ATRX function in mouse oocytes.Results Probl Cell Differ. 2012;55:45-68. doi: 10.1007/978-3-642-30406-4_3. Results Probl Cell Differ. 2012. PMID: 22918800 Review.
Cited by
-
Satellite DNAs in Health and Disease.Genes (Basel). 2022 Jun 26;13(7):1154. doi: 10.3390/genes13071154. Genes (Basel). 2022. PMID: 35885937 Free PMC article. Review.
-
The PIWI-specific insertion module helps load longer piRNAs for translational activation essential for male fertility.Sci China Life Sci. 2023 Jul;66(7):1459-1481. doi: 10.1007/s11427-023-2390-5. Epub 2023 Jun 15. Sci China Life Sci. 2023. PMID: 37335463
-
The functions and mechanisms of piRNAs in mediating mammalian spermatogenesis and their applications in reproductive medicine.Cell Mol Life Sci. 2024 Sep 2;81(1):379. doi: 10.1007/s00018-024-05399-6. Cell Mol Life Sci. 2024. PMID: 39222270 Free PMC article. Review.
-
Pseudoephedrine Nanoparticles Alleviate Adriamycin-Induced Reproductive Toxicity Through the GnRhR Signaling Pathway.Int J Nanomedicine. 2022 Apr 1;17:1549-1566. doi: 10.2147/IJN.S348673. eCollection 2022. Int J Nanomedicine. 2022. PMID: 35401001 Free PMC article.
-
NKAPL facilitates transcription pause-release and bridges elongation to initiation during meiosis exit.Nat Commun. 2025 Jan 17;16(1):791. doi: 10.1038/s41467-024-55579-y. Nat Commun. 2025. PMID: 39824811 Free PMC article.
References
Publication types
MeSH terms
Substances
Grants and funding
LinkOut - more resources
Full Text Sources
Molecular Biology Databases
Research Materials
