

Deep Learning Algorithm for Automated Segmentation and Volume Measurement of the Liver and Spleen Using Portal Venous Phase Computed Tomography Images
- PMID: 32677383
- PMCID: PMC7369202
- DOI: 10.3348/kjr.2020.0237
Deep Learning Algorithm for Automated Segmentation and Volume Measurement of the Liver and Spleen Using Portal Venous Phase Computed Tomography Images
Abstract
Objective: Measurement of the liver and spleen volumes has clinical implications. Although computed tomography (CT) volumetry is considered to be the most reliable noninvasive method for liver and spleen volume measurement, it has limited application in clinical practice due to its time-consuming segmentation process. We aimed to develop and validate a deep learning algorithm (DLA) for fully automated liver and spleen segmentation using portal venous phase CT images in various liver conditions.
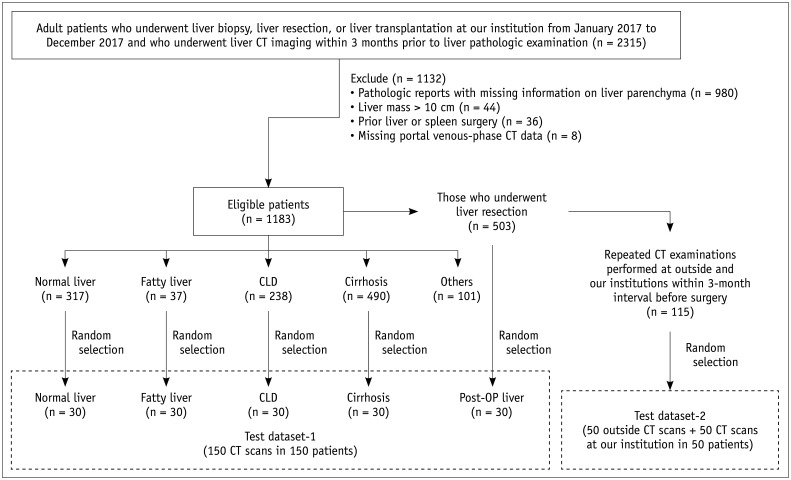
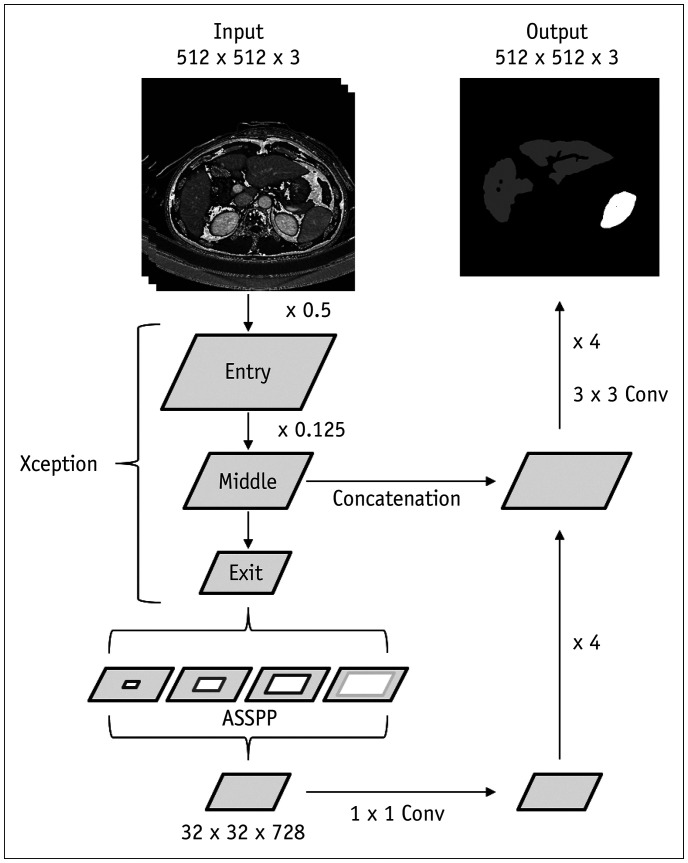
Materials and methods: A DLA for liver and spleen segmentation was trained using a development dataset of portal venous CT images from 813 patients. Performance of the DLA was evaluated in two separate test datasets: dataset-1 which included 150 CT examinations in patients with various liver conditions (i.e., healthy liver, fatty liver, chronic liver disease, cirrhosis, and post-hepatectomy) and dataset-2 which included 50 pairs of CT examinations performed at ours and other institutions. The performance of the DLA was evaluated using the dice similarity score (DSS) for segmentation and Bland-Altman 95% limits of agreement (LOA) for measurement of the volumetric indices, which was compared with that of ground truth manual segmentation.
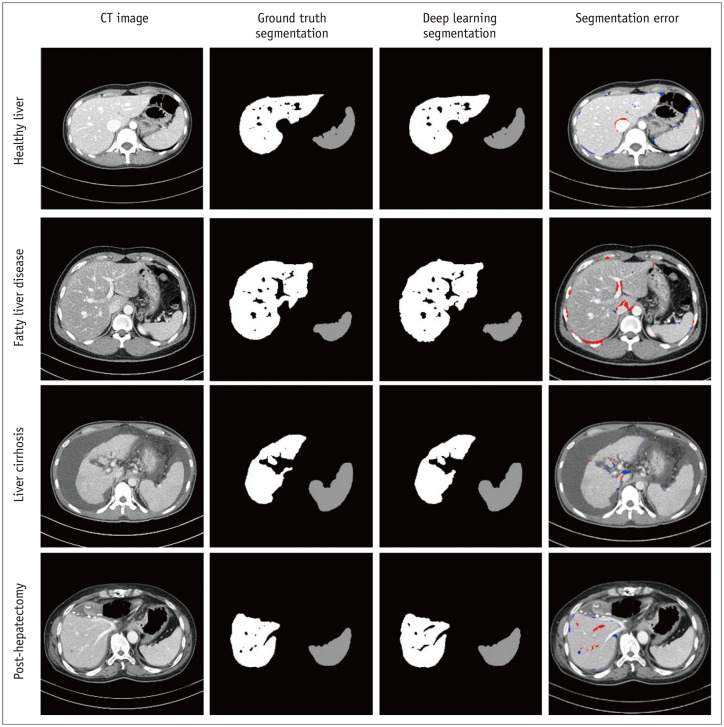
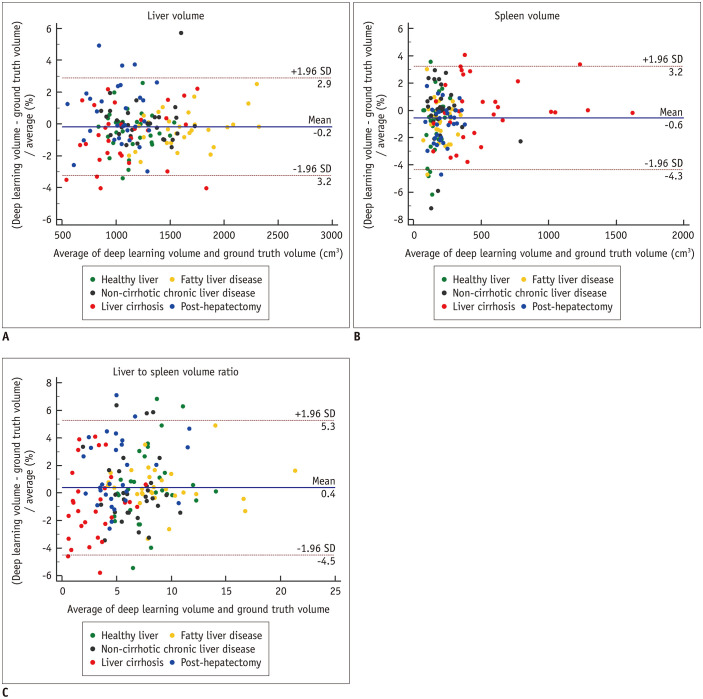
Results: In test dataset-1, the DLA achieved a mean DSS of 0.973 and 0.974 for liver and spleen segmentation, respectively, with no significant difference in DSS across different liver conditions (p = 0.60 and 0.26 for the liver and spleen, respectively). For the measurement of volumetric indices, the Bland-Altman 95% LOA was -0.17 ± 3.07% for liver volume and -0.56 ± 3.78% for spleen volume. In test dataset-2, DLA performance using CT images obtained at outside institutions and our institution was comparable for liver (DSS, 0.982 vs. 0.983; p = 0.28) and spleen (DSS, 0.969 vs. 0.968; p = 0.41) segmentation.
Conclusion: The DLA enabled highly accurate segmentation and volume measurement of the liver and spleen using portal venous phase CT images of patients with various liver conditions.
Keywords: Artificial intelligence; Deep learning; Liver; Segmentation; Spleen; Volumetry.
Copyright © 2020 The Korean Society of Radiology.
Conflict of interest statement
The authors have no potential conflicts of interest to disclose.
Figures
References
-
- Lim MC, Tan CH, Cai J, Zheng J, Kow AW. CT volumetry of the liver: where does it stand in clinical practice? Clin Radiol. 2014;69:887–895. - PubMed
-
- Ogasawara K, Une Y, Nakajima Y, Uchino J. The significance of measuring liver volume using computed tomographic images before and after hepatectomy. Surgery Today. 1995;25:43–48. - PubMed
-
- Prodeau M, Drumez E, Duhamel A, Vibert E, Farges O, Lassailly G, et al. An ordinal model to predict the risk of symptomatic liver failure in patients with cirrhosis undergoing hepatectomy. J Hepatol. 2019;71:920–929. - PubMed
-
- Huang Y, Huang B, Kan T, Yang B, Yuan M, Wang J. Liver-to-spleen ratio as an index of chronic liver diseases and safety of hepatectomy: a pilot study. World J Surg. 2014;38:3186–3192. - PubMed
