. 2020 Jun;12(12):1053-1070.
doi: 10.2217/epi-2019-0319. Epub 2020 Jul 17.

Epigenomic programming in early fetal brain development

Affiliations

Epigenomic programming in early fetal brain development

Luolan Li et al. Epigenomics. 2020 Jun.

Abstract

Aim: To provide a comprehensive understanding of gene regulatory networks in the developing human brain and a foundation for interpreting pathogenic deregulation. Materials & methods: We generated reference epigenomes and transcriptomes of dissected brain regions and primary neural progenitor cells (NPCs) derived from cortical and ganglionic eminence tissues of four normal human fetuses. Results: Integration of these data across developmental stages revealed a directional increase in active regulatory states, transcription factor activities and gene transcription with developmental stage. Consistent with differences in their biology, NPCs derived from cortical and ganglionic eminence regions contained common, region specific, and gestational week specific regulatory states. Conclusion: We provide a high-resolution regulatory network for NPCs from different brain regions as a comprehensive reference for future studies.

Keywords: DNA methylation; brain; cortex; enhancer; epigenetics; fetal; ganglionic eminence; gestational week; neural progenitor cells; transcriptional network.


Conflict of interest statement

Financial & competing interests disclosure

This work was supported with funding provided by the US National Institutes of Health (NIH) Roadmap Epigenomics Program, NIH grant 5U01ES017154-02 and from Genome British Columbia and the Canadian Institutes of Health Research as part of the Canadian Epigenetics, Environment and Health Research Consortium Network (CIHR-262119). L Li is supported by a Genome Science and Technology Graduate Program Fellowship, University of British Columbia. The authors have no other relevant affiliations or financial involvement with any organization or entity with a financial interest in or financial conflict with the subject matter or materials discussed in the manuscript apart from those disclosed.

No writing assistance was utilized in the production of this manuscript.

Figures

Figure 1.
Figure 1.. Experimental design and overview.
(A) Human brain coronal section highlighting the section plan used during dissection to isolate specific regions as pictured by the boxed area on the hematoxylin eosin section. (B) Summary of sample information and bioinformatics analysis design. Boxes outline the pairwise comparisons, including comparisons between cortex and GE-derived NPCs (blue), across three gestational weeks (orange), and between MZ twins (red). GE: Ganglionic eminence; GW: Gestational week; MZ: Monozygotic; NPC: Neural progenitor cell; WGBS: Whole-genome bisulfite sequencing.
Figure 2.
Figure 2.. Characterization of fetal brain-derived neural progenitor cells.
(A) Cells isolated from the cortex or GE are able to proliferate when cultured as neurospheres and maintain a stem/progenitor phenotype, confirmed by the expression of SOX2 and OLIG2. (B) When grown in presence of growth factors, NPCs express a mixture of stem cell markers (NESTIN+, SOX2+, OLIG2+), glial progenitors (OLIG2+, A2B5+, MASH1-), astrocytes (GFAP+) and neuroblasts (MAP5+) with cortex-derived NPCs presenting a more neuronal phenotype (MASH1 high, MAP5 high) while the GE-derived NPCs have a more glial phenotype (A2B5 high, GFAP more differentiated). (C) In 2% serum, NPCs are differentiate into a neuronal lineage, from an immature neuroblast (MAP2+, MAP5+) to a migrating neurons (Doublecortin DCX+, TUJ1+) to a postmitotic neuron (CALRETININ+), as well as into GFAP+ astrocytes. FBS: Fetal bovine serum; GE: Ganglionic eminence; GW: Gestational week; NPC: Neural progenitor cell.
Figure 3.
Figure 3.. Cortex and ganglionic eminence-derived neural progenitor cells were epigenetically distinct.
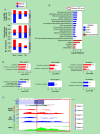
(A) DMRs between cortex and GE-derived NPCs. More hypomethylated DMRs were identified in cortex NPCs (red) compared with GE NPCs (blue). Moreover, there were fewer DMRs found in GW13 (Subject 4, inner circles) than GW17 (Subject 2, outer circles). (B) GREAT Gene Ontology biological processes showed enrichment (region-based binomial and hypergeometric FDR <0.05) in forebrain development terms in cortex hypomethylated DMRs (red), and neuron differentiation and cell fate commitment in GE hypomethylated DMRs (blue). (C) University of California, Santa Cruz genome browser tracks of examples of key regulators that were hypomethylated in the promoters and upregulated in cortex-derived NPCs, top panel: GFAP, bottom panel: NFIX. DMR: Differentially methylated region; FDR: False discovery rate; GE: Ganglionic eminence; NPC: Neural progenitor cell.
Figure 4
Figure 4. Temporal changes revealed a more active epigenetic state in the later developmental stages.
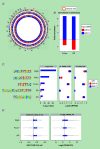
(A) DMRs between GW13 and GW17. We identified more hypomethylated DMRs in GW17 (blue) than GW13 (red) in both GE-derived NPCs (inner circles) and cortex-derived NPCs (outer circles). (B) Fold enrichment of DMRs between GW13 and GW17 in core NPC enhancers. GW13 hypomethylated DMRs, shown in red, were not enriched in the enhancers, while GW17 hypomethylated DMRs, shown in blue, were enriched. (C) Transcription factors exclusively enriched (Benjamini corrected p < 0.01, left panel and percent of enhancers with motif >20%) in GW17 unique enhancers, and their transcription levels in cortex-derived NPCs (middle panel) and GE-derived NPCs (right panel). GW13 expression values are shown in red, and GW17 are shown in blue. Out of the five transcription factors, OLIG2, FOXO1 and AR were expressed. (D) Methylation differences between GW17 and GW13 in enhancers with the particular transcription factor binding sites showed hypomethylation in GW17 (left panel). The vertical line, indicating hypomethylation greater than 0.2, was used as a cut-off for hypomethylated enhancers. Fold change of transcriptional levels between GW17 and GW13 for the nearest genes of the hypomethylated enhancers identified in the left panel showed upregulation in GW17 (right panel). The vertical line indicates twofold increase in expression. DMR: Differentially methylated region; FC: Fold change; GE: Ganglionic eminence; NPC: Neural progenitor cell; RPKM: Reads per kilobase of transcript, per million mapped reads; TF: Transcription factor.
Figure 5.
Figure 5.. Regulatory network of OLIG2.
(A) UCSC genome browser tracks showed OLIG2 hypomethylated in promoter region and upregulated in GW17. (B) Heatmap of enhancer signal level (H3K4me1) of GW17 specific enhancers with OLIG2 binding sites (left), their corresponding DNA fractional methylation (middle) and transcription levels of their nearest genes (right) showed hypomethylation of the enhancers and upregulation of the predicted target genes in GW17. (C) DAVID [57] GO biological processes enrichment analysis of OLIG2 target genes indicating significant enrichment for brain development related biological processes. (D) Cytoscape network of OLIG2 target genes that are differential expressed. A total of 22 genes were upregulated in GW17 (red) while only 3 were downregulated (green). The size of the circles corresponds to the fold change of expression levels between GW17 and GW13. Among the upregulated genes, EPHA3, NTN1, NTNG1 and SLIT2 were associated with axon guidance and cell migration. FDR: False discovery rate; GE: Ganglionic eminence; GO: Gene ontology; GW: Gestational week; mC: Methyl-cytosine; RPKM: Reads per kilobase of transcript; UCSC: University of California, Santa Cruz.
Figure 6.
Figure 6.. Stage-specific differential expression.
(A) Unsupervised clustering of expression levels of protein coding genes. NPCs derived from different regions clustered together at GW13. However, by GW15, GE-derived NPCs still clustered with GW13 NPCs, while cortex-derived NPCs branched off and clustered with GW17 cortex NPCs. (B) Number of differentially expressed genes between different gestational weeks (left panel: GW13 vs GW17, middle panel: GW15 vs GW17, right panel: GW13 vs GW15) in cortex-derived NPCs (red), GE-derived NPCs (blue) and shared by two cell populations (purple). Bars pointing up showed upregulation in the later stages, and bars pointing down showed downregulation, suggesting a general trend of upregulation in later stages. (C) Patterns of expression for genes differential expressed between gestational weeks in cortex-derived NPCs (top panel), in GE-derived NPCs (middle panel) and in genes shared by both cortex and GE-derived NPCs (bottom panel). Genes are divided into eight expression profile groups according to differential expression analysis of GW13 vs GW15 and GW15 vs GW17, represented by the arrows of eight different colors. The thickness of the line and the number in each panel corresponded to the number of genes within each category, and the dashed lines means no genes in that category. Cortex-derived NPCs showed dominant transcription activation in GW13-GW15, while GE-derived NPCs showed similar activation but in GW15-GW17. (D) Heatmap for expression values of stage-specific differential expressed genes in cortex NPCs and GE NPCs showed stage-specific expression patterns for key regulators of brain development. DN: Downregulated; GE: Ganglionic eminence; GW: Gestational week; NPC: Neural progenitor cell; ST: Stable, not differentially expressed; UP: Upregulated.
Figure 7.
Figure 7.. Epigenetic and transcriptional differences between monozygotic twins arise early in fetal brain development.
(A) Total DMR length (top panel), number of enriched bases in enhancers (middle panel) and number of differential expressed genes (bottom panel) between MZ twins. Subject1-specific hypomethylated DMRs/enhancers and upregulated genes were shown in red, and Subject2-specific ones were shown in blue. (B) DMRs between MZ twins in three tissue and cell populations from GREAT [61] functional enrichment analysis all showed enrichment in Homeobox protein domains. (C) UCSC genome browser MeDIP-seq tracks showed hypermethylation in Subject2 compared with Subject1 at the promoter region of CCDC169 in dissected brain tissue as well as cortex and GE-derived NPCs. (D) DAVID [57] functional enrichment analysis for genes differentially methylated in their promoters and differentially expressed between the MZ twins showed enrichment in brain developmental processes. DE: Differential expression; DMR: Differentially methylated region; FDR: False discovery rate; GE: Ganglionic eminence; GOBP: Gene ontology – biological process; GOMF: Gene ontology – molecular function; MeDIP-seq: Methylated DNA immunoprecipitation sequencing; MZ: Monozygotic; NPC: Neural progenitor cell; UCSC: University of California, Santa Cruz.

References

    1. Llorens-Bobadilla E, Zhao S, Baser A, Saiz-Castro G, Zwadlo K, Martin-Villalba A Single-cell transcriptomics reveals a population of dormant neural stem cells that become activated upon brain injury. Cell Stem Cell 17(3), 329–340 (2015). - PubMed
    2. • Provides a comprehensive transcriptome mapping of neural stem cells upon injury at a single cell level.

    1. Luo Y, Coskun V, Liang A et al. Single-cell transcriptome analyses reveal signals to activate dormant neural stem cells. Cell 161(5), 1175–1186 (2015). - PMC - PubMed
    1. Darmanis S, Sloan SA, Zhang Y et al. A survey of human brain transcriptome diversity at the single cell level. Proc. Natl Acad. Sci. 112(23), 7285–7290 (2015). - PMC - PubMed
    1. Prajapati B, Fatma M, Maddhesiya P et al. Identification and epigenetic analysis of divergent long non-coding RNAs in multilineage differentiation of human neural progenitor cells. RNA Biol. 16(1), 13–24 (2019). - PMC - PubMed
    1. Zhu Y, Sousa AMM, Gao T et al. Spatiotemporal transcriptomic divergence across human and macaque brain development. Science 362(6420), (2018). - PMC - PubMed
    2. • Provides a comprehensive map of the transcriptome across a wide array of normal brain regions during development.

Publication types