. 2020 Jul 16;20(1):661.
doi: 10.1186/s12885-020-07134-3.

Transcriptomic insight into salinomycin mechanisms in breast cancer cell lines: synergistic effects with dasatinib and induction of estrogen receptor β

Affiliations

Transcriptomic insight into salinomycin mechanisms in breast cancer cell lines: synergistic effects with dasatinib and induction of estrogen receptor β

Vanessa Bellat et al. BMC Cancer. .

Abstract

Background: Tumors are heterogeneous in nature, composed of different cell populations with various mutations and/or phenotypes. Using a single drug to encounter cancer progression is generally ineffective. To improve the treatment outcome, multiple drugs of distinctive mechanisms but complementary anticancer activities (combination therapy) are often used to enhance antitumor efficacy and minimize the risk of acquiring drug resistance. We report here the synergistic effects of salinomycin (a polyether antibiotic) and dasatinib (a Src kinase inhibitor).

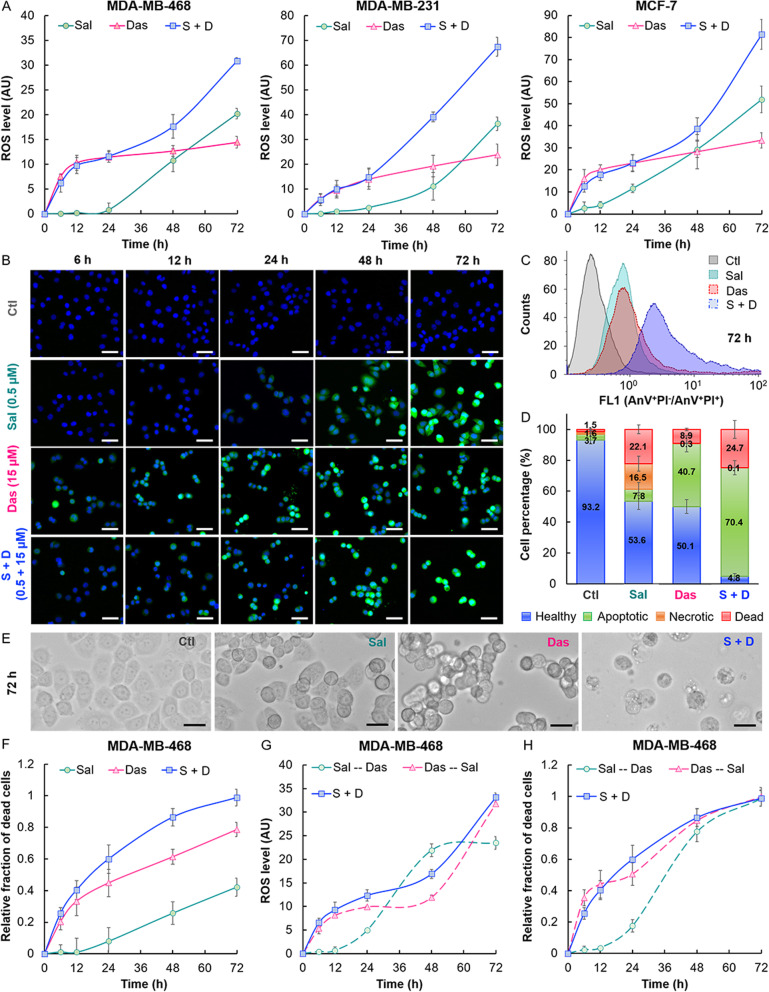
Methods: Functionally, both drugs induce cell cycle arrest, intracellular reactive oxygen species (iROS) production, and apoptosis. We rationalized that an overlapping of the drug activities should offer an enhanced anticancer effect, either through vertical inhibition of the Src-STAT3 axis or horizontal suppression of multiple pathways. We determined the toxicity induced by the drug combination and studied the kinetics of iROS production by fluorescence imaging and flow cytometry. Using genomic and proteomic techniques, including RNA-sequencing (RNA-seq), reverse transcription-quantitative polymerase chain reaction (RT-qPCR), and Western Blot, we subsequently identified the responsible pathways that contributed to the synergistic effects of the drug combination.

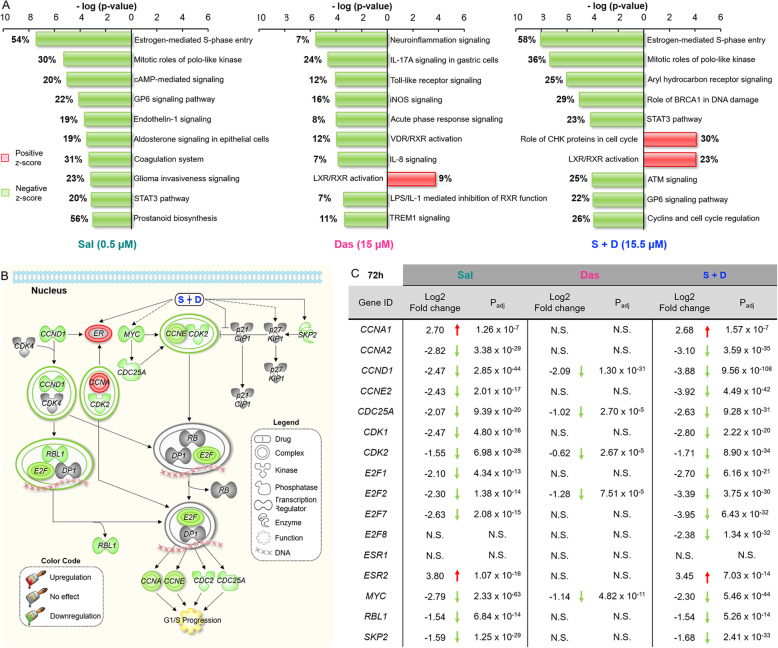
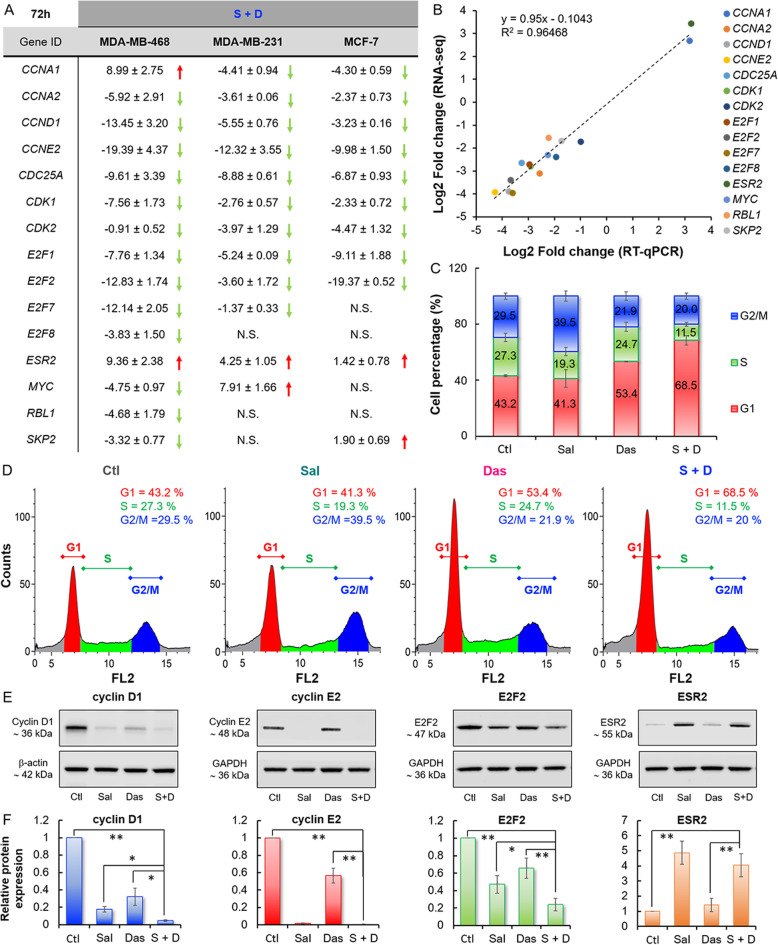
Results: Compared to either drug alone, the drug combination showed enhanced potency against MDA-MB-468, MDA-MB-231, and MCF-7 human breast cancer (BC) cell lines and tumor spheroids. The drug combination induces both iROS generation and apoptosis in a time-dependent manner, following a 2-step kinetic profile. RNA-seq data revealed that the drug combination exhibited synergism through horizontal suppression of multiple pathways, possibly through a promotion of cell cycle arrest at the G1/S phase via the estrogen-mediated S-phase entry pathway, and partially via the BRCA1 and DNA damage response pathway.

Conclusion: Transcriptomic analyses revealed for the first time, that the estrogen-mediated S-phase entry pathway partially contributed to the synergistic effect of the drug combination. More importantly, our studies led to the discoveries of new potential therapeutic targets, such as E2F2, as well as a novel drug-induced targeting of estrogen receptor β (ESR2) approach for triple-negative breast cancer treatment, currently lacking of targeted therapies.

Keywords: Cell signaling pathway; Estrogen receptor β (ESR2); Synergistic drug combination; Transcriptome and proteomic analysis; Triple negative breast cancer (TNBC).


Conflict of interest statement

The authors declare no competing interests.

Figures

Fig. 1
Fig. 1
Evaluation of the cytotoxicity of salinomycin (Sal) and dasatinib (Das) as single drugs or a 2-drug combination on MDA-MB-468, MDA-MB-231, and MCF-7 cell lines (monolayer cell culture system) and tumor spheroids. a Chemical structures of the drugs. b A comparison of the potencies of individual drugs. To measure cell viability, different human BC cell lines, cultured in monolayers, were incubated with the drugs at various concentrations for 72 h. The results were fit into sigmoidal dose response curves for calculating the IC50 values. c A table summarizing the specific IC50 values of both Sal and Das. Sal was more potent than Das regardless of the cell line tested. d A table summarizing the synergism of the same drug combination but different applied drug ratios of Sal and Das for treating various BC cell lines. Drug combinations had a stronger synergistic effect on MDA-MB-468, as shown by the lower CI95 values. The CI95 values were determined using the previously described Chou-Talalay method [6]. Note that CI95 represents the specific CI value where there is a 95% cell growth inhibition. e A schematic diagram showing the method for preparing tumor spheroids. f Representative microscopic images of the MDA-MB-468, MDA-MB-231, and MCF-7 spheroids. Scale bar is 200 μm. g The cytotoxic effect of the drugs alone. The spheroids were treated with drugs at various concentrations for 72 h. The results from the viability assays were fit into sigmoidal dose response curves for determining the IC50 values. h A table summarizing the specific IC50 values of Sal and Das tested on different tumor spheroids. i A comparison of the synergism of different drug combination regimens, applied concurrently at different drug ratios, for eradicating the spheroids. All the experiments were independently performed in triplicate
Fig. 2
Fig. 2
The drug combination enriched iROS production and promoted cytotoxicity compared to Sal or Das alone, in a time-dependent manner. a Plots of the drug-induced iROS level versus time. The induction of iROS by the drug combination followed a 2-step kinetic. MDA-MB-468, MDA-MB-231, and MCF-7 cell lines were treated with individual drugs (at the corresponding IC50 concentration (Fig. 1c)) or the 2-drug mixture prior to incubation with DCF-DA for FACS analysis of the iROS level. The mean fluorescence was calculated by comparison with PBS-treated cells (control). b Fluorescence microscopy confirmed that the drug-induced iROS increase in treated MDA-MB-468 cells was time-dependent. Prior to imaging, the cells were treated with DCF-DA and DAPI for staining the iROS (green) and nucleus (blue), respectively. Scale bar is 45 μm. c A flow cytometry graph showing the increase of the apoptotic (AnV+PI)/dead (AnV+PI+) cell population in response to the drug treatments. MDA-MB-468 cells were incubated with Sal (0.5 μM), Das (15 μM) or the 2-drugs combination for 72 h prior to staining with AnV-FITC and PI for FACS analysis. d Graph bars showing the percentage of healthy, apoptotic, necrotic, and dead cells following treatment with PBS (control) Sal, Das, or S + D for 72 h (see Fig.S6 for detailed quantification of the cell populations). e Representative microscopic images of MDA-MB-468 cells 72 h after drug incubation. Scale bar is 25 μm. f Cell viability assay showed that the cytotoxicities of Sal and Das alone or the drug combination were also time-dependent. g-h Comparing the cytotoxicities of the same drug combination applied sequentially and concurrently for treating MDA-MB-468 cell line. The cells were treated sequentially with Sal and followed by Das (Sal--Das) or Das and then Sal (Das--Sal), or concurrently with Sal and Das (S + D). The concentration of Sal and Das used in this study was 0.5 and 15 μM, respectively. Plots showing the changes in the (g) iROS level and (h) ratio of the drug-treated to non-treated cell numbers over time. All the experiments were independently performed in triplicate
Fig. 3
Fig. 3
Inhibition of STAT3, Wnt/β-catenin, and hedgehog signaling pathways by Sal and Das. a Venn diagrams showing the total number of genes that were commonly regulated (downregulated and upregulated) by the 3 different drug treatments (Sal, Das, and S + D). MDA-MB-468 cells were incubated with the drugs for 24 h and 72 h prior RNA-seq analysis. b A pie chart showing the number of genes that were commonly upregulated and downregulated among the treatment conditions. c Graph bars showing the percentage of drug-induced upregulation and downregulation of the targeted genes that are known to be modulated by the STAT3 (13 genes), Wnt/β-catenin (10 genes), and hedgehog (32 genes) pathways (also see Fig.S8 for the full list of the genes analyzed). MDA-MB-468 cells were treated with drugs alone or in combination for 72 h prior to extract the mRNAs for RNA-seq analysis. The experiments were independently performed in quadruplicate. d Venn diagrams showing a significant overlapping of the activities between Sal and Das. e Lists of the genes that were commonly downregulated by Sal, Das, and the drug combination
Fig. 4
Fig. 4
Sal and Das modulated multiple cellular pathways. a Bar graphs showing the 10 most significant canonical pathways that were modulated by the drugs alone or in combination. The estrogen-mediated S-phase entry pathway was found to be the most significant one suppressed by the drug combination. The number next to each bar represents the percentage of modulated genes associated with the pathway. MDA-MB-468 cells were treated with Sal (0.5 μM) or Das (15 μM) or the drug combination for 72 h prior to perform the RNA-seq analysis. b A diagram showing how the genes associated with the estrogen-mediated S-phase entry pathway was significantly suppressed by the drug combination. c A table summarizing the differential gene expression of cells treated with drugs alone or together. The differential gene expression was presented as a log2 fold change relative to the corresponding gene expression in cells treated with PBS (control). The experiments were performed in quadruplicate. N.S. = no significant change of the gene expression
Fig. 5
Fig. 5
The drug combination enhanced cell cycle arrest at the G1/S phase. a A table summarizing the changes in the expression of genes (induced by the drug combination) associated with the estrogen-mediated S-phase entry pathway. The mRNAs were extracted from different BC cell lines 72 h after treatment with the drug combination prior to RT-qPCR analysis. b A correlation plot of the differential gene expression levels in MDA-MB-468 cell lines determined using RNA-seq and RT-qPCR methods. c Plots of cell counts versus the propidium iodide fluorescence (FL2). MDA-MB-468 cells were treated with PBS (control), Sal (0.5 μM), Das (15 μM), or the drug combination for 72 h, fixed in ethanol, and incubated with propidium iodide and RNase staining solution prior to FACS analysis. All the experiments were performed in triplicate. d Graph bars showing the percentage of cells at G1, S, and G2/M phases after the drug treatments. e The drug combination also modulated the estrogen-mediated S-phase entry pathway at the translational level. Western Blot analysis of cyclin D1, cyclin E2, E2F2, and ESR2 protein expression in MDA-MB-468 cells after exposure to the drugs alone or in combination for 72 h. GAPDH and β-actin were used as loading controls based on the molecular weight of the proteins of interest. The blots were processed and cropped using Image Studio Lite 5.2 software. Full-length blots are available Fig.S13. f Graph bar showing the expression level of each selected protein. The relative protein expression levels were quantified using Image Studio software and normalized to the control cells treated with PBS. All the experiments were performed in triplicate. Data were presented as mean ± standard deviation (SD) and statistical differences were analyzed using Student’s t-test (*P < 0.05, **P < 0.01)
Fig. 6
Fig. 6
Sal-induced the targeting of TNBC. a Sal induced ESR2 in MDA-MB-468 cell line. A flow cytometry graph showing an upregulation of ESR2 expression in response to Sal or the drug combination of Sal and Das treatment. The cells were treated with drugs alone (at the corresponding IC50 concentration (Fig. 1c)) or 2-drugs combination prior to incubation with phycoerythrin-labeled anti-ESR2 for FACS analysis. b Representative fluorescence microscopic images showing Sal induced ESR2 in MDA-MB-468 cells. Prior to imaging, the cells were incubated with phycoerythrin-labeled anti-ESR2 and DAPI for staining the ESR2 receptors (green) and the nucleus (blue), respectively. Scale bar is 60 μm. c Flow cytometry graph showing that the ESR2 expression induced by the salinomycin treatment was knocked down with siRNA. MDA-MB-468 cells were simultaneously treated with Sal (0.5 μM) and transfected with Silencer Select ESR2 siRNA oligonucleotides for 72 h. Ctl1 and ctl2 siRNA were used as negative controls. d Plots of the relative cell viability of MDA-MB-468 cells 72 h after treatment with Sal, Tamo, or the drug combination (S + T) with no siRNA transfection or in the presence of ctl1 siRNA (negative control) or with siRNA of ESR2. Data were presented as mean ± standard deviation (SD) and statistical differences were analyzed using Student’s t-test (*P < 0.05). e Synergistic cytotoxicity of Sal and Tamo. Stimulated plots of the CI values of the drug combination at a drug ratio of 1:2 versus the cellular fraction affected (Fa) values. The plots were generated using the CompuSyn software. All the experiments were independently performed in triplicate. f Comparing the cytotoxic effect of Tamo on MDA-MB-468 cells pre-treated with Sal and PBS. The cells were pre-treated with PBS (control) or Sal (0.5 μM) for 72 h and then be trypsinized. Same number of cells were re-seeded and immediately treated with Tamo (1 μM) for 72 h. The results were fit into sigmoidal dose response curves for calculating the IC50 values. The experiments were independently performed in triplicate
Fig. 7
Fig. 7
Sal and Das together synergistically inhibited the BRCA1 pathway in the MDA-MB-468 cell line. A schematic diagram showing how the drug combination inhibited the BRAC1 pathway. The drug combination selectively suppressed the genes associated with the formation of complex B within the BRCA1 pathway

References

    1. Siegel RL, Miller KD, Jemal A. Cancer statistics, 2019. Ca-Cancer J Clin. 2019;69(1):7–34. doi: 10.3322/caac.21551. - DOI - PubMed
    1. von Minckwitz G, Schneeweiss A, Loibl S, Salat C, Denkert C, Rezai M, Blohmer JU, Jackisch C, Paepke S, Gerber B, Zahm DM, Kummel S, Eidtmann H, Klare P, Huober J, Costa S, Tesch H, Hanusch C, Hilfrich J, Khandan F, Fasching PA, Sinn BV, Engels K, Mehta K, Nekljudova V, Untch M. Neoadjuvant carboplatin in patients with triple-negative and HER2-positive early breast cancer (GeparSixto; GBG 66): a randomised phase 2 trial. Lancet Oncol. 2014;15(7):747–756. doi: 10.1016/S1470-2045(14)70160-3. - DOI - PubMed
    1. Sikov WM, Berry DA, Perou CM, Singh B, Cirrincione CT, Tolaney SM, Kuzma CS, Pluard TJ, Somlo G, Port ER, Golshan M, Bellon JR, Collyar D, Hahn OM, Carey LA, Hudis CA, Winer EP. Impact of the addition of carboplatin and/or bevacizumab to neoadjuvant once-per-week paclitaxel followed by dose-dense doxorubicin and cyclophosphamide on pathologic complete response rates in stage II to III triple-negative breast cancer: CALGB 40603 (Alliance) J Clin Oncol. 2015;33(1):13–21. doi: 10.1200/JCO.2014.57.0572. - DOI - PMC - PubMed
    1. Qi WX, Tang LN, He AN, Shen Z, Yao Y. Comparison between doublet agents versus single agent in metastatic breast cancer patients previously treated with an anthracycline and a taxane: a meta-analysis of four phase III trials. Breast. 2013;22(3):314–319. doi: 10.1016/j.breast.2012.07.014. - DOI - PubMed
    1. Nunes T, Hamdan D, Leboeuf C, El Bouchtaoui M, Gapihan G, Nguyen TT, Meles S, Angeli E, Ratajczak P, Lu H, Di Benedetto M, Bousquet G, Janin A. Targeting Cancer stem cells to overcome Chemoresistance. Int J Mol Sci. 2018;19(12). 10.3390/ijms19124036. - PMC - PubMed

MeSH terms

LinkOut - more resources