Meta-Analysis
. 2020 Jul 16;11(1):3570.
doi: 10.1038/s41467-020-17312-3.

Multivariate genomic scan implicates novel loci and haem metabolism in human ageing

Affiliations
Meta-Analysis

Multivariate genomic scan implicates novel loci and haem metabolism in human ageing

Paul R H J Timmers et al. Nat Commun. .

Abstract

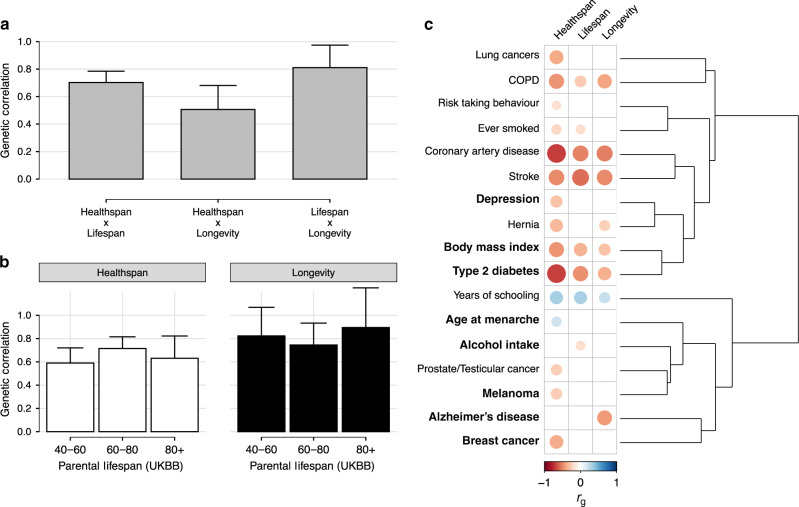
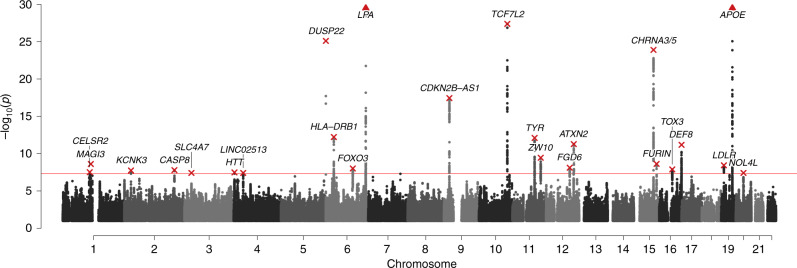
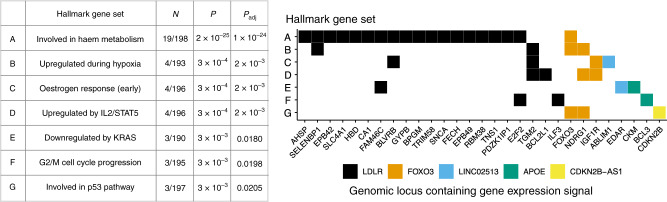
Ageing phenotypes, such as years lived in good health (healthspan), total years lived (lifespan), and survival until an exceptional old age (longevity), are of interest to us all but require exceptionally large sample sizes to study genetically. Here we combine existing genome-wide association summary statistics for healthspan, parental lifespan, and longevity in a multivariate framework, increasing statistical power, and identify 10 genomic loci which influence all three phenotypes, of which five (near FOXO3, SLC4A7, LINC02513, ZW10, and FGD6) have not been reported previously at genome-wide significance. The majority of these 10 loci are associated with cardiovascular disease and some affect the expression of genes known to change their activity with age. In total, we implicate 78 genes, and find these to be enriched for ageing pathways previously highlighted in model organisms, such as the response to DNA damage, apoptosis, and homeostasis. Finally, we identify a pathway worthy of further study: haem metabolism.


Conflict of interest statement

The authors declare no competing interests.

Figures

Fig. 1
Fig. 1. Healthspan, parental lifespan, and longevity are highly genetically correlated.
a Pairwise genetic correlation between human ageing studies. b Genetic correlations of age-stratified parental lifespan against healthspan and longevity. c Genetic correlations (rg) of ageing traits with traits related to development, behaviour, and disease. In bold are traits with heterogeneous correlations (Phet < 0.05). Displayed here are 17 traits which have at least one significant (FDR < 5%) genetic correlation with healthspan, parental lifespan, or longevity, out of the 27 traits tested. The 17 traits are clustered by Euclidean distance based on their genetic correlation with all tested traits (30 in total). See Supplementary Data 1 for a full list of correlations and Supplementary Table 1 for the number of SNPs used to calculate each pairwise correlation. Blank squares represent correlations which did not pass multiple testing correction. Note that fewer correlations with longevity will pass this threshold due to the smaller sample size of this GWAS. Error bars represent 95% confidence intervals of the correlation estimates. COPD: chronic obstructive pulmonary disease.
Fig. 2
Fig. 2. Twenty-four multivariate loci identified at genome-wide significance.
Manhattan plot showing the nominal strength of association −log10(P value) (two-sided) on the y-axis against the chromosomal position of SNPs on the x-axis, where the null hypothesis is no association with healthspan, parental lifespan, and longevity. The red line represents the genome-wide significance threshold (5 × 10–8). Annotated are the nearest gene(s) to the lead SNP (in red) of each locus. The y-axis has been capped at 5 × 10−30 to aid legibility; SNPs passing this cap are represented as triangles: LPA, P = 3.8 × 10−30, APOE, P = 9.6 × 10−127.
Fig. 3
Fig. 3. Seven hallmark gene pathways are enriched for ageing-related genes.
N number of genes of interest vs. total number of genes in the gene set for which eQTL are available. P Nominal P value of the hypergeometric test for enrichment (against 24,670 background genes). Pbonf Bonferroni-corrected P value for testing seven hallmark pathways (containing at least three genes). The figure shows individual genes on the x-axis and hallmark pathways are listed on the y-axis, matching the order of the table. Squares represent the presence of a gene in the gene set.

Similar articles

Cited by

References

    1. Sebastiani P, Perls TT. The genetics of extreme longevity: lessons from the new england centenarian study. Front. Genet. 2012;3:277. - PMC - PubMed
    1. Ruby JG, et al. Estimates of the heritability of human longevity are substantially inflated due to assortative mating. Genetics. 2018;210:1109–1124. - PMC - PubMed
    1. Zenin A, et al. Identification of 12 genetic loci associated with human healthspan. Commun. Biol. 2019;2:41. - PMC - PubMed
    1. Walter S, et al. A genome-wide association study of aging. Neurobiol. Aging. 2011;32:e15–2109. - PMC - PubMed
    1. Joshi PK, et al. Genome-wide meta-analysis associates HLA-DQA1/DRB1 and LPA and lifestyle factors with human longevity. Nat. Commun. 2017;8:910. - PMC - PubMed

Publication types