. 2020 Jul 16;11(1):3569.
doi: 10.1038/s41467-020-17060-4.

Disruption of the tumour-associated EMP3 enhances erythroid proliferation and causes the MAM-negative phenotype

Affiliations

Disruption of the tumour-associated EMP3 enhances erythroid proliferation and causes the MAM-negative phenotype

Nicole Thornton et al. Nat Commun. .

Abstract

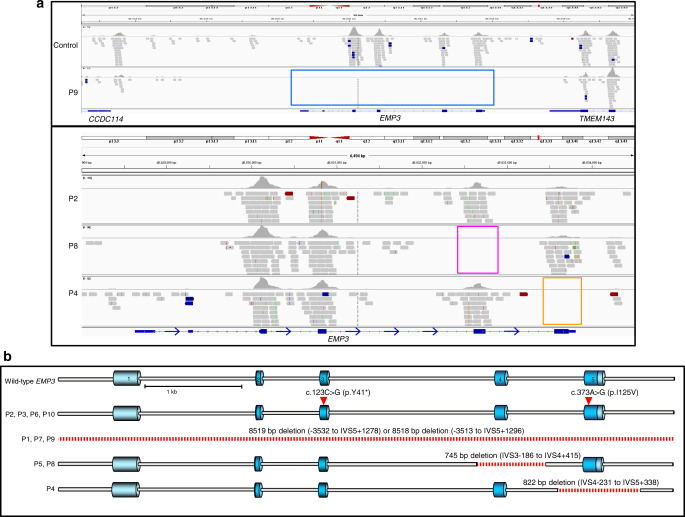
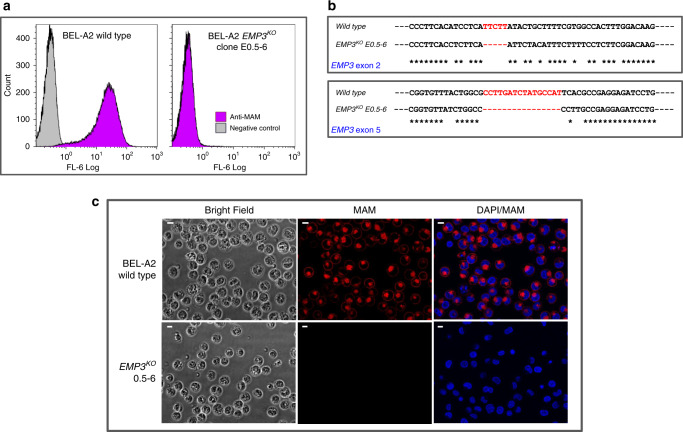
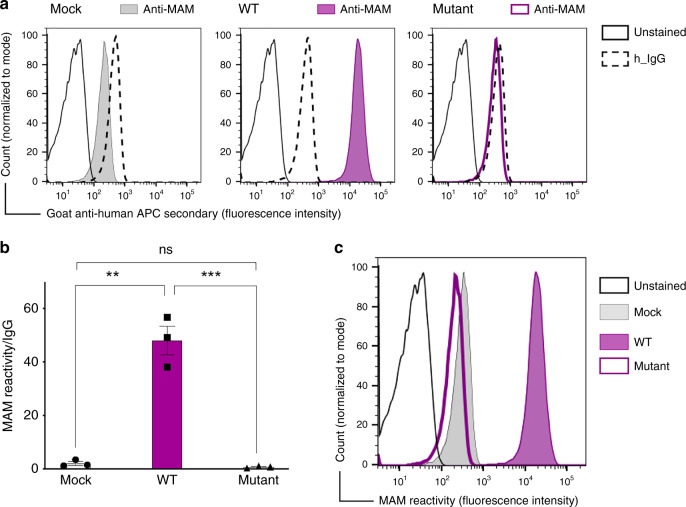
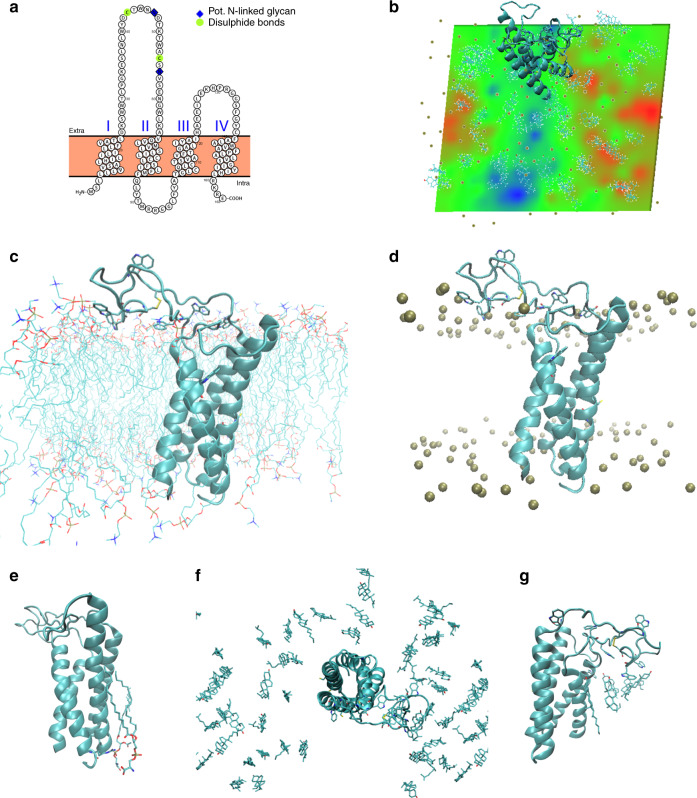
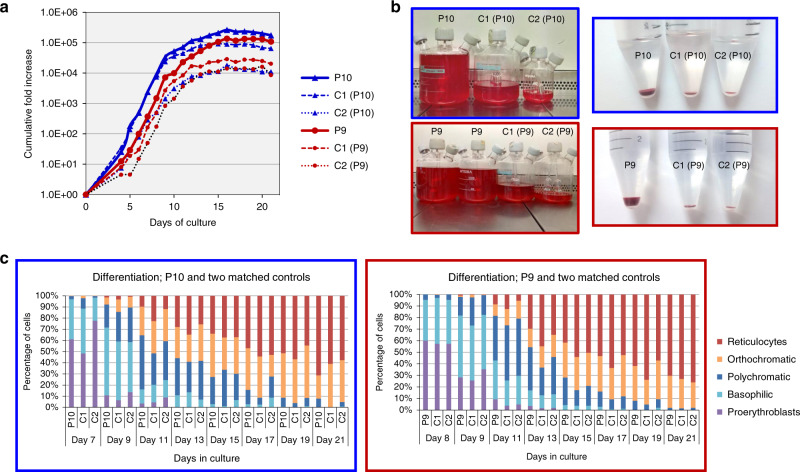
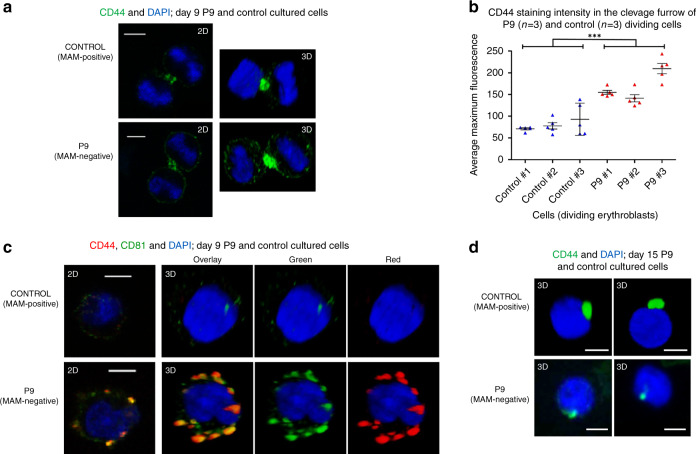
The clinically important MAM blood group antigen is present on haematopoietic cells of all humans except rare MAM-negative individuals. Its molecular basis is unknown. By whole-exome sequencing we identify EMP3, encoding epithelial membrane protein 3 (EMP3), as a candidate gene, then demonstrate inactivating mutations in ten known MAM-negative individuals. We show that EMP3, a purported tumour suppressor in various solid tumours, is expressed in erythroid cells. Disruption of EMP3 by CRISPR/Cas9 gene editing in an immortalised human erythroid cell line (BEL-A2) abolishes MAM expression. We find EMP3 to associate with, and stabilise, CD44 in the plasma membrane. Furthermore, cultured erythroid progenitor cells from MAM-negative individuals show markedly increased proliferation and higher reticulocyte yields, suggesting an important regulatory role for EMP3 in erythropoiesis and control of cell production. Our data establish MAM as a new blood group system and demonstrate an interaction of EMP3 with the cell surface signalling molecule CD44.


Conflict of interest statement

A patent application (PCT Application No. PCT/GB2019/053102) covering ex vivo erythroid cell culture proliferation enhancement due to lack of or disruption of EMP3 has been filed (N.T., C.A.G., L.T., V.K.C. and D.J.A.). The remaining authors declare no competing interests.

Figures

Fig. 1
Fig. 1. DNA sequencing of ten unrelated MAM-negative individuals revealed inactivating mutations in EMP3.
a Exome sequence alignments over the EMP3 gene region demonstrate four inactivating mutations in five MAM-negative individuals. EMP3 was the only candidate gene that passed our filtering strategy with predicted loss of function mutations found in all tested MAM-negative samples. Upper panel (chr19; 48,822,471 to 48,837,471) shows a complete deletion of EMP3 in P9 (blue box) revealed by a lack of coverage over any targeted exons as compared to control, although flanking genes CCDC114 and TMEM143 show sequencing coverage. Lower panel (chr19; 48,828,000 to 48,834,500) shows homozygous nonsense mutation (c.123C > G; p.Tyr41Ter) in P2 (brown line); deletion of EMP3 exon 4 in P8 (pink box) and P5 (data not shown); deletion of EMP3 exon 5 in P4 (orange box). b Sanger sequencing was used to confirm these mutations and identify EMP3 mutations in a further five MAM-negative individuals and deletion breakpoints were identified where appropriate (summarised in Supplementary Table 5). EMP3 inactivating mutations in all patients (P1–P10) are depicted on the gene schematic, with dark blue areas depicting coding exons, light blue areas UTRs and deleted regions depicted by dashed red lines.
Fig. 2
Fig. 2. Disruption of the EMP3 gene in BEL-A2 cell line demonstrated its underlying role in MAM antigen expression.
a Flow cytometry analysis of EMP3KO clone E0.5–6 with anti-MAM (P9 eluate). The CRISPR/Cas9-mediated gene editing system was used to disrupt EMP3 in BEL-A2 immortalised erythroid cell line. A total of eight transgenic BEL-A2 transfectant clones had no detectable MAM on cell surfaces, revealing the EMP3 gene to be responsible for MAM expression. b Sanger sequencing of EMP3 exons 2 and 5 for EMP3KO clone E0.5–6. Sanger sequencing confirmed inactivating deletions in all KO clones, in EMP3 exon 2 and exon 5. In clone E0.5–6, deletions NM_001425.2: c.44_48del in exon 2 and NM_001425.2: c.344_359del in exon 5 were close to the location of guide DNAs and both would have introduced a reading frame shift and aberrant termination of the protein translation (p.Ile15AsnfsTer40 and p.Ala115ValfsTer176, respectively). c Immunofluorescence assay with BEL-A2 EMP3KO clone E0.5–6. Four KO clones were stained with anti-MAM (P9 eluate; shown in red), with duplication, for immunofluorescence assays (magnification ×40) to show a complete loss of MAM on their cell surfaces in all clones. DAPI staining shown in blue. Scale bars are 10 µm. Several KO clones were also stained with commercially available anti-EMP3, as shown in Supplementary Fig. 3.
Fig. 3
Fig. 3. EMP3 transfection causes MAM expression in Daudi cells.
a Flow cytometry analysis showing establishment of MAM expression in Daudi cells. The representative histogram shows IgG (negative control) and MAM reactivity following transfection of Daudi cells with either pEF1α-IRES-ZsGreen1 empty vector (mock), EMP3 wild-type (WT) or EMP3 mutant containing a premature stop codon (c.123 C > G, p.Tyr41Ter). b Overexpression of EMP3 in Daudi cells shown by mean fluorescent intensity from three independent experiments; MAM expression is shown as a ratio between MAM reactivity and isotype control (IgG) reactivity in Daudi cells transfected by either mock, EMP3 WT or EMP3 mutant vectors. **P = 0.0011, ***P = 0.001 (two-tailed unpaired student t test). Error bars represent standard error of the mean (SEM). Source data are provided as a Source Data file. c The histogram shows MAM reactivity following transfection of Daudi cells with either mock, wild-type (WT) or EMP3 mutant compared to unstained cells.
Fig. 4
Fig. 4. Structural calculations and predications on membrane embedded EMP3.
a Homology modelling using PROTTER software. Proposed topology of EMP3 based on homology with claudin-19. I–IV represent transmembrane segments with both termini placed in the cytoplasm. Proposed posttranslational modification sites are indicated. Model similar to previously published EMP family model. b Predicted effects of first extracellular loop interactions with the membrane interface and consequence for apparent membrane thickness. The first extracellular loop was remodelled from initial homology model (based on claudin-19, PDB ID 3 × 29) and embedded in a representative cytoplasmic membrane composed of (mole percentages) 50% phosphatidylcholine/25% cholesterol/15% phosphatidylethanolamine/10% phosphatidylserine (inner leaflet only). All-atom explicit solvent molecular dynamics (MD) calculations (150 ns calculation time) were performed to refine initial homology model. Membrane thickness (phosphate-to-phosphate) is represented as a heat map with relative changes in bilayer dimensions colour-coded (green: average; red: increased; blue: reduced). The polypeptide is represented as a cyan ribbon; gold spheres indicate phosphate atoms of phospholipids. N.B. due to periodicity of the calculation space, the larger blue region at bottom of map lies beneath the large extracellular loop of EMP3 (at top of map extending over the edge). c Tentative model after MD calculations. EMP3 is represented as cyan ribbon cartoon and phospholipids as stick representations. Tryptophan residues in the first extracellular loop are shown (stick representation) to illustrate the high density of tryptophan residues within this loop (frequency of 0.15) as well as assumed intra-molecular disulphide bond (yellow). d as c but with phosphate atoms represented by gold spheres. e Phosphatidylserine molecules stably associated with the transmembrane segment are indicated by stick representation. These were observed to be coordinated by Arg160 (indicated by stick representation) located at the membrane interface near the C-terminus of the protein and remained associated with Arg160 for the majority of the trajectory. f Distribution of cholesterol molecules after MD calculations (stick representation), illustrating the relative accumulation of cholesterol beneath first extracellular loop (blue region in panel B/reduced membrane thickness). View from top of the membrane block. g Close-up of cholesterol accumulation beneath first extracellular loop as shown in (f), viewed from side.
Fig. 5
Fig. 5. CD34+ cells isolated from two MAM-negative whole blood samples, P9 (red) and P10 (blue) and cultured under explicit proliferation conditions following the three-stage protocol described by Griffiths et al. in two ex vivo cell culture experiments showed enhanced erythroid proliferation compared to their respective age and gender-matched controls (C1 and C2).
a Standardised cumulative fold proliferation of erythroid cells in cultures. In each experiment, all samples were maintained at equal cell densities, with passaging carried out as necessary. MAM-negative cultures showed greater expansion compared to the averaged expansion of their respective controls (7.5-fold greater in P9 and 4.62-fold greater in P10 on day 21). Proliferation data from additional cell culture experiments with P9 and P10 supported these findings and are presented in Supplementary Fig. 6. Source data are provided as a Source Data file. b As cell cultures were adjusted to maintain equal cell densities, markedly different final volumes were obtained at the end of the culture. On day 21, enucleation rates of both MAM-negative and control samples were approximately 70%. All samples (total volumes) were filtered using a standardised filtration protocol. Purity of resulting reticulocyte population was >99.2% in all samples. Comparison of packed cell pellets of filtered reticulocytes reflected the greater proliferation capabilities observed in the MAM-negative cultures. c The morphological profiles of the MAM-negative and matched control cells at different stages of erythroid cultures were very similar. No significant differences in the erythroid cell types between MAM-negative and matched controls were observed, with the exception of P9 and P10 reticulocytes (ANOVA repeat measures; P = 0.01), suggesting that the prevalence of each cell type remained constant between the cultures. Therefore, the enhanced MAM-negative cell proliferation was not the result of imbalanced or altered erythroid differentiation. Source data are provided as a Source Data file.
Fig. 6
Fig. 6. Confocal microscope analysis of MAM-negative P9, MAM-positive control erythroblasts and enucleating erythroblasts cultured as described in Supplementary Fig. 6.
Control MAM-positive and P9 MAM-negative erythroblasts were harvested on day 9 and 15, fixed in 1% (wt/vol) paraformaldehyde, permeabilised with 0.05% (wt/vol) saponin and stained for the presence of CD44 and tetraspanin CD81. Nuclei were stained with DAPI (blue). Representative cells shown from approximately 10 micrographs per sampling day. a Dividing erythroblasts were stained with anti-CD44 (green) and shown in 2D and 3D. Scale bars are 5 µm. b Average CD44 staining intensities (n = 5 independent measurements from each dividing cell) of three P9 and three control dividing cells were obtained with Leica LAS AF software. MAM-negative samples showed significantly larger maximum fluorescence in the cleavage furrows than the control samples (two-tailed t test; df = 28, P = 1.14 × 10−8). Data are presented as mean values, with error bars representing standard deviation. Source data are provided as a Source Data file. c Erythroblasts stained with anti-CD44 (red) and anti-CD81 (green). Shown in 2D and 3D. Scale bars are 5 µm. d Representative free nuclei stained with anti-CD44 (green) showing CD44 to be associated with free nuclei after enucleation in the final stages of erythrocyte maturation. Shown in 3D. Scale bars are 5 µm.

References

    1. Storry JR, et al. Homozygosity for a null allele of SMIM1 defines the Vel-negative blood group phenotype. Nat. Genet. 2013;45:537–541. doi: 10.1038/ng.2600. - DOI - PubMed
    1. Helias V, et al. ABCB6 is dispensable for erythropoiesis and specifies the new blood group system Langereis. Nat. Genet. 2012;44:170–173. doi: 10.1038/ng.1069. - DOI - PMC - PubMed
    1. Karamatic Crew V, et al. CD151, the first member of the tetraspanin (TM4) superfamily detected on erythrocytes, is essential for the correct assembly of human basement membranes in kidney and skin. Blood. 2004;104:2217–2223. doi: 10.1182/blood-2004-04-1512. - DOI - PubMed
    1. Anderson G, et al. An antibody to a high frequency antigen found on red cells, platelets, lymphocytes, and monocytes. Transfusion. 1993;33:23S.
    1. Krause G, et al. Structure and function of claudins. Biochim. Biophys. Acta. 2008;1778:631–645. doi: 10.1016/j.bbamem.2007.10.018. - DOI - PubMed

Publication types

MeSH terms