. 2020 Jul 16;11(1):3568.
doi: 10.1038/s41467-020-17341-y.

Dissemination of RasV12-transformed cells requires the mechanosensitive channel Piezo

Affiliations

Dissemination of RasV12-transformed cells requires the mechanosensitive channel Piezo

Jiae Lee et al. Nat Commun. .

Abstract

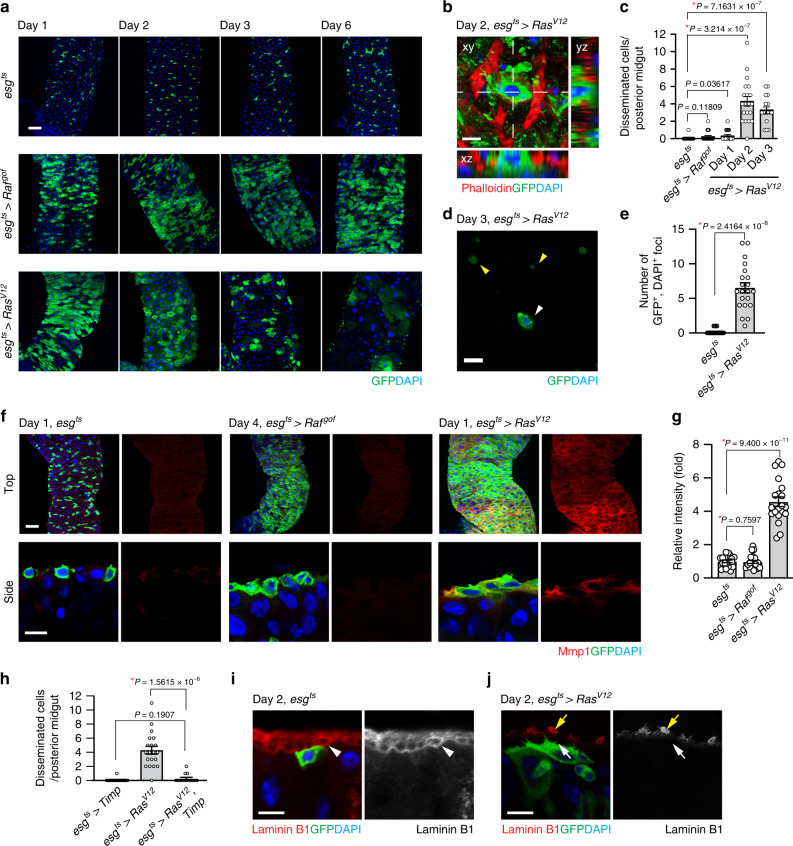
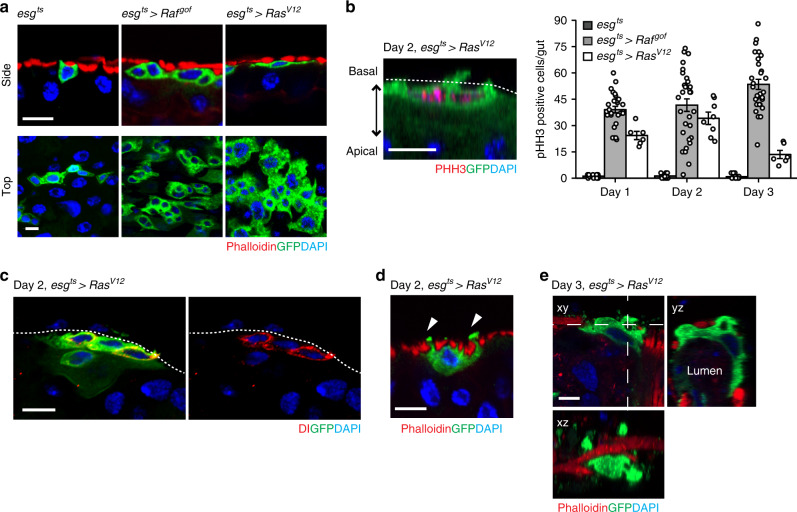
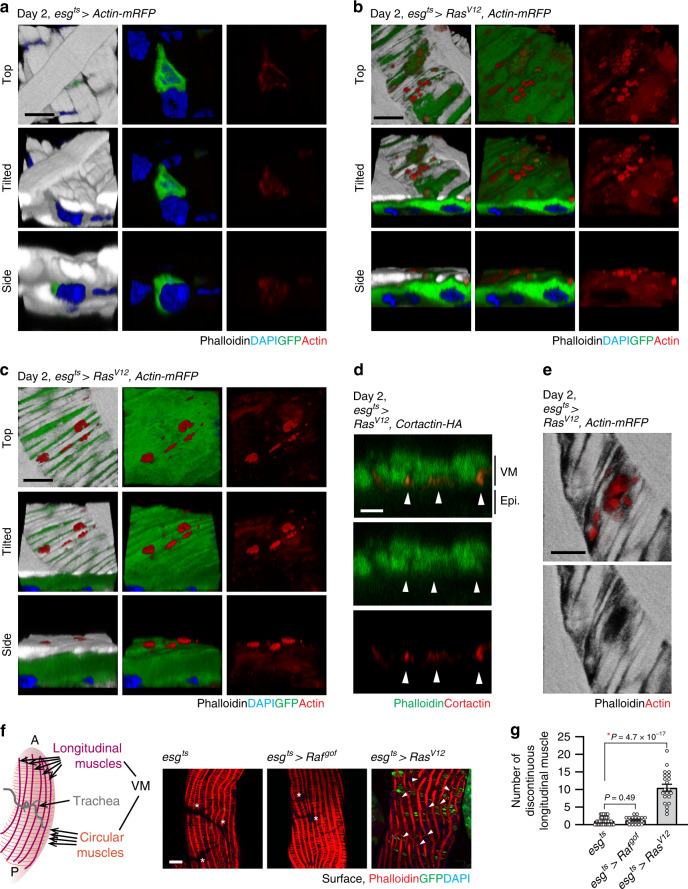
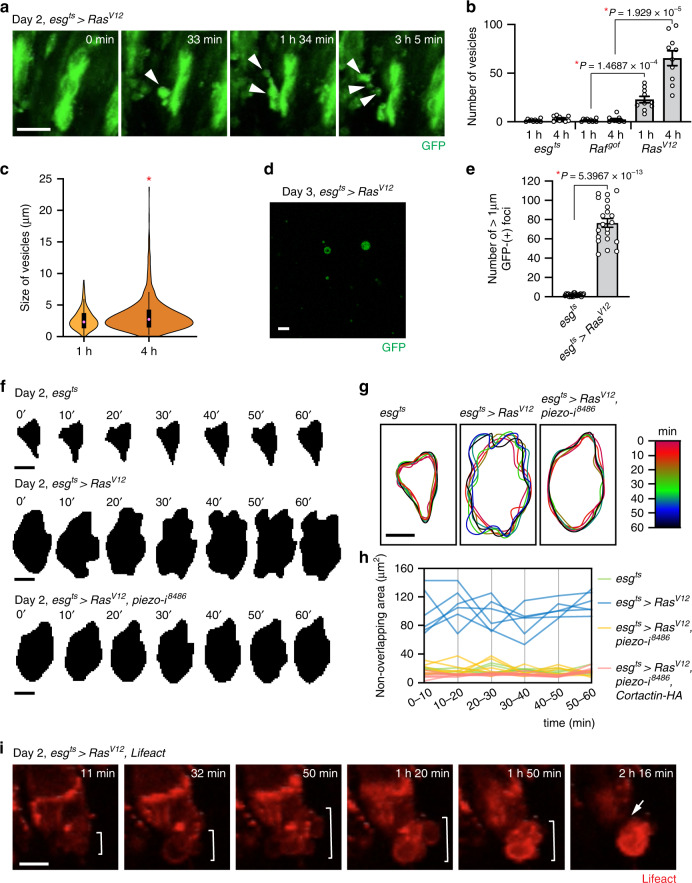
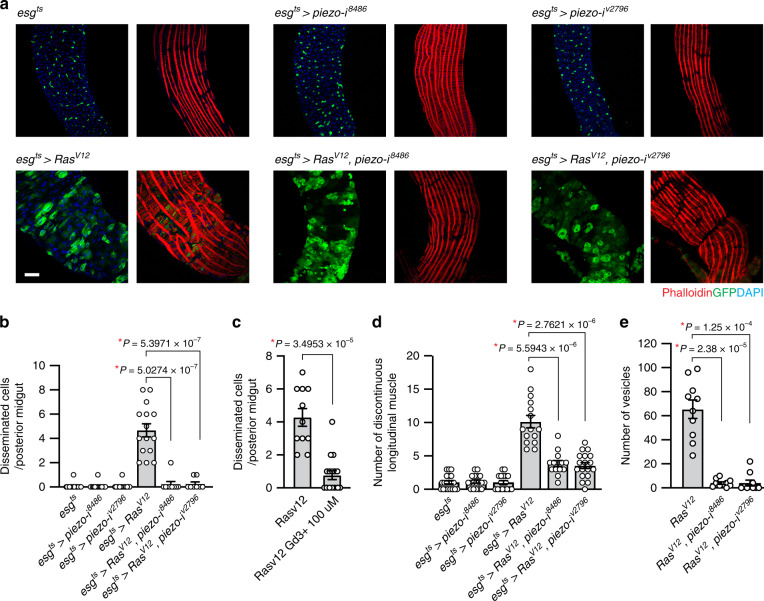
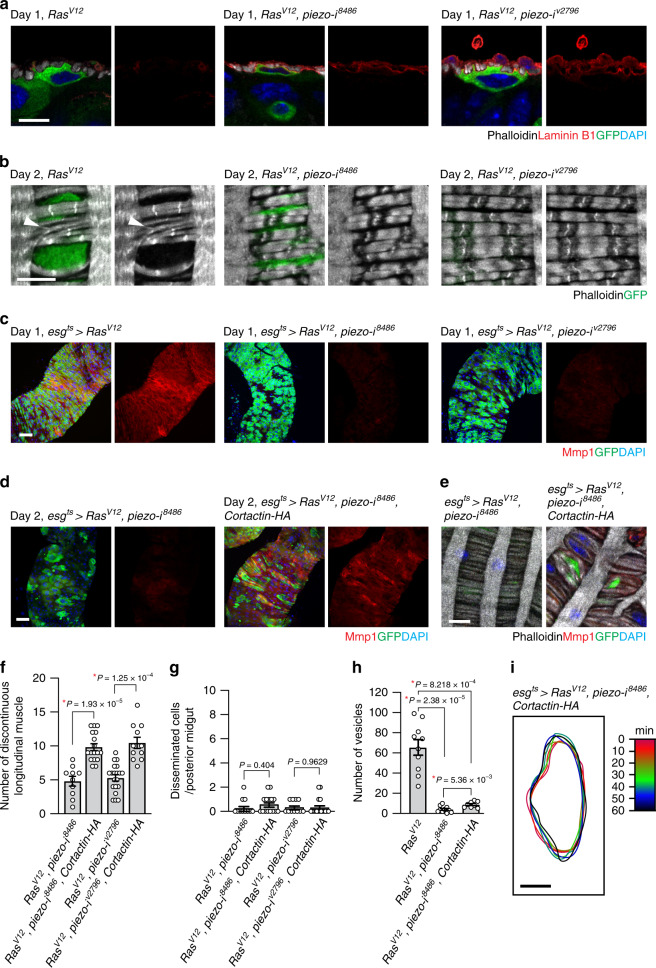
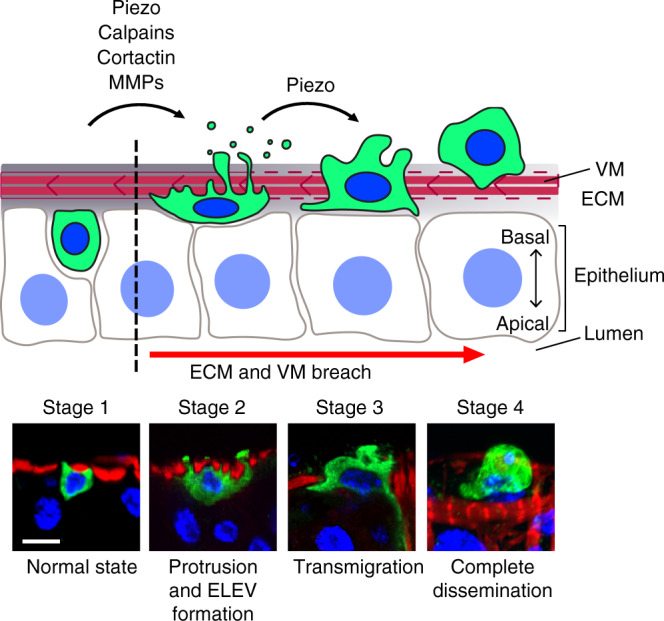
Dissemination of transformed cells is a key process in metastasis. Despite its importance, how transformed cells disseminate from an intact tissue and enter the circulation is poorly understood. Here, we use a fully developed tissue, Drosophila midgut, and describe the morphologically distinct steps and the cellular events occurring over the course of RasV12-transformed cell dissemination. Notably, RasV12-transformed cells formed the Actin- and Cortactin-rich invasive protrusions that were important for breaching the extracellular matrix (ECM) and visceral muscle. Furthermore, we uncovered the essential roles of the mechanosensory channel Piezo in orchestrating dissemination of RasV12-transformed cells. Collectively, our study establishes an in vivo model for studying how transformed cells migrate out from a complex tissue and provides unique insights into the roles of Piezo in invasive cell behavior.


Conflict of interest statement

The authors declare no competing interests.

Figures

Fig. 1
Fig. 1. RasV12 cells basally disseminate from the posterior midgut.
a Images of the posterior midgut. Transgenes were induced with esgts by incubating at 29 °C for indicated durations. The cells manipulated by esgts are marked and stained with GFP (green), and nuclei are stained with DAPI (blue). Scale bar, 50 µm. b Representative image of disseminated cell. Top view (xy) and orthogonal views (yz and xz) are shown. Phalloidin (red) visualizes VM. Scale bar, 10 µm. c Quantification of disseminated cells detected on the surface of posterior midgut. N = 25 (esgts), N = 20 (esgts > Rafgof), N = 21 (day 1, esgts > RasV12), N = 20 (day 2, esgts > RasV12), N = 16 (day 3, esgts > RasV12) biological replicates. d Representative image of GFP+ and DAPI+ cell (white arrowhead) detected in hemolymph. RasV12 was expressed with esgts for 3 days before hemolymph collection. GFP+ and DAPI particles (yellow arrowheads) were also detected. Scale bar, 10 µm. e Quantification of circulating GFP+ and DAPI+ cells. N = 3 independent experiments for each genotype. f Mmp1 immunostaining (red) in posterior midguts. Lower panels show side view of the cells. Scale bars, 50 µm (top) and 10 µm (bottom). g Quantification of Mmp1 levels. N = 20 data points collected from seven biological replicates for each genotype. h Quantification of disseminated cells detected on the surface of posterior midgut. N = 16 (esgts > Timp), N = 20 (esgts > RasV12), N = 14 (esgts > RasV12, Timp) biological replicates. Ij Laminin B1 staining of midguts. esgts and esgts > RasV12 midguts were stained with anti-laminin B1 antibody. White arrowhead in the esgts image points to the inner laminin layer adjacent to the epithelium, white arrow in the esgts > RasV12 images points the boundary of the epithelium where laminin is degraded, and yellow arrow in the esgts > RasV12 images points to a patchy laminin signal outside VM. Scale bar, 10 µm. In the side views, the basal side of epithelia is positioned upward. In (c), (e), (g), and (h), mean ± SEMs are shown with individual data points. Data were analyzed by two-tailed unpaired Student’s t-test. Asterisks indicate statistical significance (*P < 0.01) and P values are indicated in graph.
Fig. 2
Fig. 2. Disseminating RasV12-transformed cells undergo extensive remodeling of cell morphology.
a Representative cell morphologies from side and top view. Transgenes were induced for 1 day. Phalloidin signal visualizes VM (red). Scale bars, 10 µm. b Representative image of pHH3 (red) staining of RasV12 cells and quantification of phospho-histone H3 (pHH3) cells per midgut after 3 days of expression. Prior to staining, RasV12 was expressed for 2 days. Dotted line indicates the epithelial boundary. Scale bars, 10 µm. For quantification, day 1: N = 16 (esgts), N = 27 (esgts > Rafgof), N = 6 (esgts > RasV12); day 2: N = 14 (esgts), N = 31 (esgts > Rafgof), N = 8 (esgts > RasV12); day 3: N = 16 (esgts), N = 29 (esgts > Rafgof), N = 6 (esgts > RasV12) biological replicates. Data are mean ± SEMs. c Delta (Dl) antibody staining. The Notch receptor ligand Dl—a marker of intestinal stem cells—was detected in RasV12 cells. Dotted line indicates the epithelial boundary. RasV12 cells are marked with GFP (green), and nuclei are stained with DAPI (blue). Scale bar, 10 µm. d Side view of RasV12 cell. RasV12 was induced for 2 days with esgts. Arrowheads point to protrusions formed across VM. Scale bar, 10 µm. e Side (xy) and orthogonal (yz and xz) views of RasV12 cell. RasV12 was expressed for 3 days. Scale bar, 10 µm.
Fig. 3
Fig. 3. Basal actin-rich protrusions disrupt visceral muscle integrity.
ac 3D reconstructions of confocal images angled at 0, 45, and 90 degrees for top, tilted, and side views, respectively. Representative images of control cells (a), and RasV12 cells (b, c) are shown. Dissected guts are imaged for actin-mRFP (red), phalloidin (gray), and DAPI (blue). Scale bars, 5 µm. d Orthogonal view of cortactin-rich protrusions and VM layer. Arrowheads indicate cortactin-rich protrusions (red) co-stained with phalloidin (gray). Scale bar, 5 µm. e Surface view of a rupture in the VM layer induced by a cluster of actin-rich protrusions (red). Scale bar, 5 µm. N = 12 (esgts > Actin-mRFP) for (a) and N = 28 (esgts > RasV12, Actin-mRFP) biological replicates for (b), (c), (d), and (e). f Surface views of the posterior midgut. Schematic illustration describes the architecture of the Drosophila VM. VM (red) is visualized with phalloidin. Arrowheads show discontinued longitudinal muscles. The region void of phalloidin signals (asterisks) is where the trachea is present. Longitudinal and circular muscles behind trachea are not captured because they are at different focal planes. g Quantification of longitudinal muscle breaks. Discontinuation of longitudinal muscles in one layer of VM in the area captured with 40× objective (388 µm × 388 µm) was counted. N = 37 (esgts), N = 19 (esgts > Rafgof), N = 21 (day 1, esgts > RasV12) biological replicates. Mean ± SEMs are shown with individual data points. Data were analyzed by two-tailed unpaired Student’s t-test. Asterisks indicate statistical significance (*P < 0.01), and P values are indicated in graph, transgenes were induced with esgts for 2 days at 29 °C. In the side views of (ad), the basal side of epithelia is positioned upward.
Fig. 4
Fig. 4. RasV12 cells generate blebs and ELEVs and disseminate by extensive blebbing.
a Still shots from ex vivo live imaging of esgts > RasV12 midgut. Arrowheads indicate blebs and ELEVs. Scale bar, 10 µm. b, c Quantification of ELEVs generated from dissected midgut. Transgenes were induced for 2 days with esgts. Number and size of ELEVs produced from dissected midgut were measured at 1 and 4 h post incubation in ex vivo live-imaging media. N = 10 biological replicates for each genotype. b Number of ELEVs. c Size of ELEVs. Circles show the medians (1 h, 3.0928 µm; 4 h, 3.6199 µm); box limits indicate the 25th and 75th percentiles; whiskers extend 1.5 times the interquartile range from the 25th and 75th percentiles. d Representative image of circulating ELEVs. Scale bar, 10 µm. e Quantification of GFP+ particles in hemolymph. Green particles bigger than 1 µm were counted. N = 21 from three independent experiments for each genotype. fh Outline tracing of representative cells in esgts, esgts > RasV12, and esgts > RasV12, piezo RNAi8486 midguts. f Time series of cell boundary masks. The representative cells were traced for an hour from ex vivo live-imaging videos. Masks of the cells were generated every 10 min. Scale bars, 10 µm. g Overlay of cell outlines. Time series of the cell silhouettes were color-coded and overlaid. Scale bar, 10 µm. h Deviation of cell boundary. Non-overlapping area of two cell silhouettes acquired at consecutive time points (n′ and n + 10′, n = 0′, 10′, 20′, 30′, 40′, 50′) is measured. N = 6 for each genotype. i Still shots from ex vivo live imaging of esgts > RasV12 midgut. Lifeact is expressed to visualize filamentous actin (red). Brackets indicate blebbing. Arrow points out the detachment of the blebbing cell from the midgut epithelium. Scale bar, 10 µm. In (b, e), mean ± SEMs are shown with individual data points. Data were analyzed by two-tailed unpaired Student’s t-test. Asterisks indicate statistical significance (*P < 0.01), and P values are indicated in graph.
Fig. 5
Fig. 5. The mechanosensory channel Piezo is required for dissemination of RasV12 cells.
a Representative images of posterior midguts. Transgenes were induced for 2 days with esgts. Scale bar, 50 µm. b Quantification of disseminated cells residing on the surface of VM. N = 20 (esgts), N = 15 (esgts > piezo-i8488), N = 14 (esgts > piezo-iv2796), N = 15 (esgts > RasV12), N = 9 (esgts > RasV12, piezo-i8488), N = 8 (esgts > RasV12, piezo-iv2796) biological replicates. c Quantification of disseminated cells detected on the surface of VM. 100 µM GdCl3-supplemented food was fed for 2 days while expressing RasV12 with esgts. N = 11 (esgts > RasV12), N = 17 (esgts > RasV12) biological replicates. d Quantification of discontinuous longitudinal muscles. N = 21 (esgts), N = 18 (esgts > piezo-i8488), N = 18 (esgts > piezo-iv2796), N = 15 (esgts > RasV12), N = 14 (esgts > RasV12, piezo-i8488), N = 18 (esgts > RasV12, piezo-iv2796) biological replicates. e Quantification of vesicles. N = 10 biological replicates for each genotype. In (be), mean ± SEMs are shown with individual data points. Data were analyzed by two-tailed unpaired Student’s t-test, asterisks indicate statistical significance (*P < 0.01), and P values are indicated in graph.
Fig. 6
Fig. 6. Piezo is required for induction of Mmp1 expression and blebbing.
a Laminin B1 immunostaining (red). The basal side of epithelia is positioned upward. GFP and transgenes were induced for 1 day. Scale bar, 10 µm. b Magnified views of VM (gray). Arrowhead indicates torn circular muscles. Transgenes were expressed for 2 days. VM is visualized with phalloidin staining (gray). Scale bar, 10 µm. c, d Mmp1 staining (red) of posterior midguts. Scale bar, 50 µm. e Magnified views of VM (gray). Scale bar, 10 µm. f Quantification of longitudinal muscle break. N = 20 (esgts > RasV12, piezo-i8488), N = 11 (esgts > RasV12, piezo-i8488, Cortactin-HA), N = 10 (esgts > RasV12, piezo-iv2796), N = 17 (esgts > RasV12, piezo-iv2796, Cortactin-HA) biological replicates. g Disseminated cells detected outside VM. N = 11 (esgts > RasV12, piezo-i8488), N = 17 (esgts > RasV12, piezo-i8488, Cortactin-HA), N = 11 (esgts > RasV12, piezo-i v2796), N = 15 (esgts > RasV12, piezo-iv2796, Cortactin-HA) biological replicates. h Quantification of vesicles at 4 h post incubation. The RasV12 and RasV12, piezo-i8486 quantifications were adapted from Fig. 5e for comparison. N = 10 (esgts > RasV12), N = 10 (esgts > RasV12, piezo-i8488), N = 8 (esgts > RasV12, piezo-i8488, Cortactin-HA) biological replicates. i Overlay of cell outlines. A RasV12, piezo RNAi, Cortactin-HA cell in ex vivo live-imaging video was traced for an hour. The cell’s silhouettes obtained every 10 min were overlaid. GFP and other transgenes were induced with esgts for 2 days. Scale bar, 10 µm. In (fh), mean ± SEMs are shown with individual data points. Data were analyzed by two-tailed unpaired Student’s t-test. Asterisks indicate statistical significance (*P < 0.01), and P values are indicated in graph.
Fig. 7
Fig. 7. Schematic stages of cell dissemination.
Stages of cell dissemination were reconstituted based on confocal images of fixed RasV12 cells and ex vivo live imaging of esgts > RasV12 posterior midguts. Lower panels show representative confocal images of control (esgts; stage 1) and RasV12 cells (stages 2–4). An esgts cell is illustrated in stage 1. In the absence of RasV12 expression, ISCs and EBs reside within the midgut epithelia. Upon RasV12 expression, invasive protrusions are formed at the basal side of the cells, and Mmp1 levels increase. Stage 2 illustrates a RasV12 cell producing large protrusions/blebs and ELEVs across the VM. These cells could be observed at days 2 and 3 of RasV12 expression. Stages 3 and 4 illustrate RasV12 cells under and after transmigration, respectively. Disseminated cells were frequently detected at days 2 and 3 of RasV12 expression. Scale bar, 10 µm.

Similar articles

Cited by

References

    1. Gomez-Cuadrado L, Tracey N, Ma R, Qian B, Brunton VG. Mouse models of metastasis: progress and prospects. Dis. Model Mech. 2017;10:1061–1074. - PMC - PubMed
    1. Saxena M, Christofori G. Rebuilding cancer metastasis in the mouse. Mol. Oncol. 2013;7:283–296. - PMC - PubMed
    1. Kang Y, Pantel K. Tumor cell dissemination: emerging biological insights from animal models and cancer patients. Cancer Cell. 2013;23:573–581. - PMC - PubMed
    1. Cai D, Montell DJ. Diverse and dynamic sources and sinks in gradient formation and directed migration. Curr. Opin. Cell Biol. 2014;30:91–98. - PMC - PubMed
    1. Bai J, Uehara Y, Montell DJ. Regulation of invasive cell behavior by taiman, a Drosophila protein related to AIB1, a steroid receptor coactivator amplified in breast cancer. Cell. 2000;103:1047–1058. - PubMed

Publication types

MeSH terms