. 2020 Jul 16;11(1):3559.
doi: 10.1038/s41467-020-17358-3.

Alveolar regeneration through a Krt8+ transitional stem cell state that persists in human lung fibrosis

Affiliations

Alveolar regeneration through a Krt8+ transitional stem cell state that persists in human lung fibrosis

Maximilian Strunz et al. Nat Commun. .

Abstract

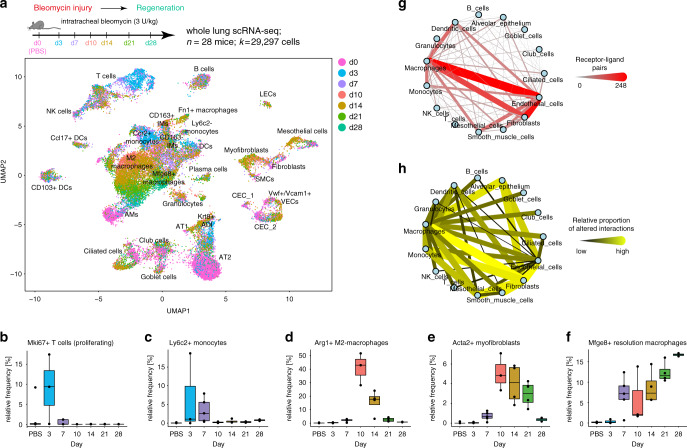
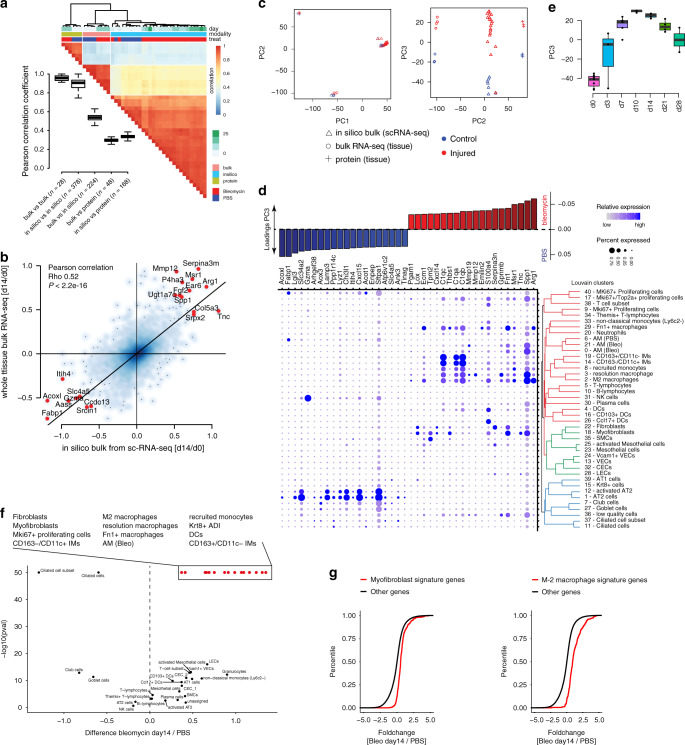
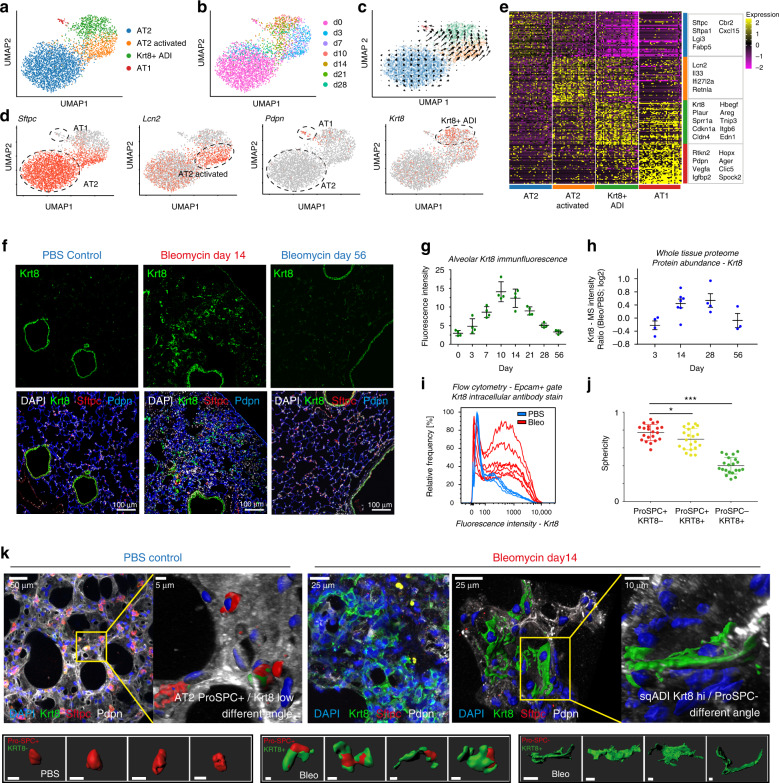
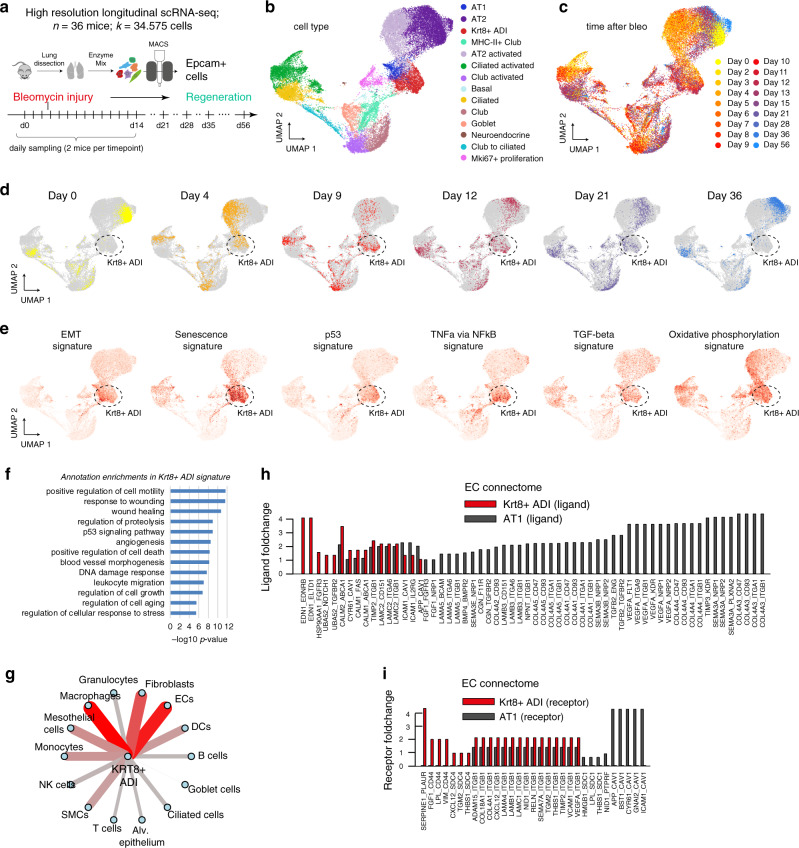
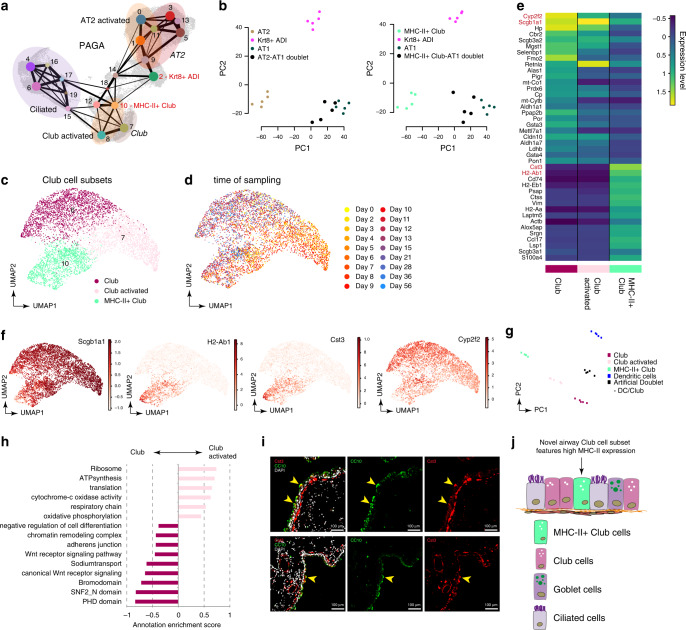
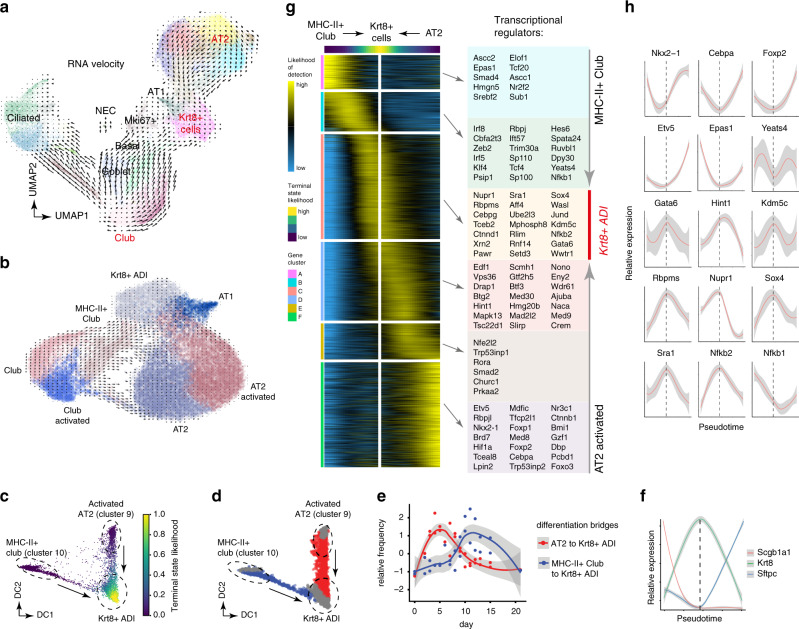
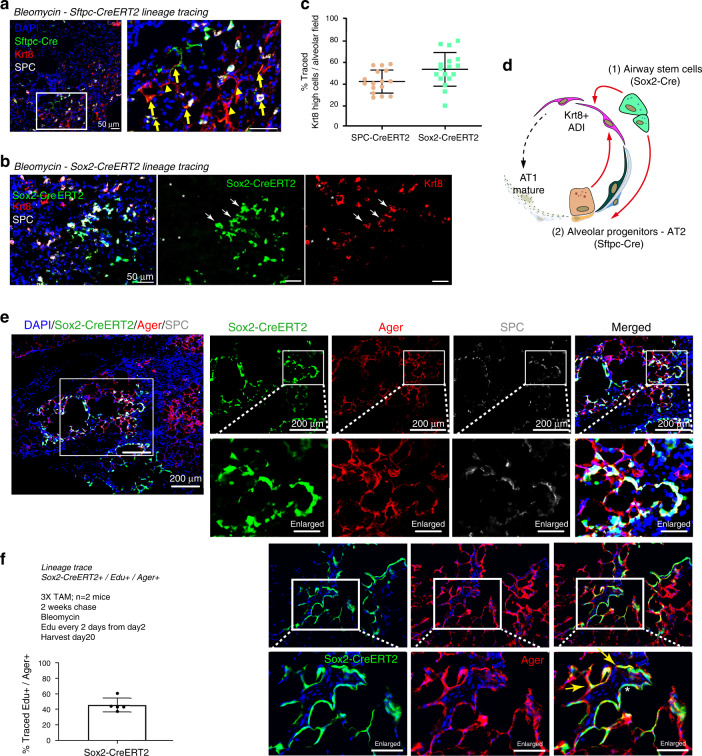
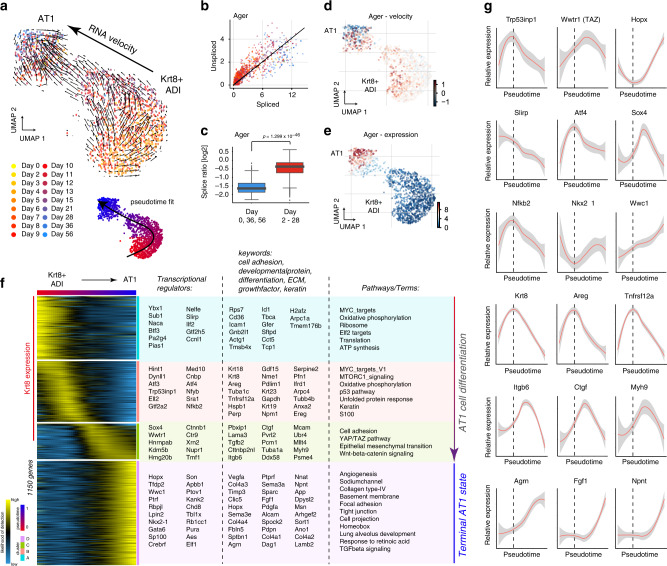
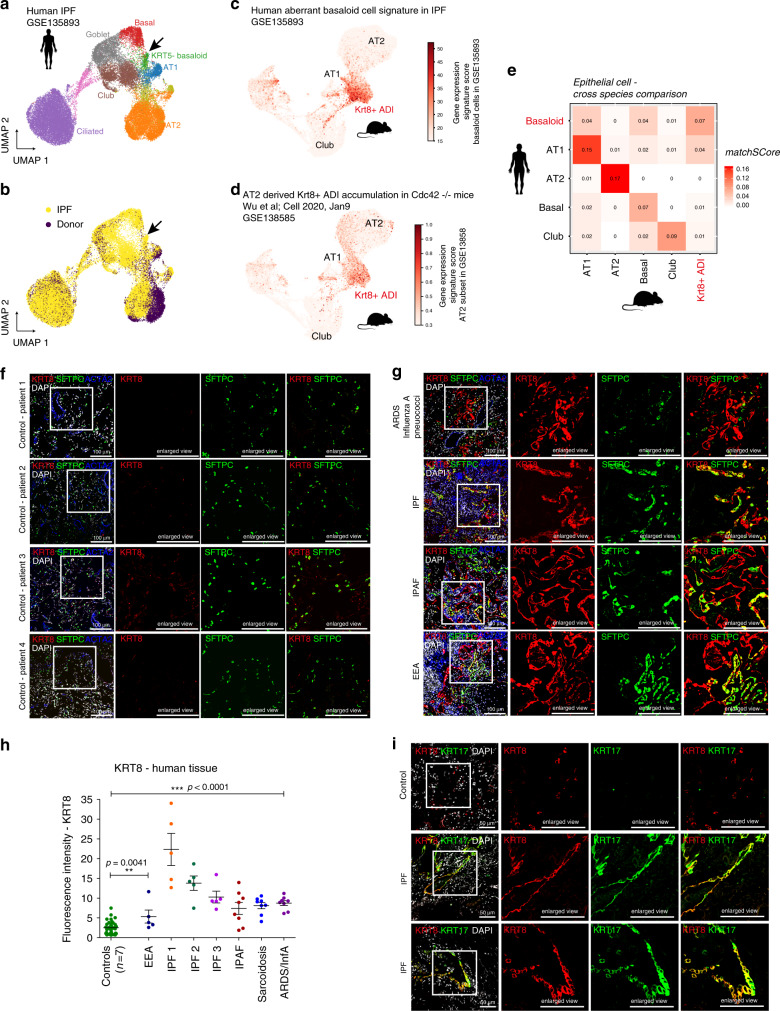
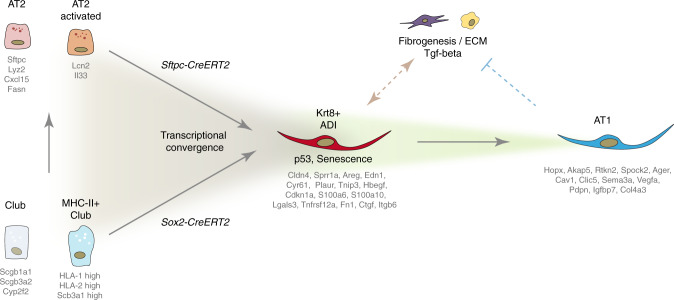
The cell type specific sequences of transcriptional programs during lung regeneration have remained elusive. Using time-series single cell RNA-seq of the bleomycin lung injury model, we resolved transcriptional dynamics for 28 cell types. Trajectory modeling together with lineage tracing revealed that airway and alveolar stem cells converge on a unique Krt8 + transitional stem cell state during alveolar regeneration. These cells have squamous morphology, feature p53 and NFkB activation and display transcriptional features of cellular senescence. The Krt8+ state appears in several independent models of lung injury and persists in human lung fibrosis, creating a distinct cell-cell communication network with mesenchyme and macrophages during repair. We generated a model of gene regulatory programs leading to Krt8+ transitional cells and their terminal differentiation to alveolar type-1 cells. We propose that in lung fibrosis, perturbed molecular checkpoints on the way to terminal differentiation can cause aberrant persistence of regenerative intermediate stem cell states.


Conflict of interest statement

The authors declare no competing interests.

Figures

Fig. 1
Fig. 1. Longitudinal single cell RNA-seq reveals cell state and cell communication dynamics.
a Single cell suspensions from whole-mouse lungs were analyzed using scRNAseq at the indicated time points after bleomycin-mediated lung injury. The color code in the UMAP embedding shows shifts of the indicated cell types in gene expression space during the regeneration time course. bf Relative frequency of the indicated cell types relative to all other cells was calculated for individual mice at the indicated time points after injury (n = 4) and for PBS treated control mice (n = 7). The boxes represent the interquartile range, the horizontal line in the box is the median, and the whiskers represent 1.5 times the interquartile range. g The network shows 15 meta-cell type identities (see Supplementary Fig. 1d) and their putative communication structure. Edge weight and color illustrate the number of receptor-ligand pairs between cell types. h The edges represent the relative proportion of receptor-ligand pairs between cell types with altered expression after injury.
Fig. 2
Fig. 2. Bulk deconvolution reveals cellular source of regulated proteins and cell state frequency changes.
a Pairwise Pearson correlation was calculated across whole lung bulk RNA-seq (bulk, n = 4), in silico bulk scRNA-seq (in silico, Bleo n = 4, PBS n = 7) and proteomics samples (protein, n = 4). Bulk and proteomics data contain samples from day-14 after bleomycin-induced injury and controls. Red and blue colors indicate high and low correlation values, respectively. Columns are ordered by unsupervised hierarchical clustering. Colored bars on top of heatmap indicate time point, data modality and injury status of each sample. Boxplot displays the distribution of Pearson correlation coefficients across comparisons between various data modalities; boxes represent the interquartile range, the horizontal line the median, and the whiskers 1.5 times the interquartile range. b Scatter plot depicts fold changes calculated between day 0 and 14 for the bulk (y-axis) and in silico bulk (x-axis) RNAseq samples. The black line represents the Deming regression line. Top 20 genes with the highest average fold change in both modalities are highlighted. Statistical significance was assessed using Pearson correlation (p < 2.2e−16). c Data from all three modalities was integrated. The first two principal components show clustering by data modality. The third principal component separates bleomycin samples from controls across all three data modalities. Blue and red colors indicate control and bleomycin samples. d Barplot on top depicts genes with the highest loadings for principal component 3. e The box plot shows the time-resolved loading of PC3 peaking at day 10. The boxes represent the interquartile range, the horizontal line in the box is the median, and the whiskers represent 1.5 times the interquartile range (Bleo, n = 4 per timepoint; PBS, n = 7). f Volcano plot illustrates results from the bulk deconvolutions analysis. X axis indicates mean fold change of cell type markers between day 14 and PBS bulk samples. Y axis displays the −log10 p-value derived from a two-sided Kolmogorov-Smirnov test. P-values were limited to a minimum of 1e−50 for visualization purposes. g Empirical cumulative density plots show two exemplary cell types Myofibroblasts (right) and M2 macrophages (left). Red and black lines correspond to the distribution of cell type markers and all other genes, respectively.
Fig. 3
Fig. 3. Alveolar regeneration features a transient squamous cell state marked by Krt8 expression.
ad UMAP embedding of alveolar epithelial cells shows (a) four distinct cell states, and (b) the time points of sampling, and (c) the RNA velocity vectors, indicating AT2 cell differentiation towards the alveolar Krt8+ cell state after bleomycin-mediated injury, and (d) gene expression of the indicated marker genes. e Heatmap of top 50 differentially expressed genes across alveolar cell states, with selected marker genes in boxes. f Fluorescent immunostainings from the indicated conditions show nuclei (DAPI) in white, Krt8 in green, Sftpc (AT2 cells) in red, and Pdpn (AT1 cells) in blue (scale bar 100 microns). g Quantification of Krt8 mean fluorescence intensity in alveolar space (excluding airways; n = 4 per time point, mean with SD). h Protein abundance of Krt8 in total lung homogenates was assessed by mass spectrometry. Individual data points show log2 ratio of Krt8 MS-intensity after bleomycin injury [n(d3) = 4, n(d14) = 7, n(d28) = 4, n(d56) = 3] versus PBS control mice (n = 4). The mean and standard error of the mean is shown. i Krt8 fluorescence intensity quantified by flow cytometry in epithelial cells. PBS control (n = 5, blue color) and day 10 after bleomycin (n = 7, red color) is shown. j Alveolar cell sphericity analysis of 21 cells per condition revealed elongated cell shapes for alveolar Krt8+ cells in IF-stained precision cut lung slices (in k). Sphericity of 1 indicates round, cuboidal cells, 0 indicates flat cells. PBS, n = 2; Bleo, n = 2. One-way ANOVA with Dunnett’s post testing: *p = 0.0376, ***p < 0.0001. k Maximum projections of confocal z-stacks taken from immunostained 300 micron-thick precision cut lung slices (PCLS) are shown for a representative PBS control mouse and a mouse at day 14 after bleomycin injury. Nuclei (DAPI) are colored blue, Krt8 appears in green, Sftpc (AT2 cells) in red, and Pdpn (AT1 cells) in white. Image data representation stems from n = 5 samples. Small images below show examples taken for cell morphometric analysis (in j). All scale bars in small single-cell images represent 15 µm.
Fig. 4
Fig. 4. Krt8+ADI cells feature unique pathway and cell–cell communication activities.
a A high-resolution longitudinal data set was generated by subjecting sorted cells from the epithelial compartment to scRNAseq at the 18 indicated time points. UMAP embedding displays cells colored by (b) cell type identity and (c) time point. d The colored dots on the UMAP illustrate densities and distribution of cells at individual time points after bleomycin injury. Note the time dependent movement of cells within the data manifold. e UMAP embedded visualizations of single cells colored by gene expression signature scores for the indicated pathways (MSigDB Hallmark gene sets). f The indicated terms were significantly enriched in the Krt8+ ADI signature compared to all other epithelial cell states. g The cell–cell communication network displays the number of receptor-ligand pairs between the molecular markers of the Krt8+ ADI state and all other meta cell type identities (Fig. 1). h, i The bar graphs show the average log2 fold change of either (h) receptors or (i) ligands within the endothelial cell (EC) connectome for Krt8+ ADI and AT1 cells.
Fig. 5
Fig. 5. A distinct club cell state shows high connectivity to alveolar cell identities after injury.
a The PAGA graph visualizes potential cell-type transitions and the topology of the data manifold. Nodes represent Louvain clusters and thicker edges indicate stronger connectedness between clusters. b Principal component analysis of artificially generated cluster-specific and doublet in silico bulk samples shows that Krt8+ ADI cells map orthogonal with respect to linear activated AT2 to AT1 (left) and MHC-II + club to AT1 (right) differentiation profiles. In silico bulk samples are colored by cluster as derived from the PAGA map in (a). Artificially generated doublets are colored in black. c, d The plots visualize the UMAP embedding of Club cells colored by Louvain clustering (c) and by time point (d). e The heatmap shows the average expression levels of marker genes across the three club cell clusters. f UMAP embeddings show distinct expression patterns for selected marker genes. g Principal component analysis of artificially generated cluster-specific and doublet in silico bulk samples shows that MHCII + club cells map orthogonal with respect to a linear connection between dendritic and club cells. Dendritic cell samples and artificially generated doublets are colored in blue and black, respectively. h The bar graph shows the annotation enrichment score for selected examples of gene categories with significant enrichment (FDR < 5%) in either activated Club (positive scores) or Club cells (negative scores). i Immunofluorescence staining of mouse airways shows CC10+ club cells (green) and Cst3+ cells (red), DAPI (white). Note the partial overlap of Cst3+/CC10+ airway cells (highlighted by yellow arrowheads). Scale bar = 100 microns; representative images from n = 3 bleo-treated mice. j Revised model of club cell heterogeneity in mouse airways.
Fig. 6
Fig. 6. Transcriptional convergence of MHC-II+;club and AT2 cells onto the alveolar Krt8+ADI cell state.
a Velocity plot displays the UMAP embedding colored by Louvain clusters with velocity information overlaid (arrows). b Velocity plot of a subset of the data only showing alveolar identities and club cell subsets. RNA velocity shows contribution of Scgb1a1+ club cells to both Krt8+ ADI and AT2 identities. c Diffusion map of Louvain clusters 2, 10, and 9 colored by inferred terminal state likelihood reveals two distinct transdifferentiation trajectories from activated AT2 and MHC-II + club cells towards a Krt8+ cell state. d Diffusion map colored by groupings derived from Gaussian Mixed Model Clustering. Red and blue colors represent AT2 and MHC-II + club cell differentiation bridges towards the Krt8+ ADIs. Grey colors represent cells at endpoints. e The lines indicate smoothed relative frequencies across time points of cells within the AT2 (red) and MHC-II + club cell (blue) differentiation bridges. f The lines illustrate smoothed expression levels of Scgb1a1, Krt8, and Sftpc across the trajectory, marking cell identities. The dashed vertical line indicates the peak of Krt8 expression. g The heatmap shows the gene expression patterns along the differentiation trajectory based on the inferred likelihood of detection for 3036 altered genes. h Line plots show the smoothed relative expression levels of selected transcriptional regulators across the converging trajectories. The dashed vertical line indicates the peak of Krt8 expression. For (e), (f), and (h), gray colors represent the 95% confidence interval derived from the smoothing fit.
Fig. 7
Fig. 7. Lineage tracing validates dual origin of Krt8+ADI.
a, b Immunostainings of Krt8 and Sftpc (SPC) in (a) Sftpc-CreERT2-labeled mice (n = 2) and b Sox2-CreERT2-labeled mice (n = 2; lobes analyzed per mouse: n = 3). Arrows indicate lineage positive and stars lineage negative Krt8+ ADI. c Quantification of lineage labeled alveolar cells with high Krt8 expression. Each point in the graph represents a large region (at least 1.2 mm2 area) and cells from at least three lobes/mouse at two different levels (>100 μm apart) were analyzed in 16 fields of view (Sftpc-CreERT2: n cells = 1382; Sox2-CreERT2: n cells = 1833). d Lineage tracing experiments validate the scRNAseq experiments and show convergence of distinct alveolar progenitors into Krt8+ ADI. e Immunostainings of the AT1 marker Ager and the AT2 marker SPC with the Sox2-CreERT2 lineage label at day 14 after bleomycin. Heavily injured regions show only little endogenous SPC+ cells but also Sox2-traced Ager+ and SPC + cells. The experiment was performed on n = 2 mice and n = 3 lobes/mouse were analyzed. Flat lineage labeled cells can be observed Ager+ (yellow arrow) and Ager− (asterisk). f Sox2-CreERT2+/Ager+ AT1 cells that previously proliferated upon bleomycin injury were quantified using the indicated EdU pulse chase labeling strategy. The percentage of EdU chased and lineage labeled AT1 cells is shown. Each dot represents cell counts from at least 2 large regions from two mice, n(mice) = 2; data represented with mean and SD.
Fig. 8
Fig. 8. Terminal differentiation trajectory modeling of Krt8+ADI to AT1.
a Velocity plot displays the UMAP embedding colored by time point with velocity information overlaid (arrows), indicating terminal differentiation of Krt8+ ADI into AT1 cells. b The velocity phase plot shows the number of spliced and unspliced reads of the AT1 marker Ager for each cell (points) on the X and Y axes, respectively. Cells are colored by time point and the black line represents the linear steady-state fit. Cells above and below the diagonal are predicted to be in inductive or repressive states, respectively. c The Boxplot shows the log2 ratio of unspliced over spliced Ager reads for days 0, 36 and 56 (blue, n = 100 cells) and all other time points (red, n = 1193 cells). To avoid division by zero, one was added to both counts. Statistical significance was assessed by using Wilcoxon rank-sum test (two-sided). The boxes represent the interquartile range, the horizontal line in the box is the median, and the whiskers represent 1.5 times the interquartile range. UMAP embedding colored by Ager velocity (d) and expression (e) displays a gradual increase along the inferred trajectory. f The heatmap shows the gene expression patterns across the differentiation trajectory for 1150 altered genes. g The line plots illustrate smoothed expression across the differentiation trajectory for a number of exemplary genes. Gray colors represent the confidence interval derived from the smoothing fit. The dotted line indicates the peak of Krt8 expression.
Fig. 9
Fig. 9. Cells similar to Krt8+ADI persist in a mouse model of progressive lung fibrosis and human disease.
a, b Re-analysis of human lung fibrosis single cell data from GSE135893 for epithelial cells only. The indicated cell type identities (a) and disease status (b) show a relative increase of airway epithelial cell types in lung fibrosis (IPF) and appearance of a disease specific cell state termed aberrant KRT5−/KRT17+ basaloid cell (arrow),,. c, d The indicated human (c) and mouse (d) gene signatures downloaded from the Gene Expression Omnibus were scored on single cells in our mouse epithelial data manifold. Higher scores indicate higher similarity in gene expression to the indicated signatures. e The matchScore matrix shows the degree of similarity of the indicated cell state signatures across species. f FFPE sections from non-fibrotic controls were stained against KRT8 (red), SFTPC (green), and ACTA2 (blue). Scale bar = 100 microns. g Human lung tissue sections were stained as in f, revealing pronounced KRT8 expression at the site of acutely injured lesions (ARDS diagnosis) and fibrotic regions of ILD patient lungs (IPAF, IPF and EAA diagnosis). Scale bar = 100 microns. h Fluorescence intensity of KRT8 stainings was quantified from representative areas of control tissue [n(patients) = 7, n(areas) = 36], EEA tissue [n(patients) = 1, n(areas) = 5], IPF tissue [n(patients) = 3, n(areas per single patient) = 5], IPAF tissue [n(patients) = 1, n(areas) = 8], Sarcoidosis tissue [n(patients) = 1, n(areas) = 8], and ARDS tissue [n(patients) = 1, n(areas) = 8]. One-way ANOVA statistical analysis: ***p < 0.0001, **p = 0.0041. i FFPE sections from non-fibrotic controls or IPF patients were stained against KRT8 (red) and KRT17 (green). Scale bar = 50 microns; representative images from 2x IPF patients and 2x controls.
Fig. 10
Fig. 10. A revised model of alveolar regeneration.
We identify convergence of alveolar and airway stem cells on an injury-induced transitional cell state characterized by a unique transcriptional signature, including high levels of Krt8 expression, that precedes the regeneration of AT1 cells. In this process, stem cells lose cell identity genes, gain specific gene programs including p53 and NFkB target genes, and undergo a drastic change in shape towards a squamous morphology. Krt8+ ADI cells feature a highly distinct connectome of receptor-ligand pairs with endothelial cells, fibroblasts, and macrophages. The Krt8+ ADI cell state persists in models of progressive lung fibrosis and human IPF patients, suggesting that the cell state transitions described in this work are coordinated in space and time by cell intrinsic and tissue niche checkpoints that may be derailed in disease.

Comment in

References

    1. Schiller, H. B. et al. The human lung cell atlas–ahigh-resolution reference map of the human lung in health and disease. Am. J. Respir. Cell Mol. Biol. 10.1165/rcmb.2018-0416TR (2019) - PMC - PubMed
    1. Hogan BLM, et al. Repair and regeneration of the respiratory system: complexity, plasticity, and mechanisms of lung stem cell function. Cell Stem Cell. 2014;15:123–138. - PMC - PubMed
    1. Logan CY, Desai TJ. Keeping it together: pulmonary alveoli are maintained by a hierarchy of cellular programs. Bioessays. 2015;37:1028–1037. - PMC - PubMed
    1. Herriges M, Morrisey EE. Lung development: orchestrating the generation and regeneration of a complex organ. Development. 2014;141:502–513. - PMC - PubMed
    1. Lodyga, M. et al. Cadherin-11-mediated adhesion of macrophages to myofibroblasts establishes a profibrotic niche of active TGF-β. Sci. Signal. 12, eaao3469 (2019). - PubMed

Publication types

MeSH terms