. 2020 Jul 16;11(1):3556.
doi: 10.1038/s41467-020-17347-6.

Machine learning of serum metabolic patterns encodes early-stage lung adenocarcinoma

Affiliations

Machine learning of serum metabolic patterns encodes early-stage lung adenocarcinoma

Lin Huang et al. Nat Commun. .

Abstract

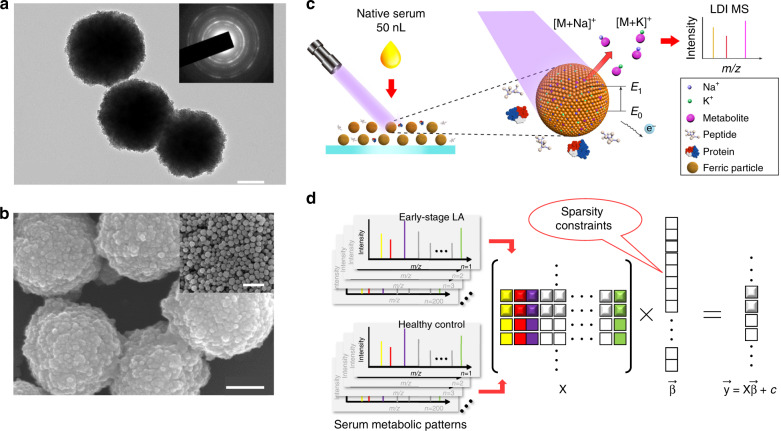
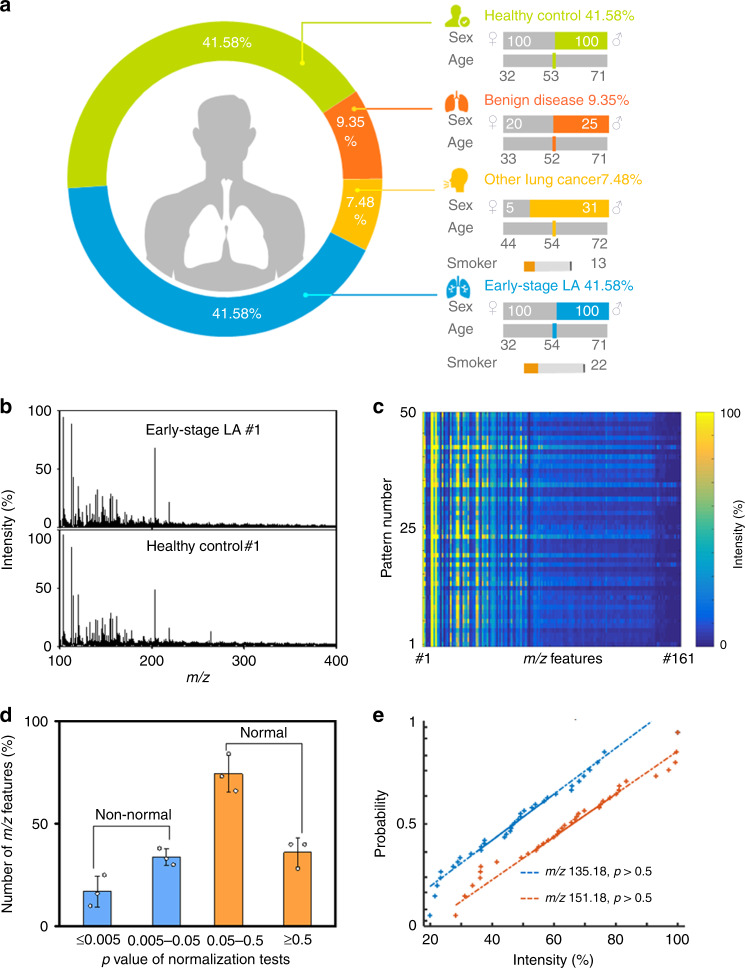
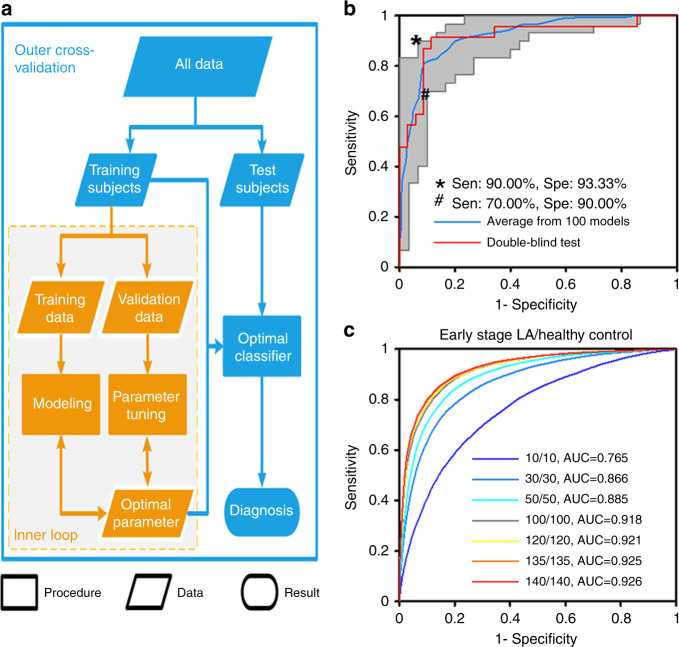
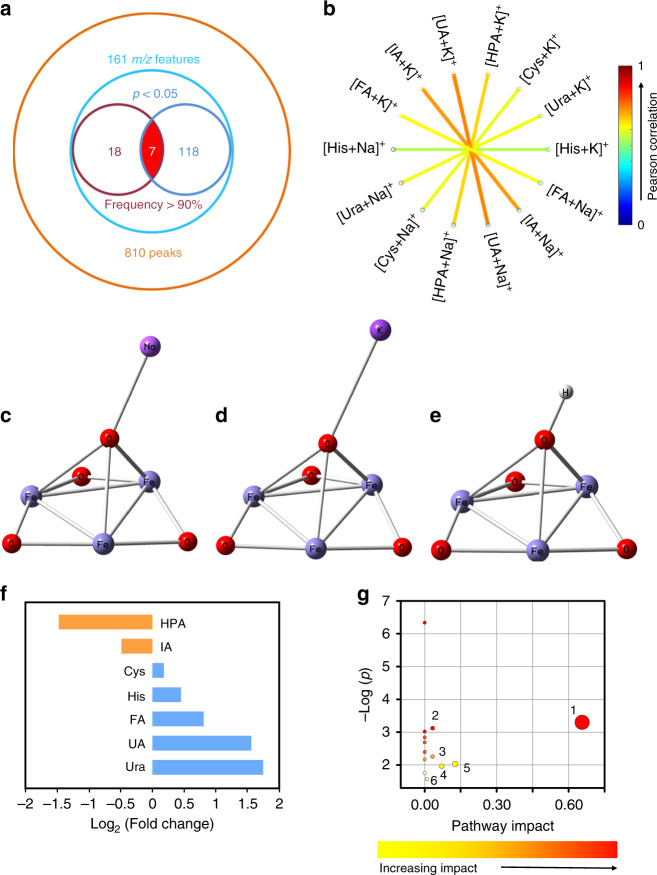
Early cancer detection greatly increases the chances for successful treatment, but available diagnostics for some tumours, including lung adenocarcinoma (LA), are limited. An ideal early-stage diagnosis of LA for large-scale clinical use must address quick detection, low invasiveness, and high performance. Here, we conduct machine learning of serum metabolic patterns to detect early-stage LA. We extract direct metabolic patterns by the optimized ferric particle-assisted laser desorption/ionization mass spectrometry within 1 s using only 50 nL of serum. We define a metabolic range of 100-400 Da with 143 m/z features. We diagnose early-stage LA with sensitivity~70-90% and specificity~90-93% through the sparse regression machine learning of patterns. We identify a biomarker panel of seven metabolites and relevant pathways to distinguish early-stage LA from controls (p < 0.05). Our approach advances the design of metabolic analysis for early cancer detection and holds promise as an efficient test for low-cost rollout to clinics.


Conflict of interest statement

The authors declare the following competing interests. The authors have filed patents for both the technology and the use of the technology to detect bio-samples.

Figures

Fig. 1
Fig. 1. Substrate material characteristics and schematics of extraction and machine-learning workflow.
a Transmission electron microscopy (TEM) image of ferric particles (n ≥ 3 randomly selected) and selected area electron diffraction (SAED) pattern (inset) showing polycrystalline structure. Scale bar = 100 nm. b Scanning electron microscopy (SEM) images (n ≥ 3 randomly selected) of ferric particles showing nanoscale surface roughness and large-scale uniformity (inset). Scale bars = 100 nm in b and 1 μm in the inset of b. c Schematic workflow for the extraction of serum metabolic patterns by ferric particle-assisted laser desorption/ionization mass spectrometry (LDI MS). Fifty nanolitres of native serum was consumed for direct analysis without pre-treatment procedures. Only Na+-adducted and K+-adducted metabolites can be selectively detected with the coexistence of high concentration of peptides and proteins. d Schematic outline for the sparse regression machine learning of serum metabolic patterns (X). The sparse regression method was used to build calculation models with sparsely constrained β¯ towards the diagnosis of early-stage LA (y). Each square and its colour in X corresponded to one m/z feature and its signal intensity in serum metabolic patterns.
Fig. 2
Fig. 2. Extraction of serum metabolic patterns.
a Demographics of 481 clinical samples. The ages of different cohorts were matched with no significant difference (p > 0.05). b Typical mass spectra (serum metabolic patterns) showing with m/z ranging from 100 to 400 obtained by optimized ferric particle-assisted LDI MS of serum samples from an early-stage LA patient and a healthy control. c Heat map of 50 independent metabolic patterns for one early-stage LA serum sample based on 161 m/z features from the Otsu algorithm. d The p value distribution of m/z features from normalization tests of three healthy control serum samples in parallel (50 patterns for each sample). The error bars were calculated as s.d. of three samples. Data were shown as the mean ± s.d. (n = 3). The m/z features with p > 0.05 and p < 0.05 represent normal and non-normal distributions, respectively (two-sided Lilliefors (Kolmogorov–Smirnov) test with no adjustment made for multiple comparisons). e Probability of a normal distribution of m/z features at 135.18 (blue) and 151.18 (orange) for 50 patterns of one serum sample from healthy control, both with p > 0.5 (n = 50 independent experiments, two-sided Lilliefors (Kolmogorov–Smirnov) test with no adjustment made for multiple comparisons). Dotted lines are the reference lines for normal distribution. Source data are provided as a Source Data file.
Fig. 3
Fig. 3. Diagnosis of early-stage LA by machine learning.
a Schematic workflow for the construction of classification models, including an inner loop (machine-learning stage, orange) to tune the hyperparameters for the optimal classifier and outer cross-validation (classifier building stage, blue) to evaluate the discriminant performance. b Receiver operating characteristic (ROC) curves for the classifier designed to distinguish between early-stage LA patients and healthy controls. The colours of ROC curves—blue represented the ROC curve obtained by averaging 20 rounds of five-fold nested cross-validations (100 models in total) with a mean AUC of 0.921 (95% confidence interval (CI): 0.891–0.953), and the optimized number of training subjects was 240 (120/120, LA/control); red represented the ROC curve obtained from double-blind test (23/35, LA/control), showed AUC of 0.915 with diagnostic sensitivity of 88.57% and specificity of 91.30%; the grey area indicated the specificity/sensitivity of all independent ROC curves from 100 models, showing the diagnostic performance of the best (asterisk) and worst (hash mark) classifiers. c Averaged ROC curves with AUC to optimize the number of training subjects, analyzing from 20 (10/10, LA/control) to 280 (140/140, LA/control). Source data are provided as a Source Data file.
Fig. 4
Fig. 4. Construction of metabolic biomarker panel.
a Venn diagram of 161 m/z features from 810 metabolite peaks in serum, seven of which were selected as potential biomarkers with both model selection frequency >90% and p < 0.05 (<400 Da). b Correlation network plot elucidating strong Pearson correlation (>0.5) between Na+-adducted and K+-adducted signals (along diagonal line) for all seven selected metabolites in serum. Binding affinity of cations on the exposed surface [1,1,1] of ferric particles. Density functional theory (DFT) calculation results of c [ferric particles+Na+], d [ferric particles+K+], and e [ferric particles+H+] system with an anionic cluster model in the minimum-energy structure. f Fold change of five up-regulated metabolites (blue) and two down-regulated metabolites (orange) in early-stage LA patients compared with healthy controls. g Potential pathways differentially regulated in early-stage LA patients and healthy controls. The seven selected metabolites were tested to identify altered pathways. The colour and size of each circle were correlated to the p value and pathway impact value. A total of six pathways were differentially regulated: (1) fatty acid metabolism, (2) sulfur metabolism, (3) histidine metabolism, (4) cysteine and methionine metabolism, (5) pyrimidine metabolism, and (6) purine metabolism. Pathways with impact values >0 were considered to be differentially altered between early-stage LA patients and healthy controls. Source data are provided as a Source Data file.

References

    1. Reck M, Rabe KF. Precision diagnosis and treatment for advanced non-small-cell lung cancer. N. Engl. J. Med. 2017;377:849–861. - PubMed
    1. Zhang M, et al. Bright quantum dots emitting at similar to 1,600 nm in the NIR-IIb window for deep tissue fluorescence imaging. Proc. Natl Acad. Sci. USA. 2018;115:6590–6595. - PMC - PubMed
    1. Lim CT. Future of health diagnostics. View. 2020;1:e3.
    1. Cohen JD, et al. Detection and localization of surgically resectable cancers with a multi-analyte blood test. Science. 2018;359:926–930. - PMC - PubMed
    1. Henschke CI, et al. Survival of patients with stage I lung cancer detected on CT screening. N. Engl. J. Med. 2006;355:1763–1771. - PubMed

Publication types

MeSH terms

Substances