. 2020 Jul 16;10(1):11788.
doi: 10.1038/s41598-020-68585-z.

The anti-glioblastoma effect of cold atmospheric plasma treatment: physical pathway v.s. chemical pathway

Affiliations

The anti-glioblastoma effect of cold atmospheric plasma treatment: physical pathway v.s. chemical pathway

Dayun Yan et al. Sci Rep. .

Abstract

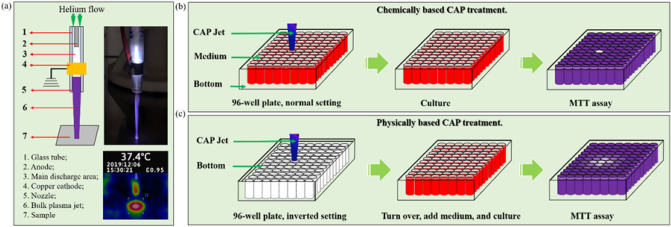
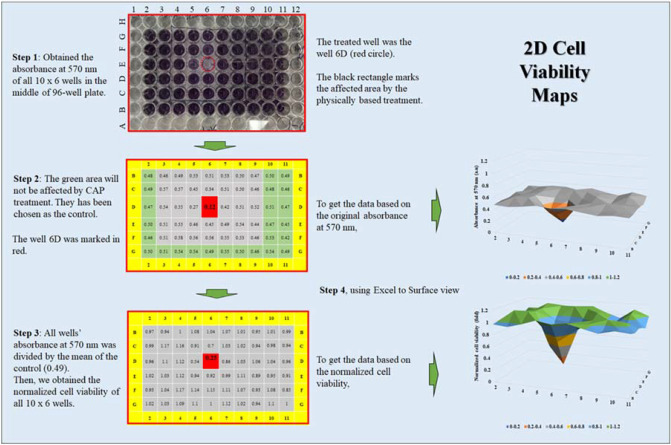
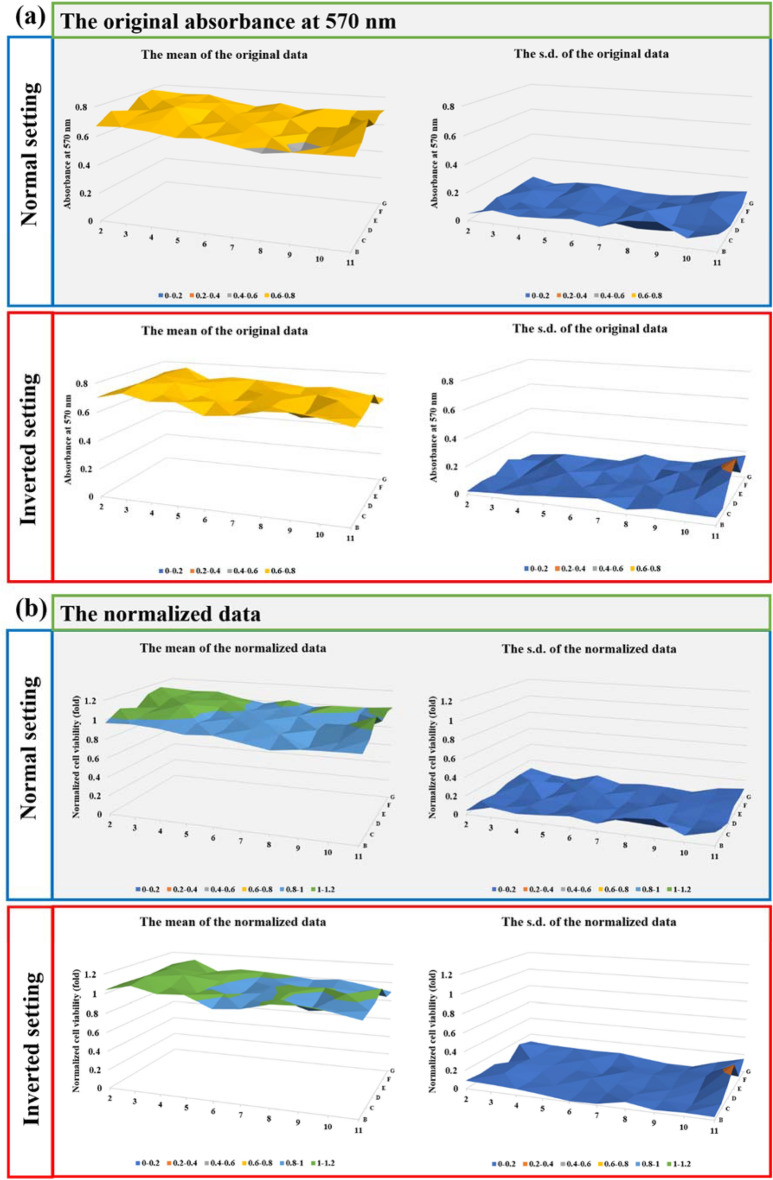
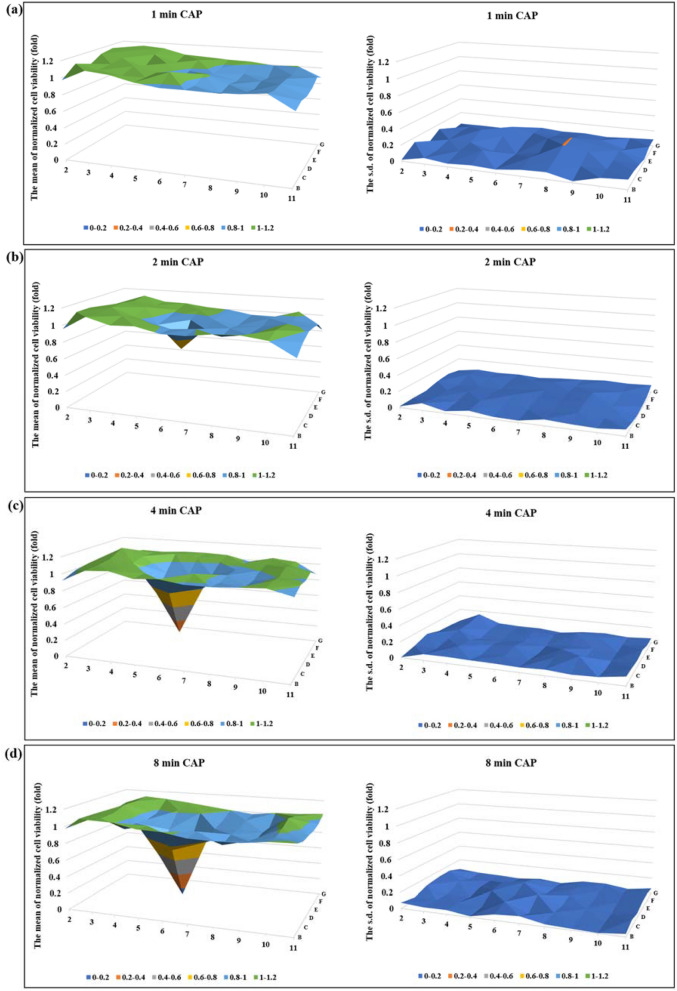
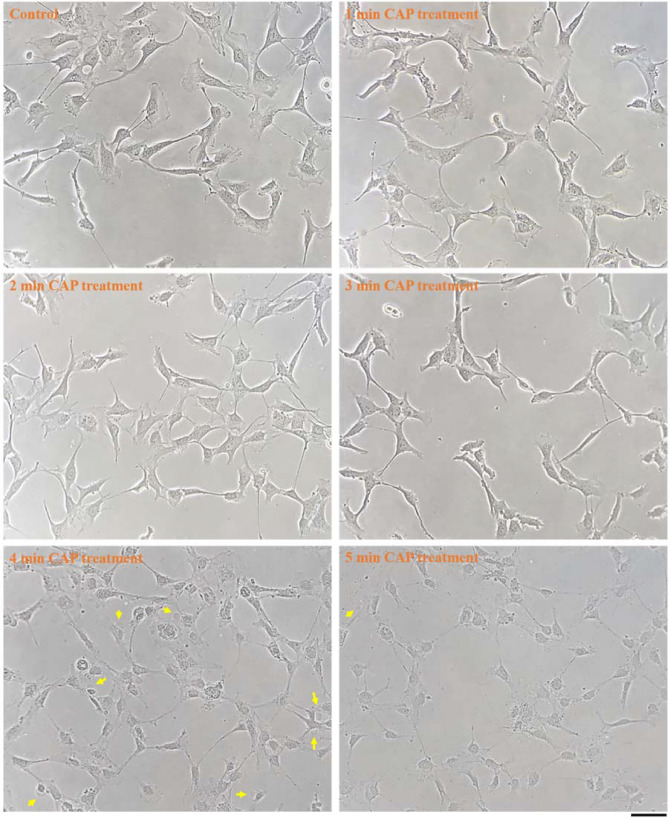
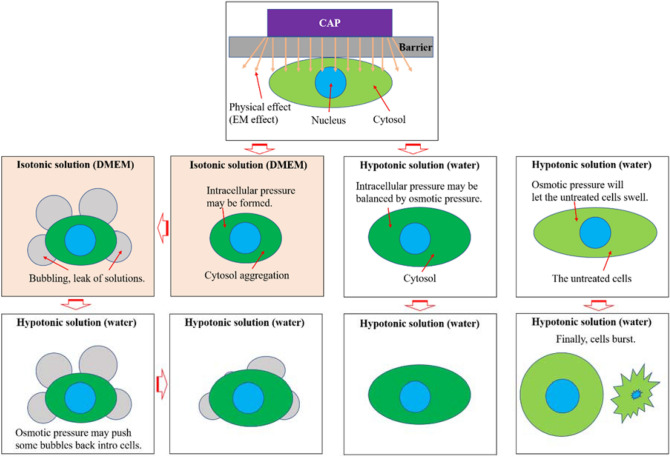
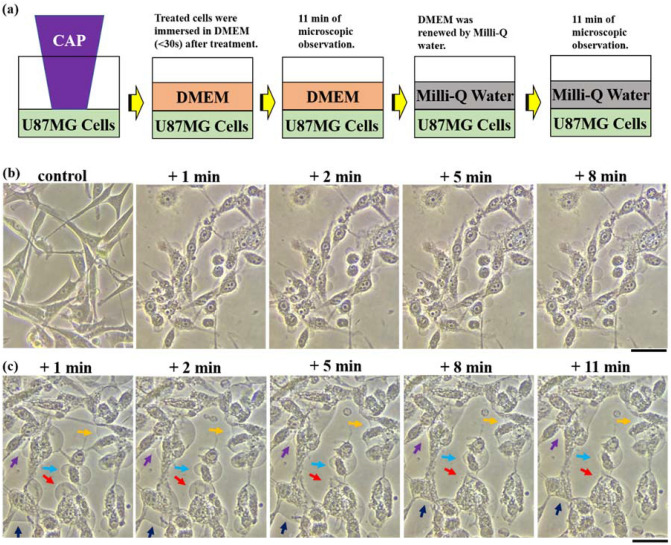
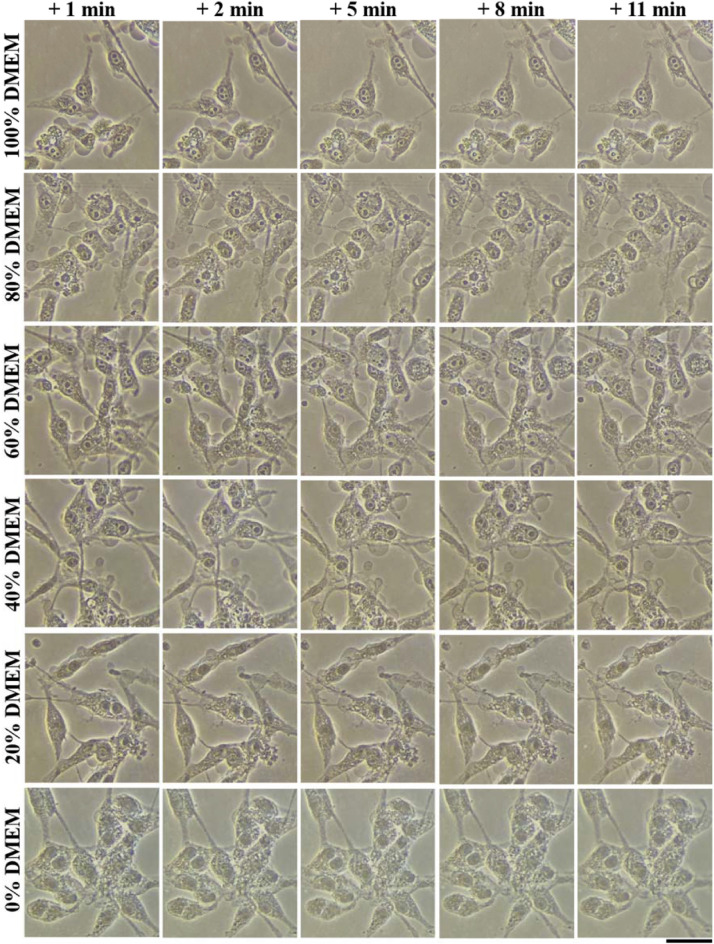
Cold atmospheric plasma (CAP), a near room temperature ionized gas, has shown potential application in many branches of medicine, particularly in cancer treatment. In previous studies, the biological effect of CAP on cancer cells and other mammalian cells has been based solely on the chemical factors in CAP, particularly the reactive species. Therefore, plasma medicine has been regarded as a reactive species-based medicine, and the physical factors in CAP such as the thermal effect, ultraviolet irradiation, and electromagnetic effect have been regarded as ignorable factors. In this study, we investigated the effect of a physical CAP treatment on glioblastoma cells. For the first time, we demonstrated that the physical factors in CAP could reinstate the positive selectivity on CAP-treated astrocytes. The positive selectivity was a result of necrosis, a new cell death in glioblastoma cells characterized by the leak of bulk water from the cell membrane. The physically-based CAP treatment overcomed a large limitation of the traditional chemically based CAP treatment, which had complete dependence on the sensitivity of cells to reactive species. The physically-based CAP treatment is a potential non-invasive anti-tumor tool, which may have wide application for tumors located in deeper tissues.


Conflict of interest statement

The authors declare no competing interests.

Figures

Figure 1
Figure 1
CAP jet and CAP treatment. (a) The CAP schematic illustration and photo of CAP jet. The discharge occurred between a coaxial stainless anode and another copper ring grounded cathode. Helium as the carrying gas take the ionized gas out the nozzle with a flow rate around 1.5 lpm. The diameter of the glass nozzle was 4.5 mm. An infrared photo (FLUKE Visual IR Thermometer) was shown in bottom panel. In the infrared photo, the CAP jet treated the bottom of a 35-mm dish. The temperature reflected the temperature of the dish’s center. (b) The schematic illustration of the chemically based CAP treatment. (c) The schematic illustration of the physically based CAP treatment. The cases of 12-well plates did not show at here.
Figure 2
Figure 2
The protocols to make a 2D cell viability assay map based on a 96-well plate. The photo of a 96-well plate after the MTT assay was used here as an example. To get the map reflecting the original absorbance at 570 nm, the original data were used. To obtain the map reflecting the normalized data, the original data would be divided by the mean value of the control group. The data used to draw the 2D maps was the mean of the repeated tests. Each well’s data were based on the mean value of the corresponding well’s data in different repeats. The standard deviation (s.d.) of each well was also obtained, if needed, they could be shown in 2D maps based on s.d.
Figure 3
Figure 3
Just the inverted setting of the 96-well plate did not affect the cell growth (U87MG). (a) The original data based on the absorbance at 570 nm. (b) The normalized data. These 2D cell viability maps tend to show the cell viability after the normal setting and the inverted setting of 20 min. During the inverted setting, the bulk medium was moved away. Both the 2D maps based on the mean value of the repeated experiments and the 2D maps based on the s.d. of the repeated experiments were shown here. Results are presented as the mean ± s.d. of the experiments repeated 2 times.
Figure 4
Figure 4
The physically-based CAP treatment effectively inhibited the growth of glioblastoma cells. The CAP treatment was performed for 1 min (a), 2 min (b), 4 min (c), and 8 min (d). The treatment was performed on the bottom of the 96-well plate, targeting the well 6D. For each case, 100 μL/well of U87MG (12 × 104 cell/mL) were seeded in 96-well plate and cultured for 7 h before the treatment. The cells were cultured for 3 days before the final MTT assay. The normalized cell viability was obtained by using the protocols shown in Fig. 2. In each case, the mean value and the s.d. of the normalized cell viability were presented in the left panel and the right panel, respectively. Results were presented as the mean ± s.d. of the experiments repeated for 4 times. The original data were shown in Supplementary Fig. S2.
Figure 5
Figure 5
The negative and positive selectivity in both CAP treatment strategies. (a) The chemically-based CAP treatment. (b) The physically-based CAP treatment. For each case, 1 mL/well of U87MG or hTERT/E6/E7 cells (5 × 104 cell/mL) were seeded in 12-well plates and cultured for 7 h before the treatment. The cells were cultured for 3 days before the final MTT assay. The normalized cell viability was obtained by the division between the experimental group and the control group. Results were presented as the mean ± s.d. of the experiments repeated 3 times. Student’s t-test was performed, and the significance was indicated as *p < 0.05, **p < 0.01, ***p < 0.005.
Figure 6
Figure 6
The morphological change of U87MG cells after the physically-based CAP treatment. For the control group, the medium was also renewed. No CAP treatment was performed before imaging. All photos were taken at 11 min after the treatment. The clear bubbles on the cellular membrane and the clear detached bubbles in the extracellular space were marked by blue arrows and red arrows, respectively. 1.5 mL of U87MG cells (7.5 × 104 cell/mL) were seeded in 35 mm dishes and cultured for 24 h in the incubator. The scale bar was 100 μm (black). All photos were taken by using a Nikon TS100 inverted phase-contrast microscope.
Figure 7
Figure 7
The typical photos of the bubbles on the CAP-treated U87MG cells. Here, we showed four photos of the typical bubbling. A schematic illustration of the bubbling on the cell is shown in the middle. The photos were taken at 11 min post a 4 min of CAP treatment. The clear bubbles were marked by yellow arrows. 1.5 mL of U87MG cells (7.5 × 104 cell/mL) were seeded in 35 mm dishes and cultured for 24 h in the incubator. The scale bar was 50 μm (black). In each row, the photos were taken in situ. All photos were taken by using a Nikon TS100 inverted phase-contrast microscope.
Figure 8
Figure 8
The growth of bubbles on the CAP-treated U87MG cells. Two cases were shown here. The photos were taken after 4 min of CAP treatment. The arrow with a specific color marked a specific bubble on the cytoplasm membrane. 1.5 mL of U87MG cells (7.5 × 104 cell/mL) were seeded in 35 mm dishes and cultured for 24 h in the incubator. ‘ + x min’ meant the photo was taken at x min after the CAP treatment. The scale bar was 50 μm (black). In each row, the photos were taken in situ. All photos were taken by using a Nikon TS100 inverted phase-contrast microscope.
Figure 9
Figure 9
The morphological change of the physically-based CAP-treated hTERT/E6/E7 cells. For the control group, the medium was also renewed. No CAP treatment was performed before imaging. The photos were taken at 11 min after the CAP treatment. The clear bubbles on the cellular membrane were marked by yellow arrows. 2 mL of hTERT/E6/E7 cells (3 × 104 cell/mL) were seeded in 35 mm dishes and cultured for 48 h in the incubator. The scale bar was 100 μm (black). All photos were taken by using a Nikon TS100 inverted phase-contrast microscope.
Figure 10
Figure 10
A schematic illustration for the role of osmotic pressure on the bubbling.
Figure 11
Figure 11
Some bubbles can be pressed back into U87MG cells in Milli-Q water. (a) A schematic illustration of the protocols. (b) The growth of bubbles in DMEM after the CAP treatment. (c) The cellular response when the cells with bubbles were immersed in Milli-Q water. 6 mL cell solution was cultured in a 60 mm dish with a density of 7.5 × 104 cells/mL for one day before the treatment. For the control group, the medium was also renewed. No CAP treatment was performed before imaging. The bubbling on U87MG cells was first generated after a direct 2 min of CAP treatment. 8 min of the bubbling process was further recorded when the cells were immersed in DMEM. Afterward, DMEM was quickly (< 1 min) removed and renewed by 6 mL of Milli-Q water. The change of bubbles was recorded following this step. ‘ + x min’ means the photo was taken x min after the treatment or after cells were immersed in Milli-Q water. In the second row, specific bubbles were marked by specific colors. The scale bar was 50 μm (black). In each row, the photos after the treatment were taken in situ. All photos were taken by using a Nikon TS100 inverted phase-contrast microscope.
Figure 12
Figure 12
The hypotonic solutions inhibited the bubbling on the U87MG cells after the direct CAP treatment without the coverage of medium. 6 mL cell solution was cultured in a 60 mm dish with a density of 7.5 × 104 cells/mL for 1 day before the treatment. In each case, the CAP treatment lasted 2 min. After that, the cells were immediately (< 30 s) immersed in 6 mL of DMEM/Milli-Q water mixed solutions. The volume ratio % (v/v) of DMEM in the solutions varied from 100 to 0%. The 0% (v/v) DMEM was 100% (v/v) Milli-Q water, a deionized water. ‘ + x min’ means the photo was taken at x min after the CAP treatment. The scale bar was 50 μm (black). In each row, the photos were taken in situ. All photos were taken by using a Nikon TS100 inverted phase-contrast microscope.
Figure 13
Figure 13
The physical anti-glioblastoma effects can be blocked by a copper sheet with an adequately large size. (a) Physically-based CAP treatment. (b) A heat-reflective sheet above the bottom of 96-well plate. (c) A 3 × 3 wells size copper sheet above the heat reflective sheet. (d) A 5 × 5 wells size copper sheet above the heat reflective sheet. The center of all these sheets was just above the well 6D. The CAP treatment was performed for 8 min in each case, targeting the well 6D. In each case, 100 μL/well of U87MG (12 × 104 cell/mL) were seeded in 96-well plate and cultured for 7 h before the treatment. The cells were cultured for 2 days before the final MTT assay. The normalized cell viability was obtained by using the protocols shown in Fig. 2. In each case, the mean value and the s.d. of the normalized cell viability were presented in the left panel and the right panel, respectively. Results were presented as the mean ± s.d. of the experiments repeated 2 times. The original data were shown in Supplementary Fig. S5.

References

    1. Tanaka S, Louis DN, Curry WT, Batchelor TT, Dietrich J. Diagnostic and therapeutic avenues for glioblastoma: No longer a dead end ? Nat. Rev. Clin. Oncol. 2013;10(1):14. doi: 10.1038/nrclinonc.2012.204. - DOI - PubMed
    1. Holland EC. Glioblastoma multiforme: The terminator. Proc. Natl. Acad. Sci. U.S.A. 2000;97(12):6242–6244. doi: 10.1073/pnas.97.12.6242. - DOI - PMC - PubMed
    1. Stupp R, et al. Radiotherapy plus concomitant and adjuvant temozolomide for glioblastoma. N. Engl. J. Med. 2005;352(10):987–996. doi: 10.1056/NEJMoa043330. - DOI - PubMed
    1. Chinot OL, et al. Bevacizumab plus radiotherapy–temozolomide for newly diagnosed glioblastoma. N. Engl. J. Med. 2014;370(8):709–722. doi: 10.1056/NEJMoa1308345. - DOI - PubMed
    1. Schütze A, et al. A review and comparison to other plasma sources. IEEE Trans. Plasma Sci. 1998;26(6):1685–1694. doi: 10.1109/27.747887. - DOI

Publication types