. 2020 Jul 16;10(1):11715.
doi: 10.1038/s41598-020-68638-3.

Differential expression of Na+/K+/Cl- cotransporter 1 in neurons and glial cells within the superficial spinal dorsal horn of rodents

Affiliations

Differential expression of Na+/K+/Cl- cotransporter 1 in neurons and glial cells within the superficial spinal dorsal horn of rodents

Fariba Javdani et al. Sci Rep. .

Abstract

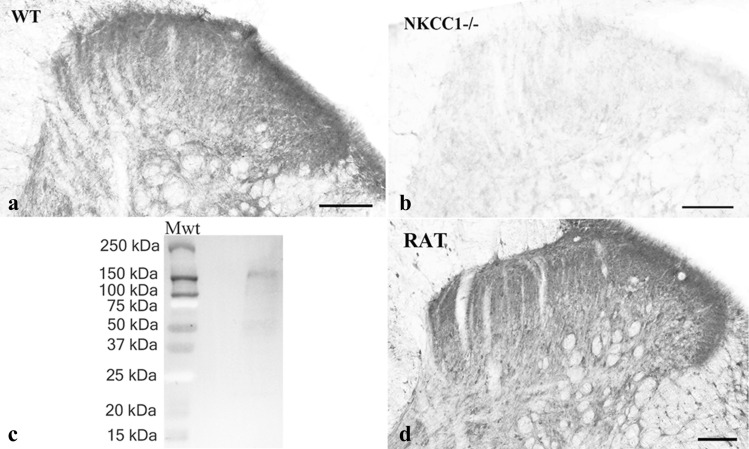
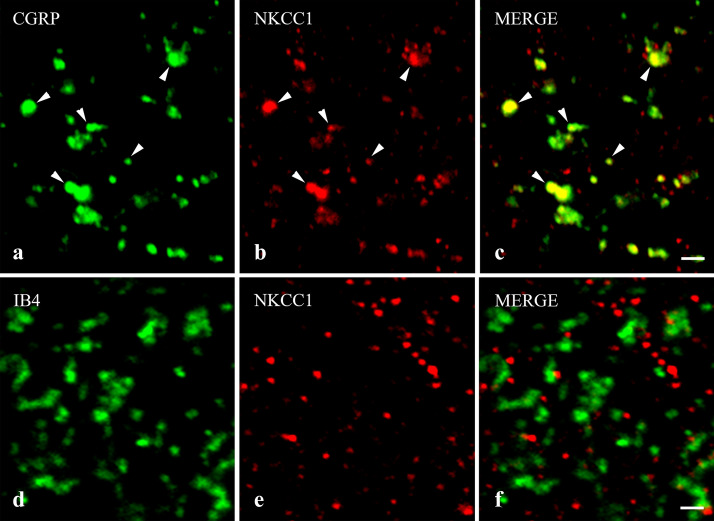
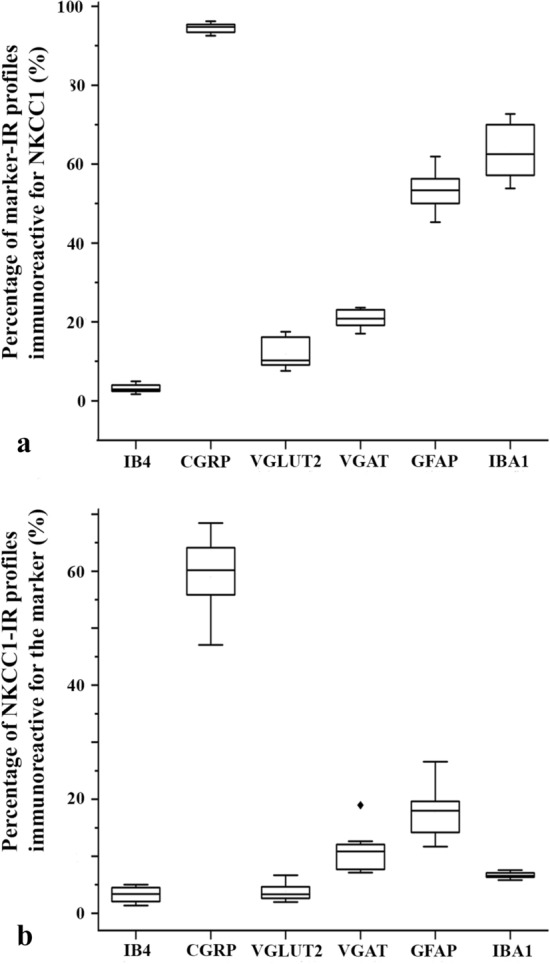
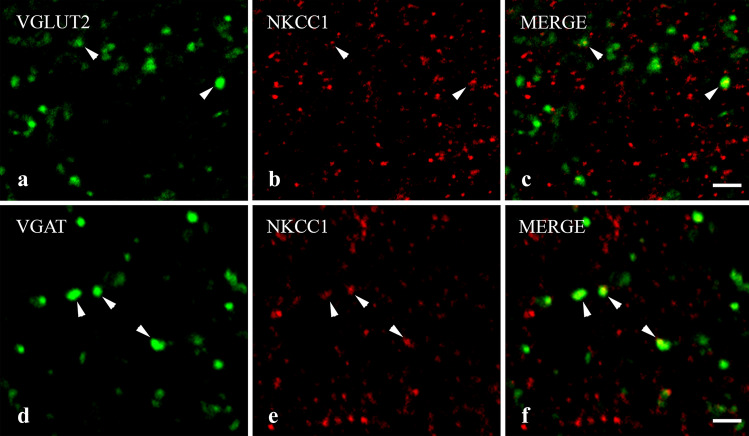
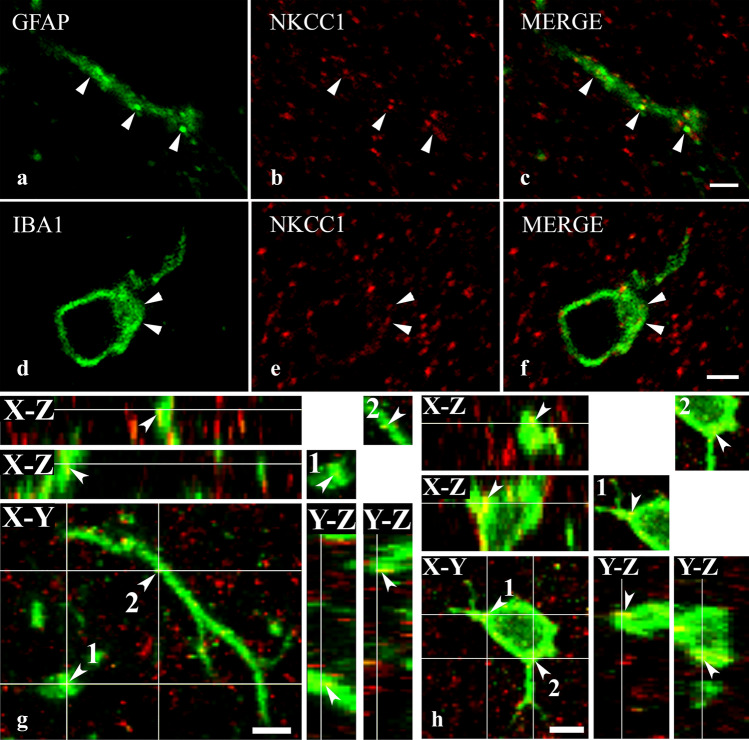
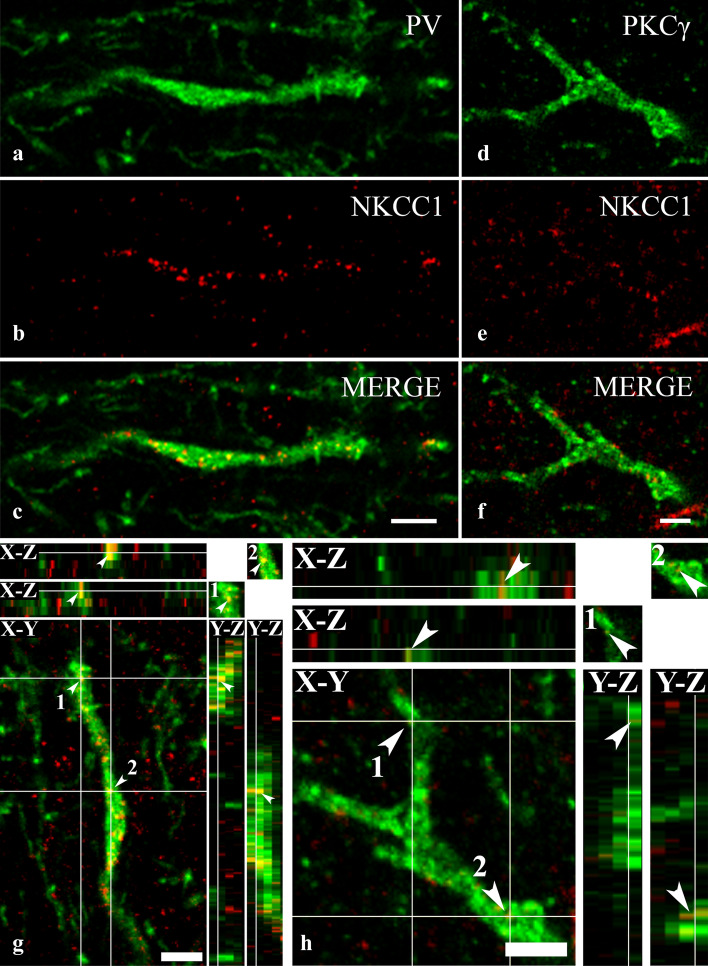
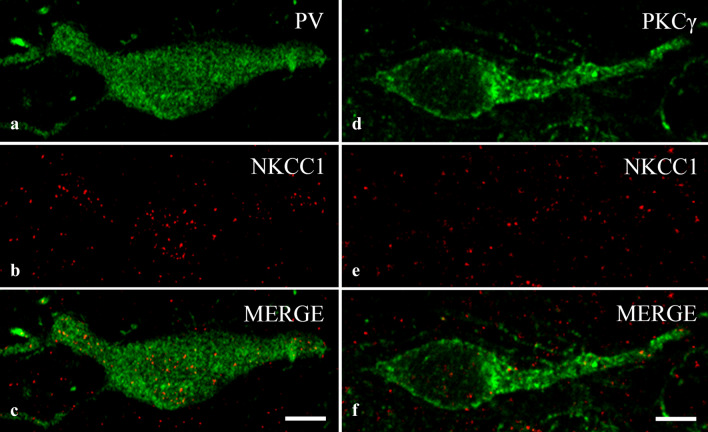
Although convincing experimental evidence indicates that Na+/K+/Cl- cotransporter 1 (NKCC1) is involved in spinal nociceptive information processing and in the generation of hyperalgesia and allodynia in chronic pain states, the cellular distribution of NKCC1 in the superficial spinal dorsal horn is still poorly understood. Because this important piece of knowledge is missing, the effect of NKCC1 on pain processing is still open to conflicting interpretations. In this study, to provide the missing experimental data, we investigated the cellular distribution of NKCC1 in the superficial spinal dorsal horn by immunohistochemical methods. We demonstrated for the first time that almost all spinal axon terminals of peptidergic nociceptive primary afferents express NKCC1. In contrast, virtually all spinal axon terminals of nonpeptidergic nociceptive primary afferents were negative for NKCC1. Data on the colocalization of NKCC1 with axonal and glial markers indicated that it is almost exclusively expressed by axon terminals and glial cells in laminae I-IIo. In lamina IIi, however, we observed a strong immunostaining for NKCC1 also in the dendrites and cell bodies of PV-containing inhibitory neurons and a weak staining in PKCγ-containing excitatory neurons. Our results facilitate further thinking about the role of NKCC1 in spinal pain processing.


Conflict of interest statement

The authors declare no competing interests.

Figures

Figure 1
Figure 1
Specificity of the anti-NKCC1 antibody and distribution of NKCC1 immunoreactivity in the spinal dorsal horn. a–b. Photomicrographs showing immunoreactivity for NKCC1 in wild-type (a) and knockout (b) mice. NKCC1 immunostaining can be observed in the dorsal horn of the wild-type mouse, while the immunoreactivity is completely abolished from the dorsal horn of the NKCC1 knockout animal. c. Western blot analysis reinforces the specificity of the anti-NKCC1 antibody. The single immunoreactive band on the full-length running gel indicates that the antibody detects a protein with a molecular mass of ~ 160 kDa that corresponds to the molecular mass of NKCC1. For the molecular weight calibration, the precision plus protein dual color standards were used on which the blue and red colors appear as gray and white, respectively, after the black and white conversion (Bio-Rad, Hercules, California, USA) d. Photomicrographs showing immunoreactivity for NKCC1 in the dorsal horn of the rat spinal cord. Scale bars: 100 µm.
Figure 2
Figure 2
Immunostaining for NKCC1 in spinal axon terminals of nociceptive primary afferents. Micrographs of 1 µm thick laser scanning confocal optical sections illustrating the colocalization between immunolabeling for NKCC1 (red; b, e) and immunoreactivity for markers that are specific for axon terminals of peptidergic (CGRP, green; a) and nonpeptidergic (IB4-binding, green; d) nociceptive primary afferents in the superficial spinal dorsal horn. Mixed colors (yellow) on the superimposed images (c, f) indicate double labeled structures. Some double-stained varicosities are marked with arrowheads. Note that NKCC1 immunoreactivity can be observed in most of the peptidergic and almost none in the nonpeptidergic axon terminals of nociceptive primary afferents. Scale bar: 2 µm.
Figure 3
Figure 3
Box plot histograms showing the degree of colocalization between immunoreactivity for NKCC1 and selected axonal and glial markers in laminae I–II of the spinal dorsal horn. (a) Percentage of profiles immunoreactive for the applied axonal and glial markers that were also labeled for NKCC1. (b) Percentage of profiles immunoreactive for NKCC1 that were found within the confines of areas immunostained for the applied axonal and glial markers.
Figure 4
Figure 4
Immunostaining for NKCC1 in axon terminals of spinal excitatory and inhibitory neurons. Micrographs of 1 µm thick laser scanning confocal optical sections illustrating the colocalization between immunolabeling for NKCC1 (red; b, e) and immunoreactivity for markers that are specific for excitatory (VGLUT2, green; (a) and inhibitory (VGAT, green; d) axon terminals of intrinsic neurons in the superficial spinal dorsal horn. Mixed colors (yellow) on the superimposed images (c, f) indicate double-labeled structures. Double-stained varicosities are marked with arrows. Scale bar: 2 µm.
Figure 5
Figure 5
Immunostaining for NKCC1 in astrocytes and microglial cells. Micrographs of 1 µm thick laser scanning confocal optical sections illustrating the colocalization between immunolabeling for NKCC1 (red; b, e) and immunoreactivity for markers that are specific to astrocytes (GFAP, green; a) and microglial cells (IBA1, green; d) in the superficial spinal dorsal horn. Mixed colors (yellow) on the superimposed images (c, f) indicate double-labeled structures. Micrographs of short series of confocal optical sections double immunostained for NKCC1 (red) and GFAP (green) or IBA1 (green) show the colocalization between NKCC1 and GFAP (g) as well as IBA1 (h) illustrated in X–Y, X–Z and Y–Z projections. Two selected points (labeled with 1 and 2) of colocalization between the markers are at the crossing point of two lines indicating the planes through which orthogonal views of X–Z and Y–Z projections were drawn. Small inserts in the upper right corner of both g and h show the selected two points in X–Y dimension without the lines. The corresponding X–Z and Y–Z projections are beside and below these inserts. According to the orthogonal images, as it is indicated by the mixed color (yellow), NKCC1 immunostained puncta 1 and 2 are within the confines of the GFAP as well as the IBA1 immunoreactive profiles. Double stained spots are marked with arrows. Scale bar: 5 µm (af), 2 µm (g, h).
Figure 6
Figure 6
Immunostaining for NKCC1 in dendrites of spinal neurons containing PV and PKCγ. Micrographs of 1 µm thick laser scanning confocal optical sections double stained for PV (a) and NKCC1 (b) and for PKCγ (d) and NKCC1 (e). Mixed colors on the merged images (c, f) indicate that NKCC1 is strongly expressed by dendrites of PV-IR dendrites (c), whereas NKCC1-IR puncta are only sparsely scattered over the PKCγ-IR dendritic segment (f). Micrographs of short series of confocal optical sections double immunostained for NKCC1 (red) and PV (green) or PKCγ (green) show the colocalization between NKCC1 and PV (g) as well as PKCγ (h) illustrated in X–Y, X–Z and Y–Z projections. Two selected points (labeled with 1 and 2) of colocalization between the markers are at the crossing point of two lines indicating the planes through which orthogonal views of X–Z and Y–Z projections were drawn. Small inserts in the upper right corner of both g and h show the selected two points in X–Y dimension without the lines. The corresponding X–Z and Y–Z projections are beside and below these inserts. According to the orthogonal images, as it is indicated by the mixed color (yellow), NKCC1 immunostained puncta 1 and 2 are within the confines of the PV as well as the PKCγ immunoreactive profiles. Scale bars: 5 µm (af), 2 µm (g, h).
Figure 7
Figure 7
Immunostaining for NKCC1 in the cell bodies of spinal neurons containing PV and PKCγ. Micrographs of 1 µm thick laser scanning confocal optical sections double stained for PV (a) and NKCC1 (b) and for PKCγ (d) and NKCC1 (e). The merged images (c, f) show strong expression of NKCC1 in the cell body of the PV-IR neuron (c) and moderate staining for NKCC1 in the PKCγ-IR neuron (f). Scale bars: 10 µm.

References

    1. Gamba G. Molecular physiology and pathophysiology of electroneutral cation-chloride cotransporters. Physiol. Rev. 2005;85:423–493. - PubMed
    1. Mercado A, Mount DB, Gamba G. Electroneutral cation-chloride cotransporters in the central nervous system. Neurochem. Res. 2004;29:17–25. - PubMed
    1. Payne JA, Rivera C, Voipio J, Kaila K. Cation-chloride co-transporters in neuronal communication, development and trauma. Trends Neurosci. 2003;26:199–206. - PubMed
    1. Ben-Ari Y. NKCC1 chloride importer antagonists attenuate many neurological and psychiatric disorders. Trends Neurosci. 2017;40:536–554. - PubMed
    1. Delpire E, Austin TM. Kinase regulation of Na+–K+–2Cl− cotransport in primary afferent neurons. J. Physiol. 2010;588:3365–3373. - PMC - PubMed

Publication types

Substances

LinkOut - more resources