

A novel three-dimensional magnetic particle imaging system based on the frequency mixing for the point-of-care diagnostics
- PMID: 32678265
- PMCID: PMC7366937
- DOI: 10.1038/s41598-020-68864-9
A novel three-dimensional magnetic particle imaging system based on the frequency mixing for the point-of-care diagnostics
Abstract
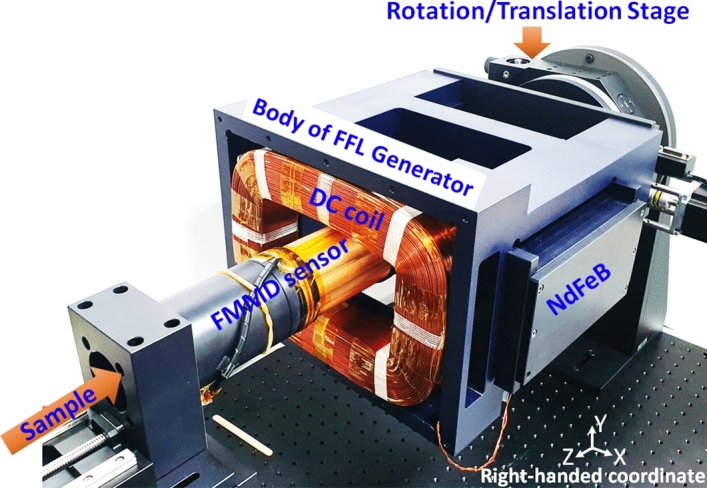
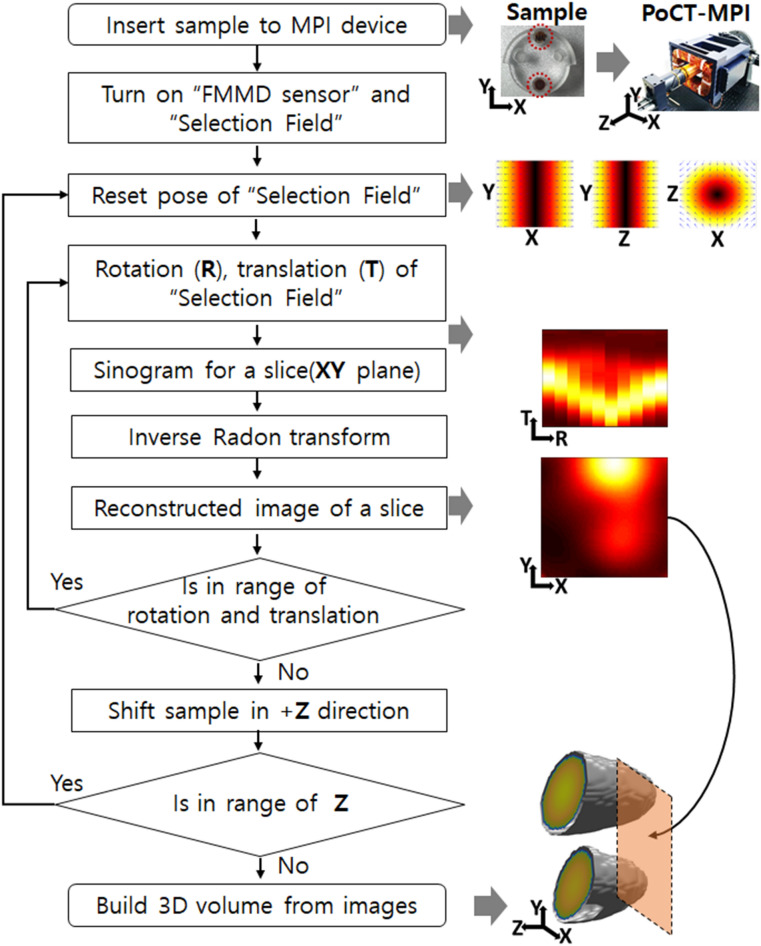
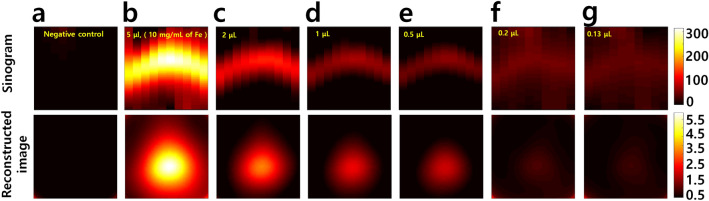
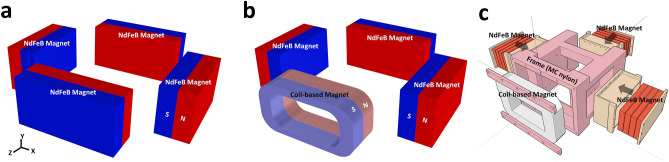
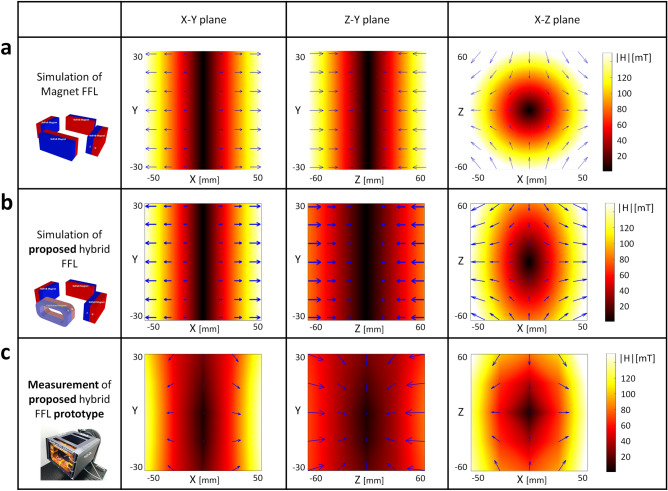
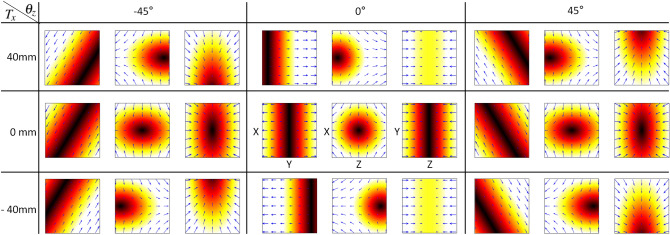
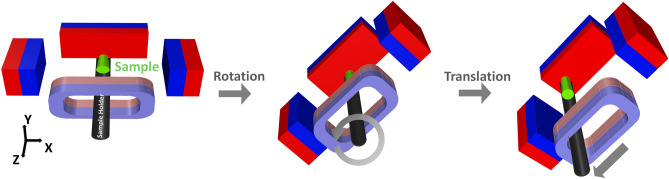
The magnetic particle imaging (MPI) is a technology that can image the concentrations of the superparamagnetic iron oxide nanoparticles (SPIONs) which can be used in biomedical diagnostics and therapeutics as non-radioactive tracers. We proposed a point-of-care testing MPI system (PoCT-MPI) that can be used for preclinical use for imaging small rodents (mice) injected with SPIONs not only in laboratories, but also at emergency sites far from laboratories. In particular, we applied a frequency mixing magnetic detection method to the PoCT-MPI, and proposed a hybrid field free line generator to reduce the power consumption, size and weight of the system. The PoCT-MPI is [Formula: see text] in size and weighs less than 100 kg. It can image a three-dimensional distribution of SPIONs injected into a biosample with less than 120 Wh of power consumption. Its detection limit is [Formula: see text], 10 mg/mL, [Formula: see text] (Fe).
Conflict of interest statement
The authors declare no competing interests.
Figures
Similar articles
-
In vivo Preclinical Tumor-Specific Imaging of Superparamagnetic Iron Oxide Nanoparticles Using Magnetic Particle Imaging for Cancer Diagnosis.Int J Nanomedicine. 2022 Aug 26;17:3711-3722. doi: 10.2147/IJN.S372494. eCollection 2022. Int J Nanomedicine. 2022. PMID: 36051351 Free PMC article.
-
Magnetic separation of iron oxide nanoparticles to improve their application for magnetic particle imaging.Phys Med Biol. 2021 Jan 8;66(1):015002. doi: 10.1088/1361-6560/abcd19. Phys Med Biol. 2021. PMID: 33227720
-
PGNet: Projection generative network for sparse-view reconstruction of projection-based magnetic particle imaging.Med Phys. 2023 Apr;50(4):2354-2371. doi: 10.1002/mp.16048. Epub 2022 Oct 23. Med Phys. 2023. PMID: 36239207
-
Magnetic Particle Imaging: Current and Future Applications, Magnetic Nanoparticle Synthesis Methods and Safety Measures.Int J Mol Sci. 2021 Jul 17;22(14):7651. doi: 10.3390/ijms22147651. Int J Mol Sci. 2021. PMID: 34299271 Free PMC article. Review.
-
Magnetic particle imaging: current developments and future directions.Int J Nanomedicine. 2015 Apr 22;10:3097-114. doi: 10.2147/IJN.S70488. eCollection 2015. Int J Nanomedicine. 2015. PMID: 25960650 Free PMC article. Review.
Cited by
-
MPI System with Bore Sizes of 75 mm and 100 mm Using Permanent Magnets and FMMD Technique.Sensors (Basel). 2024 Jun 10;24(12):3776. doi: 10.3390/s24123776. Sensors (Basel). 2024. PMID: 38931560 Free PMC article.
-
Operational Parameters for Sub-Nano Tesla Field Resolution of PHMR Sensors in Harsh Environments.Sensors (Basel). 2021 Oct 18;21(20):6891. doi: 10.3390/s21206891. Sensors (Basel). 2021. PMID: 34696103 Free PMC article.
-
A Novel Field-Free Line Generator for Mechanically Scanned Magnetic Particle Imaging.Sensors (Basel). 2024 Jan 31;24(3):933. doi: 10.3390/s24030933. Sensors (Basel). 2024. PMID: 38339650 Free PMC article.
-
Bridge Resistance Compensation for Noise Reduction in a Self-Balanced PHMR Sensor.Sensors (Basel). 2021 May 21;21(11):3585. doi: 10.3390/s21113585. Sensors (Basel). 2021. PMID: 34064121 Free PMC article.
-
Multimodality imaging of nanoparticle-based vaccines: Shedding light on immunology.Wiley Interdiscip Rev Nanomed Nanobiotechnol. 2022 Sep;14(5):e1807. doi: 10.1002/wnan.1807. Epub 2022 May 2. Wiley Interdiscip Rev Nanomed Nanobiotechnol. 2022. PMID: 35501142 Free PMC article. Review.
References
-
- Gleich B, Weizenecker J. Tomographic imaging using the nonlinear response of magnetic particles. Nature. 2005;435(7046):1214. - PubMed
-
- Krause H-J, Wolters N, Zhang Y, Offenhäusser A, Miethe P, Meyer MHF, Hartmann M, Keusgen M. Magnetic particle detection by frequency mixing for immunoassay applications. J. Magn. Magn. Mater. 2007;311(1):436–444.
-
- Hong H, Lim J, Choi C-J, Shin S-W, Krause H-J. Magnetic particle imaging with a planar frequency mixing magnetic detection scanner. Rev. Sci. Instrum. 2014;85(1):013705. - PubMed
Publication types
MeSH terms
LinkOut - more resources
Full Text Sources
