. 2022 Jun;64(4):694-713.
doi: 10.1177/0018720820939693. Epub 2020 Jul 17.

Toward a Theory of Visual Information Acquisition in Driving

Affiliations

Toward a Theory of Visual Information Acquisition in Driving

Benjamin Wolfe et al. Hum Factors. 2022 Jun.

Abstract

Objective: The aim of this study is to describe information acquisition theory, explaining how drivers acquire and represent the information they need.

Background: While questions of what drivers are aware of underlie many questions in driver behavior, existing theories do not directly address how drivers in particular and observers in general acquire visual information. Understanding the mechanisms of information acquisition is necessary to build predictive models of drivers' representation of the world and can be applied beyond driving to a wide variety of visual tasks.

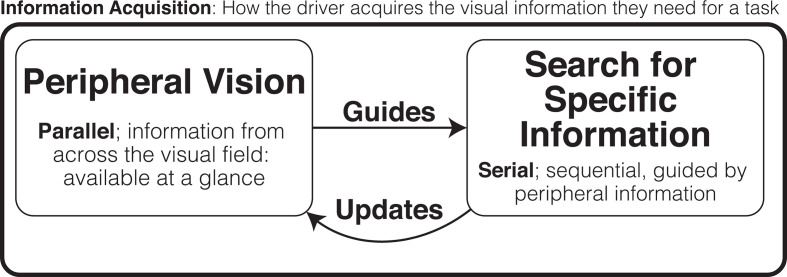
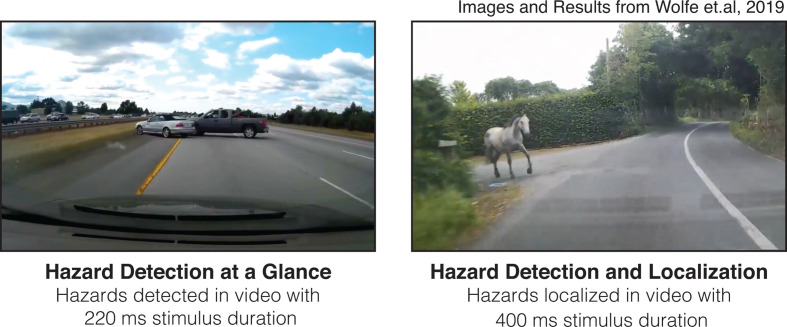
Method: We describe our theory of information acquisition, looking to questions in driver behavior and results from vision science research that speak to its constituent elements. We focus on the intersection of peripheral vision, visual attention, and eye movement planning and identify how an understanding of these visual mechanisms and processes in the context of information acquisition can inform more complete models of driver knowledge and state.

Results: We set forth our theory of information acquisition, describing the gap in understanding that it fills and how existing questions in this space can be better understood using it.

Conclusion: Information acquisition theory provides a new and powerful way to study, model, and predict what drivers know about the world, reflecting our current understanding of visual mechanisms and enabling new theories, models, and applications.

Application: Using information acquisition theory to understand how drivers acquire, lose, and update their representation of the environment will aid development of driver assistance systems, semiautonomous vehicles, and road safety overall.

Keywords: driving; information acquisition; peripheral vision; surface transportation; vision; visual attention.


Figures

Figure 1
Figure 1
Diagram of information acquisition theory, beginning with the information available across the visual field in a single glance, which guides visual search for specific information.
Figure 2
Figure 2
In a recent study by Wolfe and colleagues (2020), participants could detect hazards in real road scenes in a single glance (left panel) and could represent these hazards with sufficient fidelity to plan an evasive response with only enough time for a single eye movement (right).
Figure 3
Figure 3
Peripheral vision in driving, as visualized here with the texture tiling model (Balas et al., 2009), is sufficient to guide search for specific information. The green cross in each panel indicates the fixation location. The magenta arrow in (a) indicates an eye movement planned to the sign, which remains visible but not readable in the periphery. Note how the visualization changes in (b) when the fixation location shifts. Sufficient information is available in (a) to enable an accurate eye movement to the sign.
Figure 4
Figure 4
Understanding eye movements in information acquisition requires considering more than just where the driver looked. In order to understand how drivers acquire information, recorded gaze data must reflect where the driver looked, what they looked at, and what they were doing at the time. However, merely knowing where the driver looked and what they looked at may not be sufficient to indicate their task.

References

    1. Anstis S. (1998). Picturing peripheral acuity. Perception, 27, 817–825.10.1068/p270817 - DOI - PubMed
    1. Anstis S. M. (1974). Letter: A chart demonstrating variations in acuity with retinal position. Vision Research, 14, 589–592.10.1016/0042-6989(74)90049-2 - DOI - PubMed
    1. Ariely D. (2001). Seeing sets: Representation by statistical properties. Psychological Science, 12, 157–162.10.1111/1467-9280.00327 - DOI - PubMed
    1. Balas B., Nakano L., Rosenholtz R. (2009). A summary-statistic representation in peripheral vision explains visual crowding. Journal of Vision, 9, 13–18.10.1167/9.12.13 - DOI - PMC - PubMed
    1. Biederman I. (1972). Perceiving real-world scenes. Science, 177, 77–80.10.1126/science.177.4043.77 - DOI - PubMed

Publication types

LinkOut - more resources