. 2021 Apr 23;117(5):1402-1416.
doi: 10.1093/cvr/cvaa214.

Single-cell RNA sequencing reveals the cellular heterogeneity of aneurysmal infrarenal abdominal aorta

Affiliations

Single-cell RNA sequencing reveals the cellular heterogeneity of aneurysmal infrarenal abdominal aorta

Guizhen Zhao et al. Cardiovasc Res. .

Abstract

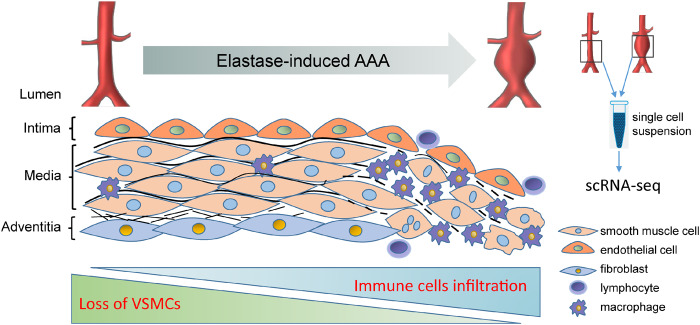
Aims: The artery contains numerous cell types which contribute to multiple vascular diseases. However, the heterogeneity and cellular responses of these vascular cells during abdominal aortic aneurysm (AAA) progression have not been well characterized.

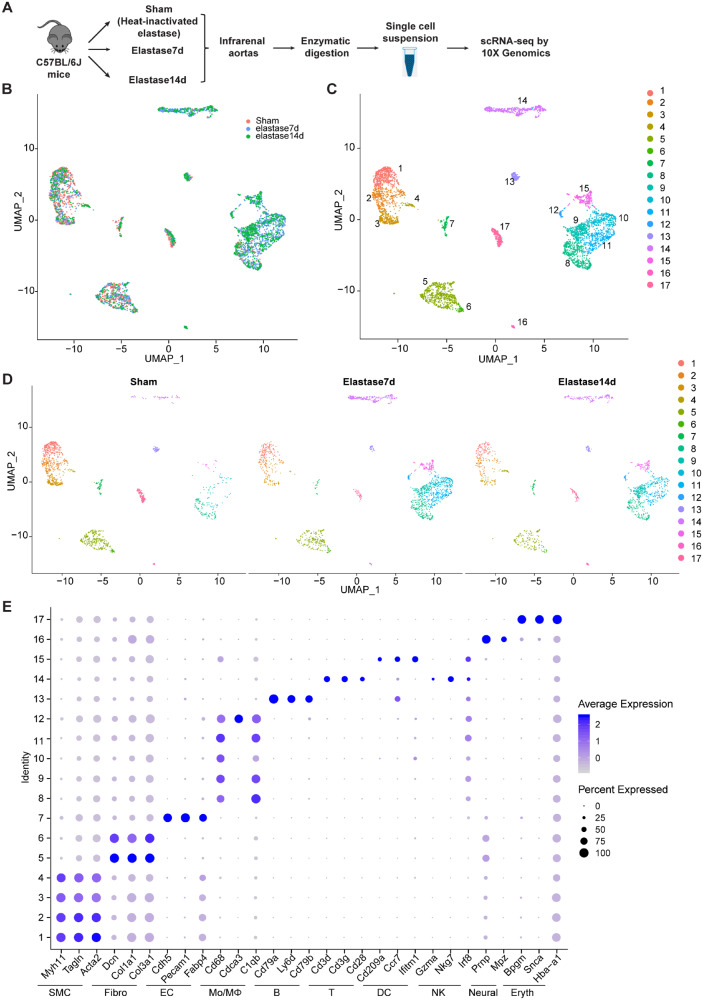
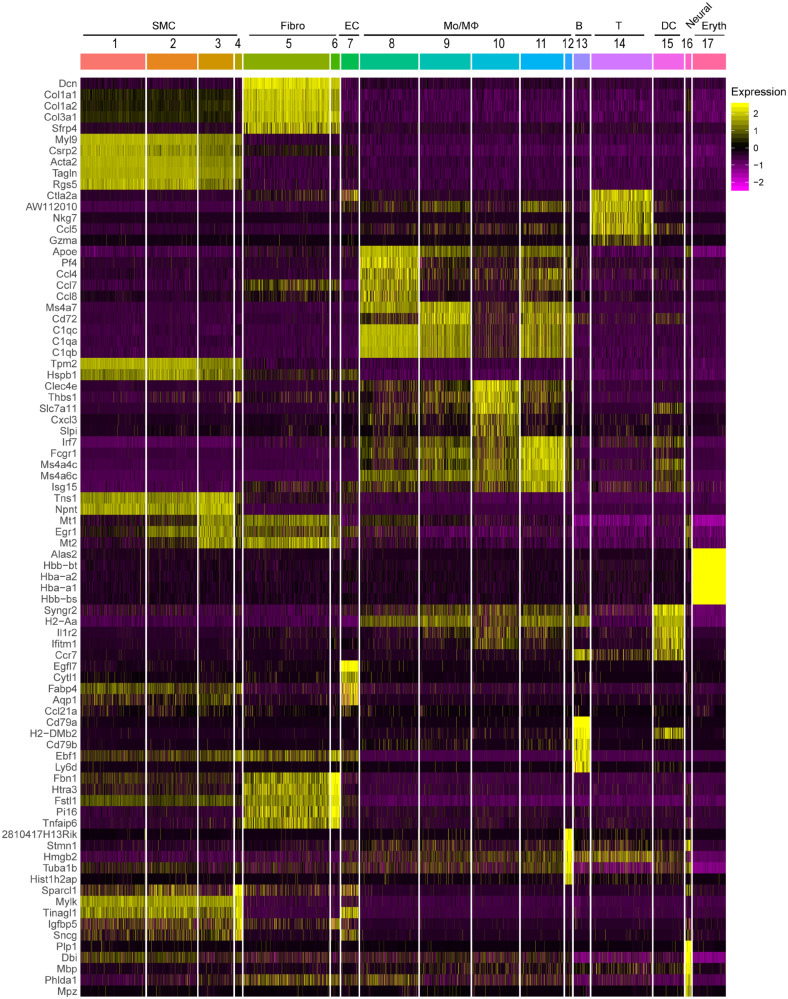
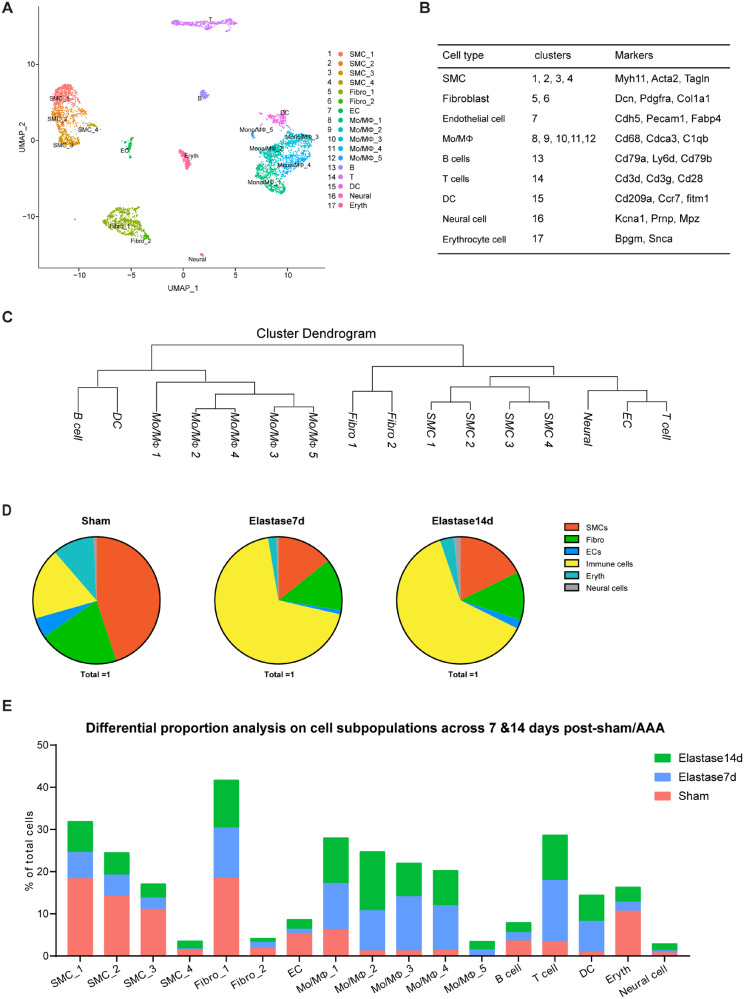
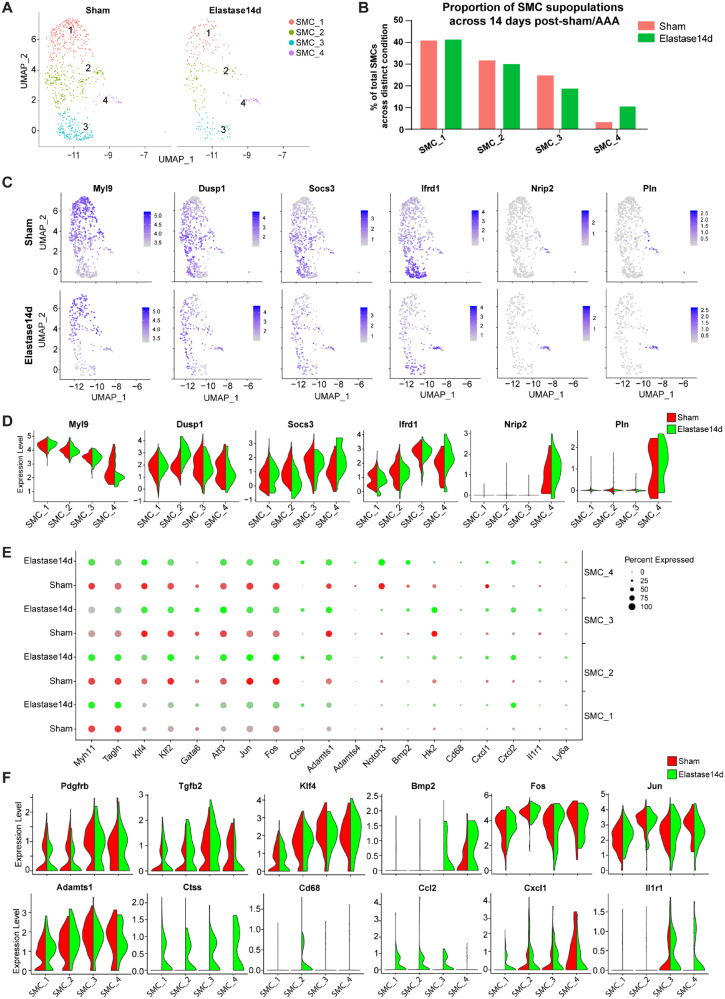
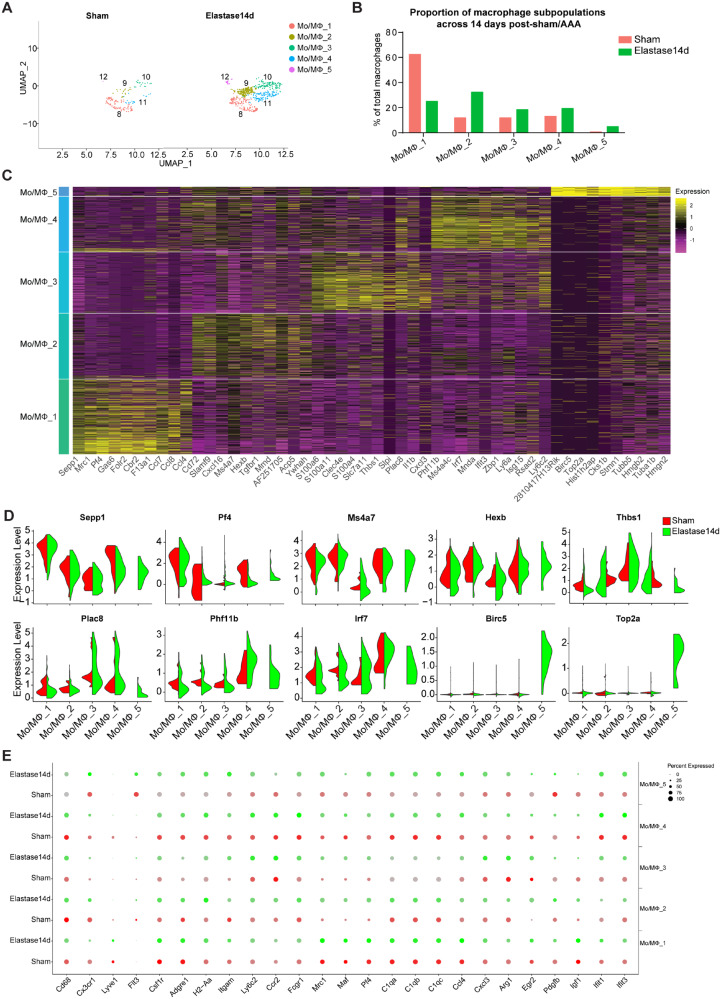
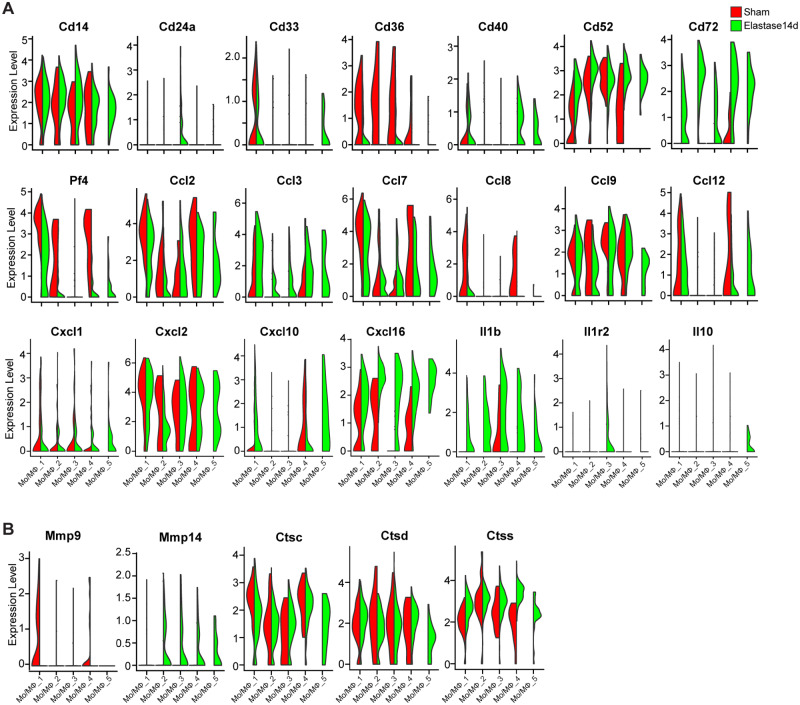
Methods and results: Single-cell RNA sequencing was performed on the infrarenal abdominal aortas (IAAs) from C57BL/6J mice at Days 7 and 14 post-sham or peri-adventitial elastase-induced AAA. Unbiased clustering analysis of the transcriptional profiles from >4500 aortic cells identified 17 clusters representing nine-cell lineages, encompassing vascular smooth muscle cells (VSMCs), fibroblasts, endothelial cells, immune cells (macrophages, T cells, B cells, and dendritic cells), and two types of rare cells, including neural cells and erythrocyte cells. Seurat clustering analysis identified four smooth muscle cell (SMC) subpopulations and five monocyte/macrophage subpopulations, with distinct transcriptional profiles. During AAA progression, three major SMC subpopulations were proportionally decreased, whereas the small subpopulation was increased, accompanied with down-regulation of SMC contractile markers and up-regulation of pro-inflammatory genes. Another AAA-associated cellular response is immune cell expansion, particularly monocytes/macrophages. Elastase exposure induced significant expansion and activation of aortic resident macrophages, blood-derived monocytes and inflammatory macrophages. We also identified increased blood-derived reparative macrophages expressing anti-inflammatory cytokines suggesting that resolution of inflammation and vascular repair also persist during AAA progression.

Conclusion: Our data identify AAA disease-relevant transcriptional signatures of vascular cells in the IAA. Furthermore, we characterize the heterogeneity and cellular responses of VSMCs and monocytes/macrophages during AAA progression, which provide insights into their function and the regulation of AAA onset and progression.

Keywords: Abdominal aortic aneurysm; Lineage heterogeneity; Macrophage; Single-cell RNA sequencing; Vascular smooth muscle cell.


Figures

None
Graphical abstract
Figure 1
Figure 1
Identification of cell clusters present in the mouse infrarenal abdominal aortas (IAA) by single-cell RNA sequencing (scRNA-seq). (A) Schematic diagram indicating the procedure for scRNA-seq. Sham, 14 days after heat-inactivated elastase-exposure; Elastase7d, 7 days after elastase-exposure; Elastase14d, 14 days after elastase exposure. For each experimental condition, the IAA cells were pooled from 5 mice in each group. (B) Uniform Manifold Approximation and Projection (UMAP) plot of aggregate IAA cells from Sham, Elastase7d and Elastase14d. Colours denote different conditions. After quality control, 1509, 1737, and 1396 cells from Sham, Elastase7d, and Elastase14d, respectively, were captured for clustering analysis. (C) UMAP plot of aggregate IAA cells with colours denoting different clusters. (D) UMAP plot of cell clusters in IAA cells across the indicated conditions. Colours denoting different clusters. (E) Dot plot of selected marker genes for each cluster and lineage in aggregate IAA cell clusters. Dot size indicates the percentage of cells expressing each gene, and dot colour indicates expression level. B, B cells; DC, dendritic cells; EC, endothelial cells; Eryth, erythrocytes; Fibro, fibroblasts; Mono/MΦ, monocytes/macrophages; Neural, neural cells; NK, natural killer cells; SMC, smooth muscle cells; T, T cells.
Figure 2
Figure 2
Heat map of the top 5 [by average Log(fold change)] genes with specific expression for each cell cluster in aggregate IAA cells. The top5 cluster-specific markers for each cluster were selected from the all markers of each cluster based on the average Log(fold change). The FindAllmarkers function in Seurat v3.0 was used with the parameters test. use = wilcox, min.pct = 0.25, thresh.use = 0.25, only.positive = TRUE and return.thresh = 0.01, to find all markers for each cluster.
Figure 3
Figure 3
Categorization of mouse IAA cell populations. (A) UMAP plot of aggregate IAA cells with identified cell lineages and subpopulations. Sham, n = 1509 cells. Elastase7d, n = 1737 cells. Elastase14d, n = 1396 cells. (B) Clusters and major cell types correspondence. (C) Dendrogram of the major cell types and subpopulations in IAA cells according to average RNA expression. (D) Fraction of each cell type in IAA cells across conditions (Control, elastase7d, and elastase14d). Sham, n = 1509 cells. Elastase7d, n = 1737 cells. Elastase14d, n = 1396 cells. (E) Cell population percentages across conditions.
Figure 4
Figure 4
Comparison of SMC subpopulations in IAA from Sham and AAA. (A) UAMP plot of the SMC subpopulations (1, SMC_1; 2, SMC_2; 3, SMC_3; 4, SMC_4) from Sham and Elastase14d. Sham, n = 678 SMCs. Elastase14d, n = 248 SMCs. (B) The percentages of the SMC subpopulations from Sham and Elastase14d. For Sham, SMC_1, n = 276 cells, SMC_2, n = 214 cells, SMC_3, n = 167 cells, SMC_4, n = 21 cells. For Elastase14d, SMC_1, n = 102 cells, SMC_2, n = 74 cells, SMC_3, n = 46 cell, SMC_4, n = 26 cell. (C) Expression of selected marker genes for the SMC subpopulations from Sham or Elastase14d as visualized by feature plots. (D) Expression of selected marker genes for SMC subpopulations from Sham and Elastase14d as visualized by Violin plots. (E) Dot plot of selected marker genes for each SMC subpopulation. Dot size indicates the percentage of cells within the group expressing each gene. Dot colour intensity indicates the gene expression level. With the limitation of Seurat V3.0, the colour scale bar for the average expression cannot be shown in on dotplot that have been split by different experimental conditions. (F) Violin plot of selected marker genes for each SMC subpopulation with colour denoting experimental conditions.
Figure 5
Figure 5
Comparison of monocyte and macrophage (Mo/MΦ) subpopulations in IAA from Sham and AAA. (A) UAMP plot of Mo/MΦ subpopulations from Sham and Elastase14d. Sham, n = 152 Mo/MΦs. Elastase14d, n = 602 Mo/MΦs. (B) The percentages of macrophage subpopulations from Sham and Elastase14d. For Sham, Mo/MΦ_1, n = 95 cells, Mo/MΦ_2, n = 18 cells, Mo/MΦ_3, n = 18 cells, Mo/MΦ_4, n = 20 cells, Mo/MΦ_5, n = 1 cells. For Elastase14d, Mo/MΦ_1, n = 151 cells, Mo/MΦ_2, n = 195 cells, Mo/MΦ_3, n = 111 cells, Mo/MΦ_4, n = 116 cells, Mo/MΦ_5, n = 29 cells. (C) Heat map of the top 10 [by average Log(fold change)] genes for each Mo/MΦ cell subpopulation. (D) Expression of selected marker genes for Mo/MΦ subpopulations as visualized by Violin plot, with colour denoting experimental conditions. (E) Dot plot of selected marker genes for Mo/MΦ subpopulations from Control and Elastase14d, where the dot size corresponds to the percentage of cells within the group expressing each gene, and dot colour intensity corresponds to the gene expression level.
Figure 6
Figure 6
Violin plot of the differential expression of inflammation- and extracellular matrix (ECM) degradation-associated genes by Mo/MΦ subpopulations. (A) The inflammation-associated genes, including cluster of differentiation (Cd), C-C motif chemokine ligand (Ccl), C-X-C motif chemokine ligand (Cxcl), and interleukin (Il), were expressed by each Mo/MΦ subpopulations with colour denoting experimental conditions. (B) The ECM degradation-associated genes, including Mmp-9, Mmp-14, Cathepsin C (Ctsc), Ctsd, and Ctss, were expressed by each Mo/MΦ subpopulations with colour denoting experimental conditions.

Comment in

References

    1. Davis FM, Daugherty A, Lu HS.. Updates of recent aortic aneurysm research. Arterioscler Thromb Vasc Biol 2019;39:e83–e90. - PMC - PubMed
    1. Nordon IM, Hinchliffe RJ, Loftus IM, Thompson MM.. Pathophysiology and epidemiology of abdominal aortic aneurysms. Nat Rev Cardiol 2011;8:92–102. - PubMed
    1. Rabkin SW. The role matrix metalloproteinases in the production of aortic aneurysm. Prog Mol Biol Transl Sci 2017;147:239–265. - PubMed
    1. Zhao G, Fu Y, Cai Z, Yu F, Gong Z, Dai R, Hu Y, Zeng L, Xu Q, Kong W.. Unspliced XBP1 confers VSMC homeostasis and prevents aortic aneurysm formation via FoxO4 interaction. Circ Res 2017;121:1331–1345. - PubMed
    1. Raffort J, Lareyre F, Clement M, Hassen-Khodja R, Chinetti G, Mallat Z.. Monocytes and macrophages in abdominal aortic aneurysm. Nat Rev Cardiol 2017;14:457–471. - PubMed

Publication types

MeSH terms

Substances